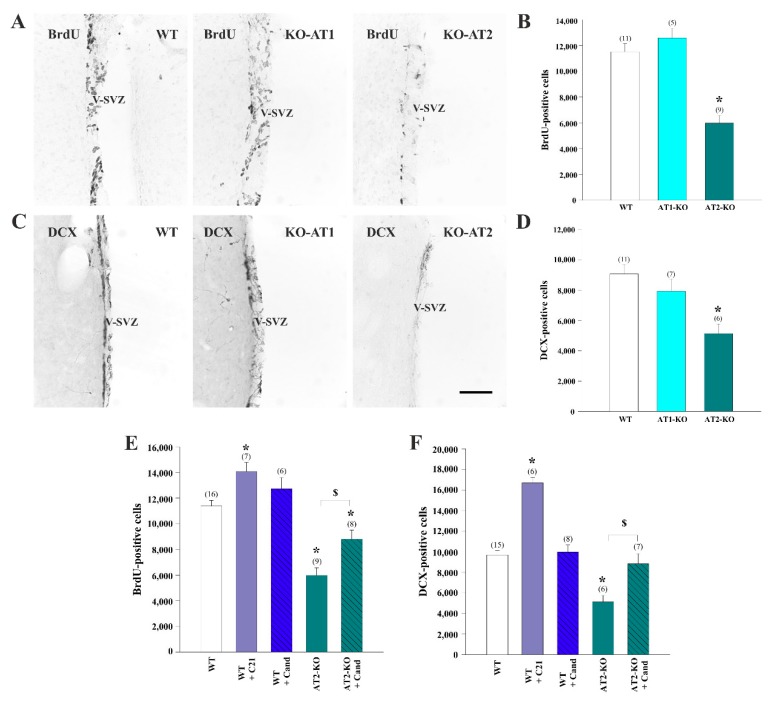
Figure 3.
Bromodeoxyuridine (BrdU (A,B) or doublecortin (DCX)-immunoreactive (-ir) (C,D) cells in the ventricular–subventricular zone (V-SVZ) of wild-type (WT) mice, AT1 receptor-deficient mice (AT1-KO), and AT2-deficient mice (AT2-KO). Number of BrdU (E) and DCX-ir (F) cells in the V-SVZ of WT mice, WT mice treated with the AT1 antagonist candesartan (Cand), WT mice treated with the AT2 agonist C21, and AT2-KO mice untreated or treated with candesartan for 15 days. Data are means ± SEM. * p < 0.05 relative to WT controls (one-way ANOVA and Bonferroni post hoc test); in figures (E,F), $ p < 0.05 relative to AT2-KO group (Student’s t-test). ANOVA = analysis of variance. Scale bar: 200 μm.

