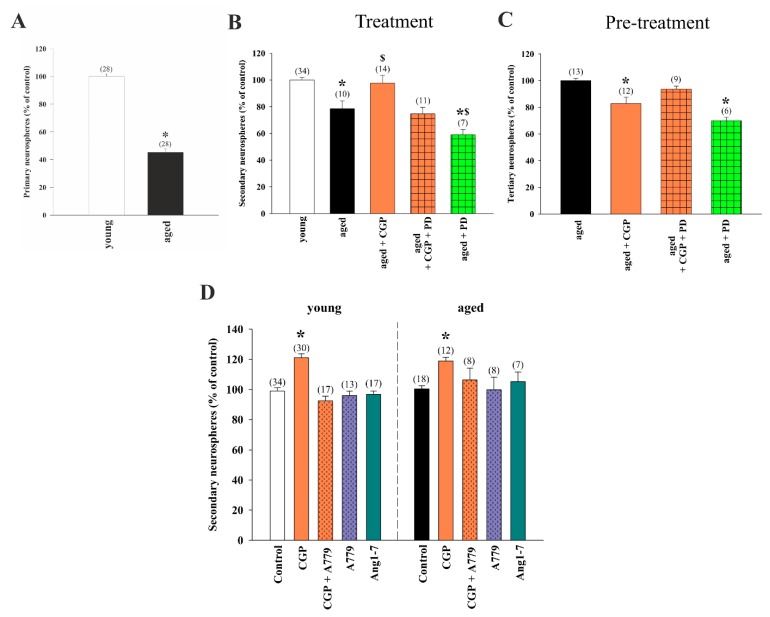
Figure 5.
(A) Generation of neurospheres from the ventricular–subventricular zone (V-SVZ) of aged mice (20–22 months old) compared to young mice (3–4 months old). Bar graphs showing the number of spheres quantified after treatment with the AT2 receptor agonist CGP42112A and the AT2 receptor antagonist PD123319 ((B); treatment), or in cultures derived from neurospheres pre-treated with AT2 agonists and reseeded in the absence of any treatment ((C); neurospheres derived from cultures pre-treated with AT2 agonists; pre-: previously treated with). (D) Number of neurospheres after treatment with CGP42112A and the Mas receptor antagonist A779 or the Mas receptor agonist angiotensin 1–7 (Ang 1–7). All culture data were obtained from at least three separate experiments. Data are means ± SEM. * p < 0.05 relative to control group; in figure (B), $ p < 0.05 relative to aged group (one-way ANOVA and Bonferroni post hoc test). SEM = standard error of the mean; ANOVA = analysis of variance.

