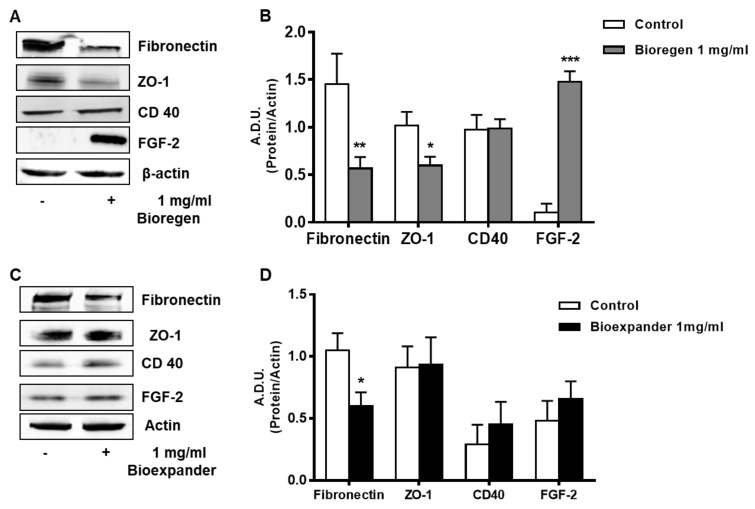
Figure 4.
Analysis of the proteins involved in angiogenesis and inflammation in ECs. HUVEC cells were treated for 18 h with the 1 mg/mL HA preparations Bioregen® (A,B) (grey columns) and Bioexpander® (C,D) (black columns). In panels (A,C), a representative blot out of 3 is shown, while panels (B,D) report protein quantification. Data are reported as A.D.U of the protein of interest with respect to beta-actin. * p < 0.05, and ** p < 0.01 vs. basal control condition.

