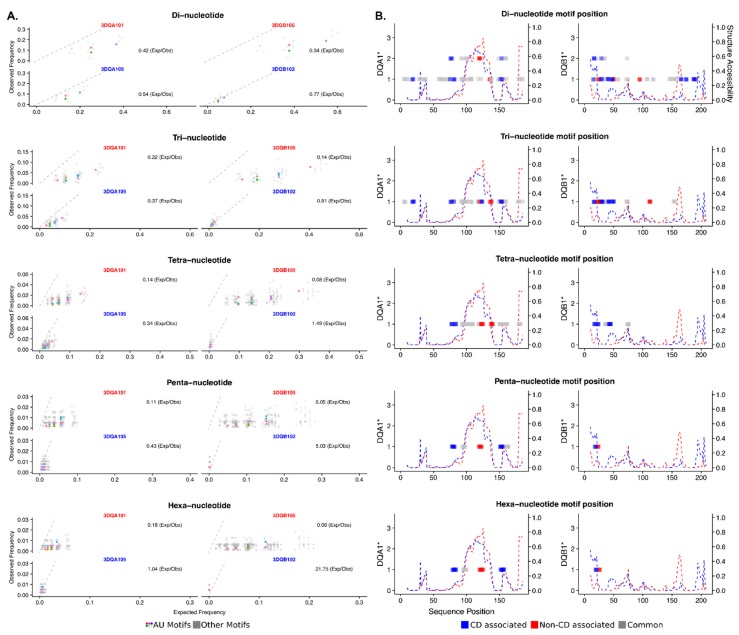
Figure 3.
AU-rich motif analysis of the DQA1* and DBQ1* genes reveals key differences. (A) All possible di-, tri-, tetra-, penta- and hexa-mers are assessed for their observed frequencies against their expected frequencies. AU-rich motifs are colored, non-AU rich in grey. All AU-rich kmer motifs have higher enrichments in the CD associated DQA1*05 and DQB1*02 alleles as compared to the non-CD associated DQA1*01 and DQB1*05 alleles. (B) Mapping the AU-rich motifs to their position within the 3′UTR sequences reveals a clear enrichment in AU-motifs throughout the CD associated alleles DQA1*05 and DQB1*02 (Blue) as compared to the non-CD associated DQA1*01 and DQB1*05 alleles (Red). Nested motifs are indicated on the y-axis; for example, two overlapping motifs will show a score of 2. A structure accessibility score indicates the likelihood the RNA single stranded, an absence of base-pairing, across its length. A score of 1.0 indicates the structure is single stranded.

