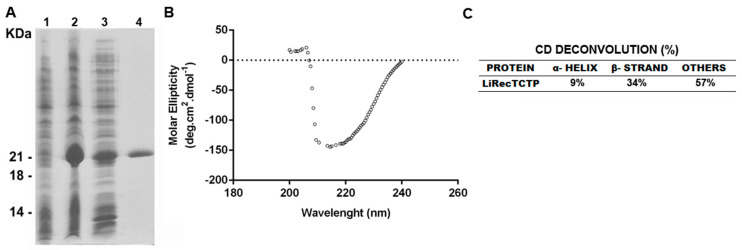
Figure 1.
Heterologous expression, purification, and circular dichroism spectroscopy CD analyses of recombinant LiTCTP. (A) SDS-PAGE (12.5%) analysis of recombinant LiTCTP toxin expression stained with Coomassie blue dye. Lane 1 show E. coli BL21 (DE3) pLysS cells before induction with IPTG. Lane 2 shows E. coli BL21(DE3) pLysS after induction for 4h with 0.1 mM isopropyl-d-thiogalactoside (IPTG) (supernatant from cell lysates obtained by freezing and thawing in extraction buffer before incubation with Ni2+-NTA beads). Lane 3 depicts the void from Ni2+-NTA chromatography. Lane 4 shows eluted recombinant protein from Ni2+-NTA beads. Molecular mass markers are shown on the left. (B) The UV-CD spectrum was obtained in a Jasco J-810 spectropolarimeter (Jasco Corporation, Tokyo, Japan) by diluting the sample at 0.5 mg/mL in phosphate buffer, pH 7.4 at 20 °C. Graphic representation was plotted using GraphPad Prism 6. (C) The deconvolution of data, α-helix and β-sheet percentages of LiRecTCTP structure was calculated using K2D3 tool.

