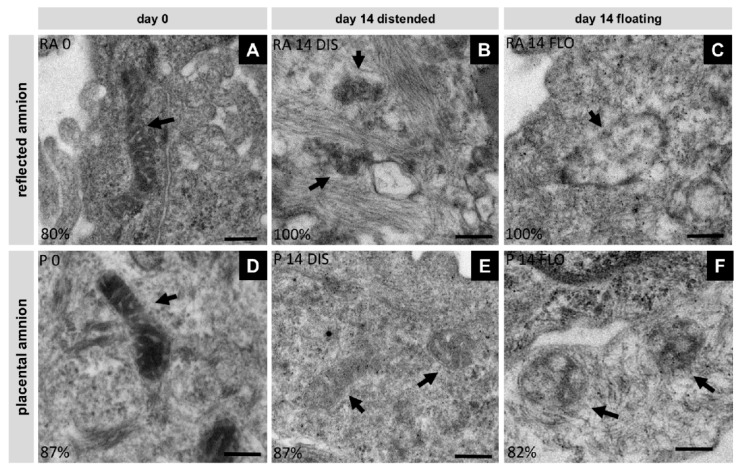
Figure 5.
Changes in mitochondrial morphology were analyzed with transmission electron microscopy (Tecnai 20, FEI Europe, Eindhoven, Netherlands) in reflected (RA) (A,B,C) and placental (P) (D,E,F) amnion at day 0 (A,D) and at day 14 in biopsies cultivated while mechanically stretched (B,E) or kept floating (C,F), n = 2 (donors). Scale bar: 200 nm. Arrows indicate mitochondria. DIS: distended biopsies; FLO: floating biopsies.

