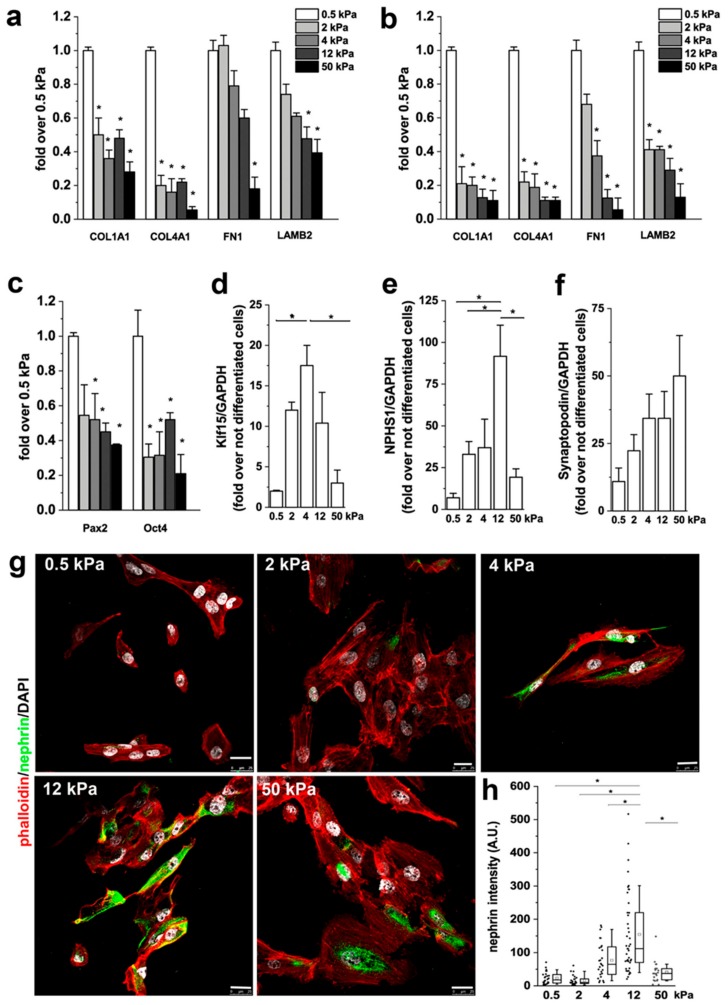
Figure 5.
Substrate stiffness controls podocyte differentiation of RPCs. (a) mRNA levels of extracellular matrix (ECM) components as assessed by qRT-PCR in RPCs. (b) mRNA levels of ECM components assessed by qRT-PCR in RPCs following 48 h treatment with 10 ng/mL transforming growth factor (TGF)-β. (c) mRNA expression of Pax2 and Oct-4 after 2 weeks in culture. (d–f) mRNA levels for Klf15, nephrin (NPHS1) and synaptopodin. Data are mean ± SE of two independent experiments (replicate n = 3). (g) Confocal images of F-actin, immunodetected by phalloidin (red), nephrin (green) and nuclei with DAPI counterstain (white), in RPCs differentiated toward podocytes on substrates with different stiffness. (h) Quantification of nephrin fluorescence intensity in RPCs as a function of stiffness. At least 20 cells for each condition were analyzed. Box-and-whisker plots: line = median, box = 25–75%, whiskers = 10–90%. Scale bar is 25 μm. *p < 0.05 using one-way ANOVA followed by Tukey’s test.

