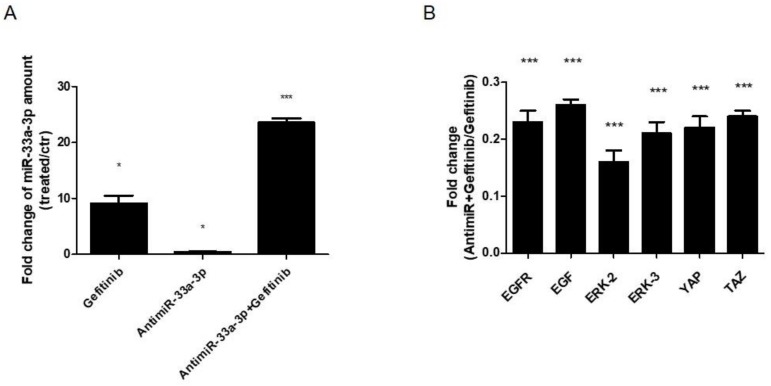
Figure 8.
Analysis of gene expression on hMSCs after Gefitinib treatments (36 h) and antimiR-33a-3p transfection (24 h). qRT-PCR was performed after 36 h of treatments: (A) miR-33a-3p; (B) EGFR-2, EGF, ERK-2, ERK3, YAP, and TAZ. Quantitative RT-PCR data are expressed as fold of change (FOI) in gene expression (2−ΔΔCt) that occurred in hMSCs after treatments vs. scramble groups and hMSCs after antimiR-33a-3p transfection and Gefitinib treatments vs. Gefitnib groups. Student t test: * p < 0.05, ** p < 0.005, *** p < 0.0005 between experimental group.

