Abstract
The osteoclast is a multinucleated monocyte/macrophage lineage cell that degrades bone. Here we used lineage tracing studies, labeling cells expressing Cx3cr1, Csf1r, or Flt3 to identify the precursors of osteoclast in mice. We identified an erythromyeloid progenitor (EMP)-derived osteoclast precursor population. Yolk-sac macrophages of EMP origin produced neonatal osteoclasts that can create a space for postnatal bone marrow hematopoiesis. Furthermore, EMPs gave rise to long-lasting osteoclast precursors that contributed to postnatal bone remodeling in both physiological and pathological settings. Our single cell RNA-sequencing data showed that EMP-derived osteoclast precursors arose independently from hematopoietic stem cell (HSC) lineage and the data from fate tracking of EMP- and HSC-lineage provided a possibility of cell-cell fusion between both lineages. Cx3cr1+ yolk-sac macrophage descendants resided in the adult spleen and parabiosis experiments showed that they migrated through the circulation to the remodeled bone after the injury.
Introduction
Bone is a multi-functional organ that not only sustains the vertebrate skeletons but also provides mineral storage and space for hematopoiesis throughout life. This tissue is remodeled continuously to maintain its structure and adapt to the changing environment. Bone remodeling is driven by a balance of cells that degrade and produce bone1. Osteoblasts and osteocytes play an essential role in the production of mineralized bone and are derived from mesenchymal precursors or skeletal stem cells2–4. Osteoclasts are involved in the resorption of bone tissue and are a monocyte/macrophage lineage cell5, 6 that differentiate from precursors under the influence of receptor activator of NF-κβ ligand (RANKL)7, 8 and undergo cell fusion to form a multinucleated cell9, 10.
Monocyte/macrophage lineage cells can differentiate from several precursors, and the different precursors give rise to distinct tissue-specific macrophage populations. Hematopoietic stem cells (HSCs), the yolk-sac, or cells in the fetal liver can all produce macrophages11, 12. In mice, primitive hematopoiesis starts around embryonic day 7 (E7) in the blood island of the yolk-sac13–17. Early erythromyeloid progenitors (EMPs) appear around E7–7.5 in the yolk-sac11, 18 and can differentiate into colony stimulating factor 1 receptor (CSF1R) positive yolk-sac macrophages at E8.514, 19. This first wave of EMPs occur in a transcriptional activator Myb-independent manner17, 20. Myb-independent early EMPs can develop from E8.25 and differentiate into CX3C chemokine receptor 1 (CX3CR1) positive yolk-sac macrophages at E8.5, which are also called premacrophages, resulting in a source of tissue-resident macrophages21. The second wave of EMPs, also known as late EMPs, emerge from the yolk-sac at E8.5 and migrate to the fetal liver, resulting in a source of fetal liver monocytes22. Later in development, hematopoietic stem cell precursors (pro-HSCs) emerge in the aortogonado-mesonephros region at E10.5 and differentiate to embryonic HSCs at E12.5, which later shift to the bone marrow17. Bone marrow HSCs eventually establish the circulating monocyte-derived macrophages11.
Here we sought to identify osteoclasts derived from EMPs and investigate their contribution to postnatal bone homeostasis and remodeling. Our fate-mapping experiments and single cell RNA-sequencing (scRNA-seq) reveal that yolk-sac macrophages of EMP origin differentiate into osteoclasts in the neonatal stage and these cells contribute to building the medullary space for interosseous hematopoiesis. In addition, progenies of Cx3cr1+ yolk-sac macrophages provide long-lasting osteoclast precursors that participate in cell-cell fusion with local precursors and contribute to the postnatal bone remodeling in both physiological and pathological setting. Parabiosis and splenectomy show that Cx3cr1+ yolk-sac macrophage decedents residing in adult spleen migrate to the injury site via the bloodstream and differentiate into osteoclasts contributing to the remodeling after bone injury.
RESULTS
Csf1r+ yolk-sac macrophage give rise to the neonatal osteoclasts
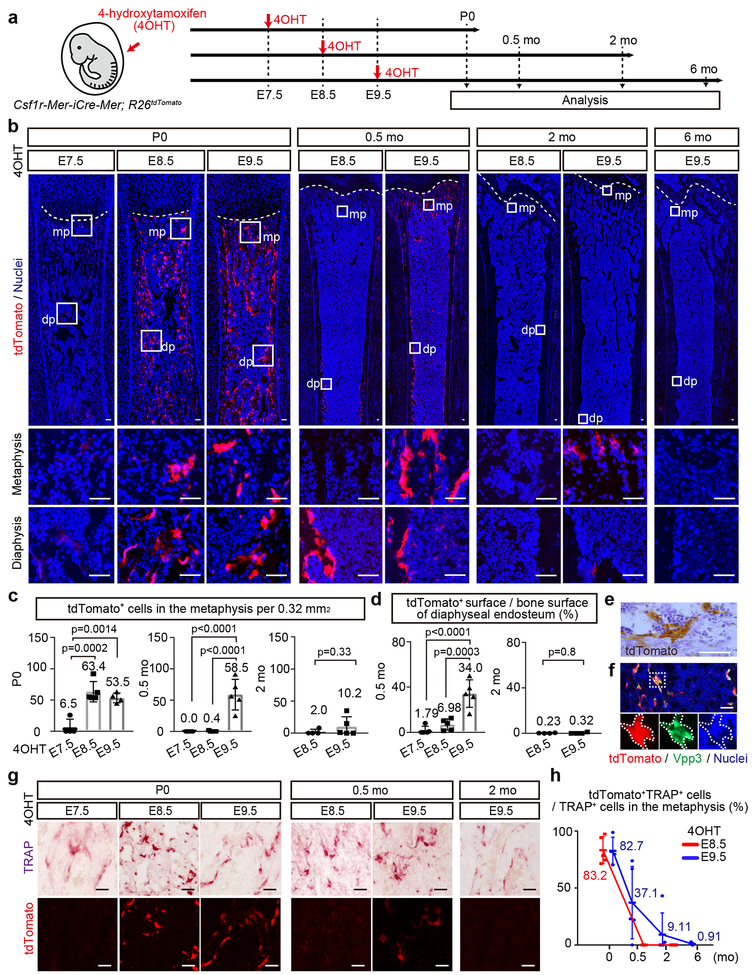
To investigate the potential contribution of EMPs to the postnatal osteoclast, Csf1r-Mer-iCre-Mer; Rosa26tdTomato (R26tdTomato) mice were singly injected with 4-hydroxytamoxifen (4OHT) at E7.5, E8.5 or, E9.5, resulting in irreversible tdTomato expression in Csf1r-expressing cell and their progenies (Fig. 1a). Since Csf1r-expressing macrophages in the yolk-sac appear at E8.518, 22 and peek between E9.5 and E10.523, induction at E8.5 will label the majority of Csf1r+ yolk-sac macrophages and their progenies24. E9.5 induction labels macrophages derived from definitive myeloid progenitors that emerge later than yolk-sac macrophages. Because Cre-recombination peaks at 6 hrs and terminates 24 hrs after 4OHT injection24, 25, induction at E7.5 should barely label the earliest cells expressing Csf1r with tdTomato.
Figure 1. Csf1r+ yolk-sac macrophages give rise to the neonatal osteoclasts.
(a) Schematic representation of the fate-mapping analysis of Csf1r-expressing cells and their progenies. E, embryonic day. P, postnatal day. mo, month-old. 4OHT, 4-hydroxytamoxifen. (b) Representative images of tdTomato expressing cells on the postnatal femurs at defined ages and time point of 4OHT induction (P0 (E7.5, n=4; E8.5, n=5; E9.5, n=4), 0.5 mo (E8.5, n=5; E9.5, n=5), 2 mo (E8.5, n=4; E9.5, n=5), and 6 mo (E9.5, n=4)). n representing independent animals. mp, metaphysis. dp, diaphysis. Scale bars, 50 μm. (c) The number of tdTomato+ cells in the metaphysis per 0.32 mm2 at P0 (E7.5, n=4; E8.5, n=5; E9.5, n=4), 0.5 mo (E7.5, n=5; E8.5, n=5; E9.5, n=5), and 2 mo (E8.5, n=4; E9.5, n=5). n representing independent animals. One-way ANOVA (P0, 0.5 mo) and unpaired two-tailed t-test (2 mo). Error bars denote means ± s.d. (d) Percentage of tdTomato+ surface area to the total bone surface area of the endosteum at 0.5 mo (E7.5, n=5; E8.5, n=5; E9.5, n=5) and 2 mo (E8.5, n=4; E9.5, n=5). n representing independent animals. One-way ANOVA (0.5 mo) and unpaired two-tailed t-test (2 mo). Error bars denote means ± s.d. (e) Representative image of immunostaining for tdTomato indicating the multinucleation of tdTomato+ cells from three independent experiments. Scale bar, 50 μm. (f) Representative image of tdTomato expression and antibody staining with Vpp3. Nuclei staining with hoechst showing the multinucleation. Three independent experiments. Scale bar, 50 μm. (g) Representative image of tdTomato+ and TRAP+ cells on the postnatal femur at defined age and time point of 4OHT induction (P0 (E7.5, n=4; E8.5, n=5; E9.5, n=4), 0.5 mo (E8.5, n=5; E9.5, n=5), 2 mo (E9.5, n=5)). n representing independent animals. Scale bars, 50 μm. (h) Percentage of tdTomato+TRAP+ cells to total TRAP+ cells in the metaphysis (P0 (E8.5, n=5; E9.5, n=4), 0.5 mo (E8.5, n=5; E9.5, n=5), 2 mo (E8.5, n=4, E9.5, n=5), 6 mo (E9.5, n=4)). n representing independent animals. Error bars denote means ± s.d. Statistics source data are provided in Source Data Fig. 1.
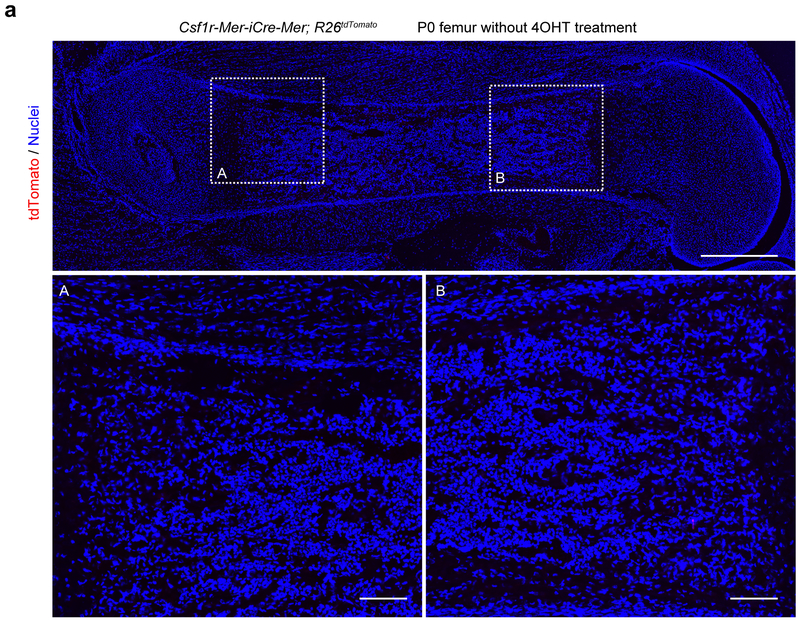
At postnatal day (P) 0 we detected a few tdTomato expressing cells in the femur of the mice labeled at E7.5 (Fig. 1b, c) and none were identified in 4OHT untreated mice (Extended Data Fig. 1a). In contrast, induction at E8.5 and E9.5 yielded tdTomato and V-type proton pump-3 (Vpp3)26 expressing multinucleated osteoclasts in P0 and 0.5-month-old femur (Fig. 1e, f). In mice labeled at E8.5, there were a few tdTomato+ cells in the diaphysis and none were identified in the metaphysis by two weeks of age (Fig. 1b, c, d). On the other hand, the number of tdTomato+ cells in the metaphysis and diaphysis of the mice labeled at E9.5 were diminished at two months of age and disappeared by 6 months of age (Fig. 1b, c). To verify that tdTomato+ multinucleated cells were osteoclasts, we counterstained the cells with tartrate-resistant acid phosphatase (TRAP) (Fig. 1g). More than 80% of TRAP+ cells expressed tdTomato in the femur of the mice labeled at E8.5, verifying Csf1r+ yolk-sac macrophage contributed to osteoclasts in the P0 femur (Fig. 1h). However, the percentage of tdTomato+TRAP+ osteoclasts labeled at E8.5 decreased with age and disappeared within two weeks of age in the metaphysis. Further, tdTomato+TRAP+ cells labeled at E9.5 also decreased over time and almost disappeared within six months of age (Fig. 1h). In addition to the osteoclast-specific marker expression of Vpp3 and TRAP, the multinuclear nature of these cells is consistent with the notion that tdTomato+TRAP+ cells are not circulating macrophages or monocytes.
Cx3cr1+ yolk-sac macrophages give rise to the osteoclasts that survive in adulthood
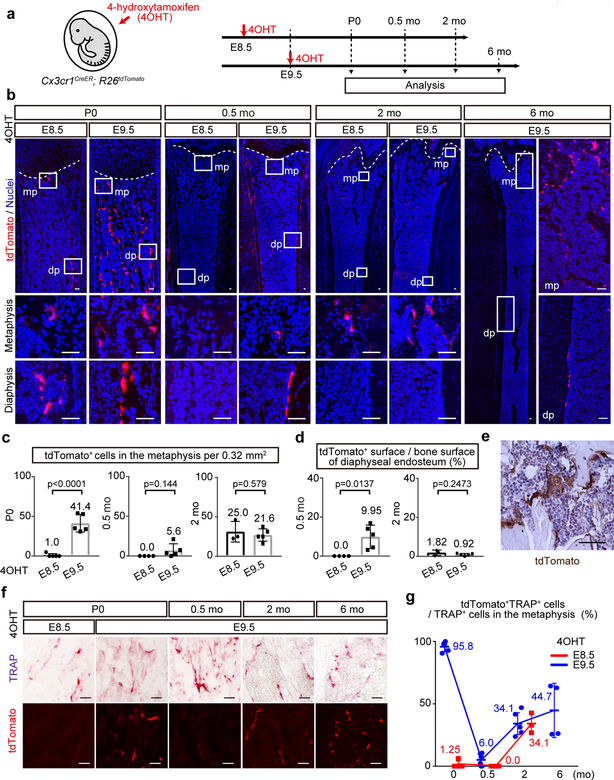
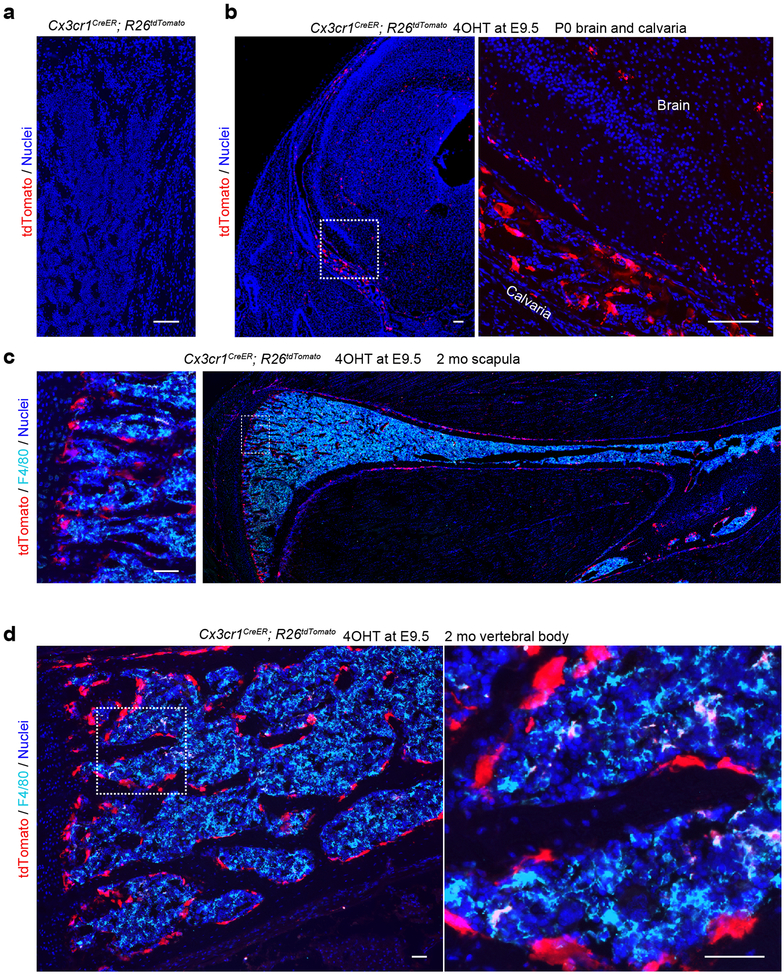
EMPs give rise to fractalkine receptor CX3CR1 expressing yolk-sac macrophages, also known as premacrophages21 at E8.5 and will then colonize the whole embryo starting at E9.527. We next generated Cx3cr1CreER; R26tdTomato mice in which 4OHT could pulse label Cx3cr1-expressing cells and their progenies28–31 (Fig. 2a). There was a limited contribution of tdTomato+ cells in the P0 femur labeled at E8.5 (Fig. 2b, c) and no tdTomato expression in 4OHT untreated mice (Extended Data Fig. 2a). However, induction at E9.5 produced abundant tdTomato+ multinucleated cells in both the metaphysis and diaphysis of P0 femur (Fig. 2b, c, e). By two weeks of age, the number of tdTomato+ cells was too sparse to detect in the metaphysis of mice induced at E8.5 or 9.5, but tdTomato+ cells were detected in the diaphysis with induction at E9.5 (Fig. 2b, c, d). Notably, more than 30% of TRAP+ osteoclasts expressed tdTomato in the femur at 2 months of age when mice were labeled with 4OHT at E8.5 or E9.5 (Fig. 2f, g). At 6 months of age, tdTomato+TRAP+ osteoclasts labeled at E9.5 survived and contributed to the remodeling of the adult femur. tdTomato+ cells were also detected in other skeletal elements such as neonatal calvaria, adult scapula and vertebral body, and they lacked expression of macrophage marker F4/80 (Extended Data Fig. 2b, c, d). Thus, Cx3cr1+ yolk-sac macrophages of EMP origin give rise not only to the neonatal osteoclasts but also provide long-lasting osteoclasts in adult bones.
Figure 2. Cx3cr1+ yolk-sac macrophages give rise to the osteoclasts that survive in adulthood.
(a) Schematic representation of the fate-mapping analysis of Cx3cr1-expressing cells and their progenies. E, embryonic day. P, postnatal day. mo, month-old. 4OHT, 4-hydroxytamoxifen. (b) Representative images of tdTomato expressing cells on the postnatal femur at P0 (E8.5, n=5; E9.5, n=5), 0.5 mo (E8.5, n=4; E9.5, n=5), 2 mo (E8.5, n=3; E9.5, n=5), and 6 mo (E9.5, n=4). n representing independent animals. mp, metaphysis. dp, diaphysis. Scale bars, 50 μm. (c) The number of tdTomato+ cells in the metaphysis per 0.32 mm2 at P0 (E8.5, n=5; E9.5, n=5), 0.5 mo (E8.5, n=4; E9.5, n=5), and 2 mo (E8.5, n=3; E9.5, n=5). n representing independent animals. Unpaired two-tailed t-test. Error bars denote means ± s.d. (d) Percentage of tdTomato+ surface area to the total bone surface area of the endosteum at 0.5 mo (E8.5, n=4; E9.5, n=5) and 2 mo (E8.5, n=3; E9.5, n=5). n representing independent animals. Unpaired two-tailed t-test. Error bars denote means ± s.d. (e) Representative image of immunostaining for tdTomato indicating the multinucleation of tdTomato+ cells from three independent experiments. Scale bar, 50 μm. (f) Representative images of tdTomato+ and TRAP+ cells on the postnatal femur at defined age and time point of 4OHT induction (E8.5; P0, n=5. E9.5; P0, n=5; 0.5 mo, n=5; 2 mo, n=5; 6 mo, n=4). n representing independent animals. Scale bars, 50 μm. (g) Percentage of tdTomato+TRAP+ cells to total TRAP+ cells in the metaphysis (E8.5; P0, n=5; 0.5 mo, n=4; 2 mo, n=3. E9.5; P0, n=5; 0.5 mo, n=5; 2 mo, n=5; 6 mo, n=4). n representing independent animals. Error bars denote means ± s.d. Statistics source data are provided in Source Data Fig. 2.
EMPs and HSCs give rise to the postnatal osteoclasts
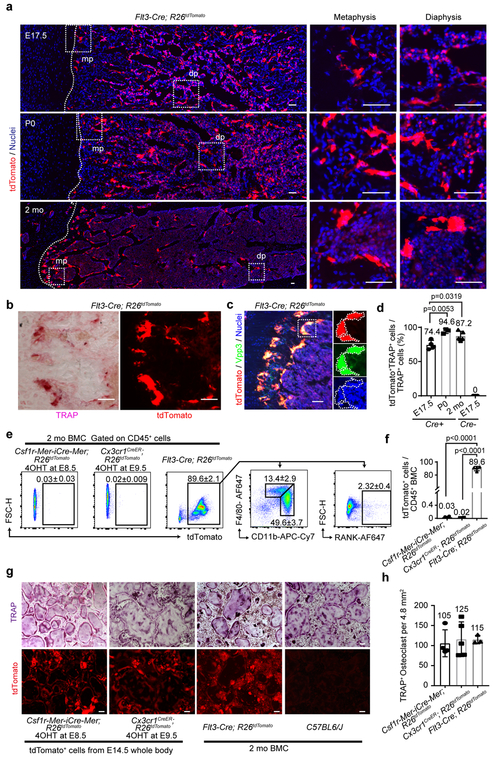
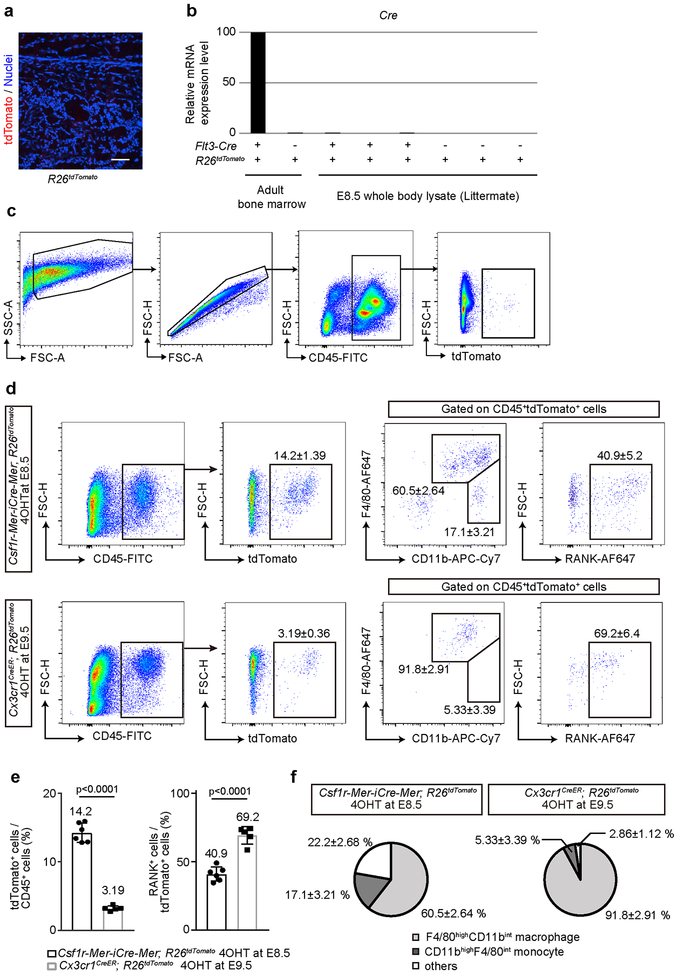
To examine the contribution of HSCs to the postnatal osteoclast, we generated Flt3-Cre; R26tdTomato mice and analyzed their femur at E17.5, P0 and, 2 months of age. They exhibited tdTomato+ cells in the femur at all time points (Fig. 3a). We confirmed negative tdTomato expression in E17.5 femur of Cre-negative littermate controls (Extended Data Fig. 3a) and negligible mRNA expression of Cre in E8.5 embryos compared to bone marrow cells from 2-month-old Flt3-Cre; R26tdTomato mice, indicating non-leakiness of Flt3-Cre mice (Extended Data Fig. 3b). In addition to the expression of TRAP and Vpp3, the multinuclear nature of these cells is consistent with tdTomato+TRAP+ cells being osteoclasts (Fig. 3b, c). The percentage of tdTomato+TRAP+ osteoclasts to total TRAP+ osteoclasts slightly increased during early bone development and reached to 94.6% in P0 and 87.2% in 2-month-old femur of Flt3-Cre; R26tdTomato mice (Fig. 3d). Since Flt3 is not expressed in yolk-sac macrophages of EMP origin19, 20, 32, but are expressed specifically in the HSC lineage, overlapping percentage of tdTomato+TRAP+ osteoclast in both fate-mapping experiments suggest cell-cell fusion between HSCs- and EMPs-derived precursors give rise to giant multinucleated osteoclasts.
Figure 3. EMPs and HSCs give rise to the postnatal osteoclast.
(a) Representative images of tdTomato expressing cells on the femur of Flt3-Cre; R26tdTomato mice at defined age (n=3 mice per group). E, embryonic day. P, postnatal day, mo, month-old. mp, metaphysis. dp, diaphysis. Scale bars, 50 μm. (b) Representative images of tdTomato+ and TRAP+ cells of 2 mo Flt3-Cre; R26tdTomato mice femur (n=3 mice). Scale bars, 50 μm. (c) Representative image of tdTomato expression and antibody staining with Vpp3. Nuclei staining with hoechst showing the multinucleation. Three independent experiments. Scale bar, 50 μm. (d) Quantification of the percentage of tdTomato+TRAP+ cells to total TRAP+ cells in the metaphysis of Flt3-Cre; R26tdTomato mice at E17.5 (n=4 mice), P0 (n=3 mice), and 2 mo (n=5 mice) of age. E17.5 R26tdTomato mice (n=3 mice) were used as Cre negative control. One-way ANOVA was used to compare among E17.5, P0, and 2 mo Flt3-Cre; R26tdTomato mice. Error bars denote means ± s.d. (e) Flow cytometry analysis of bone marrow cell (BMC) from 2 mo Csf1r-Mer-iCre-Mer; R26tdTomato and Cx3cr1CreER; R26tdTomato mice treated with 4OHT at E8.5 or E9.5 and Flt3-Cre; R26tdTomato mice (n=4 mice per group). (f) Quantification of percentage of tdTomato+ cells per CD45+ BMCs of 2 mo Csf1r-Mer-iCre-Mer; R26tdTomato, Cx3cr1CreER; R26tdTomato, and Flt3-Cre; R26tdTomato mice (n=4 mice per group). One-way ANOVA. Error bars denote means ± s.d. (g) In vitro osteoclast differentiation of tdTomato+ cells from E14.5 Csf1r-Mer-iCre-Mer; R26tdTomato mice labeled at E8.5 and Cx3cr1CreER; R26tdTomato mice labeled at E9.5 (representative image from three independent experiments). BMCs were isolated from 2 mo Flt3-Cre; R26tdTomato mice and C57BL6/J mice (representative image from two independent experiments) and differentiated into osteoclast. Upper panels showing TRAP staining and lower panels showing tdTomato expression. Scale bars, 100 μm. (h) The number of multinucleated TRAP+ cells per 4.8 mm2. Data were combined from two independent experiments (Csf1r-Mer-iCre-Mer; R26tdTomato, n=4 mice; Cx3cr1CreER; R26tdTomato, n=5 mice; Flt3-Cre; R26tdTomato, n=3 mice). TRAP-positive multinucleated cells with more than three nuclei were counted as osteoclasts. Error bars denote means ± s.d. Statistics source data are provided in Source Data Fig. 3.
Next, we examined osteoclast precursors in the postnatal bone marrow. Negligible tdTomato+ cells were identified by fluorescence-activated cell sorting (FACS) in the bone marrow cells (BMCs) from Csf1r-Mer-iCre-Mer; R26tdTomato and Cx3cr1CreER; R26tdTomato mice induced at E8.5 or 9.5, respectively (Fig. 3e, f, Extended Data 3c). In contrast, 89.6 % of CD45+ BMCs from Flt3-Cre; R26tdTomato mice expressed tdTomato and 49.6% of them were CD11bhighF4/80int monocyte rather than F4/80highCD11bint macrophages (Fig. 3e, f). Further, 2.32% of CD45+tdTomato+ BMCs from Flt3-Cre; R26tdTomato mice expressed Receptor activator of NF-κβ (Rank; encoded by the Tnfrsf11a gene), representing a possible source of HSC-derived osteoclast precursors.
We next investigated the differentiation capacity of EMP- and HSC-derived precursors to osteoclasts in vitro. First, we isolated tdTomato+ cells from single cell suspension of whole E14.5 embryos of Csf1r-Mer-iCre-Mer; R26tdTomato mice labeled at E8.5 and Cx3cr1CreER; R26tdTomato mice labeled at E9.5. CD45+ cells from E14.5 Csf1r-Mer-iCre-Mer; R26tdTomato mice expressed tdTomato at 14.2%, and 60.5% of these cells were F4/80highCD11bint macrophages and 40.9% expressed RANK (Extended Data Fig. 3d, e, f). CD45+ cell from Cx3cr1CreER; R26tdTomato mice labeled at E9.5 expressed tdTomato at 3.19% and a higher population of the cells were F4/80highCD11bint macrophage (91.8%) and RANK+ cells (69.2%). We next cultured tdTomato+ cells from E14.5 embryos of Csf1r-Mer-iCre-Mer; R26tdTomato mice (4OHT at E8.5) and Cx3cr1CreER; R26tdTomato mice (4OHT at E9.5) and differentiated them into osteoclasts under macrophage colony-stimulating factor (M-CSF) and soluble RANKL stimulation33. We also cultured BMCs from 2-month-old Flt3-Cre; R26tdTomato and C57BL/6J mice and differentiated them into osteoclasts. All of these types of cells were equally capable of differentiating into tdTomato+TRAP+ multinucleated osteoclasts in vitro (Fig. 3g, h).
EMP-derived osteoclast precursors arise independently from HSC lineage
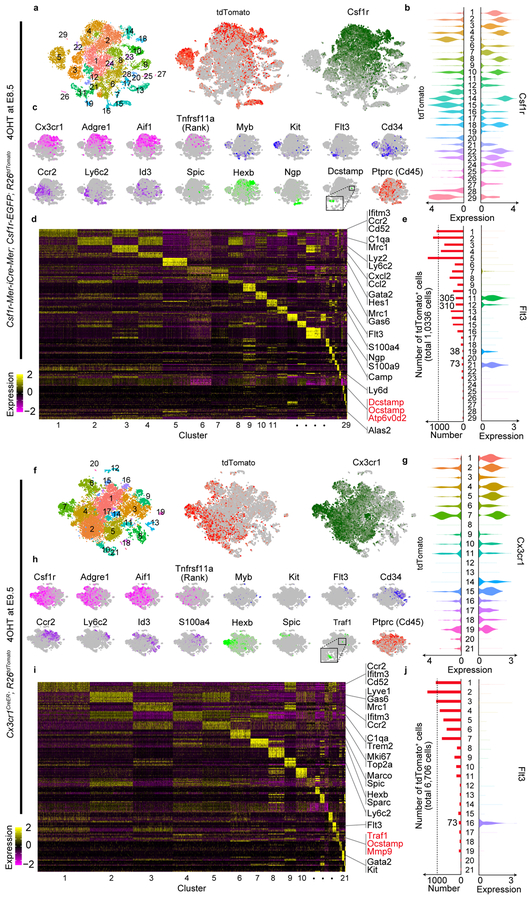
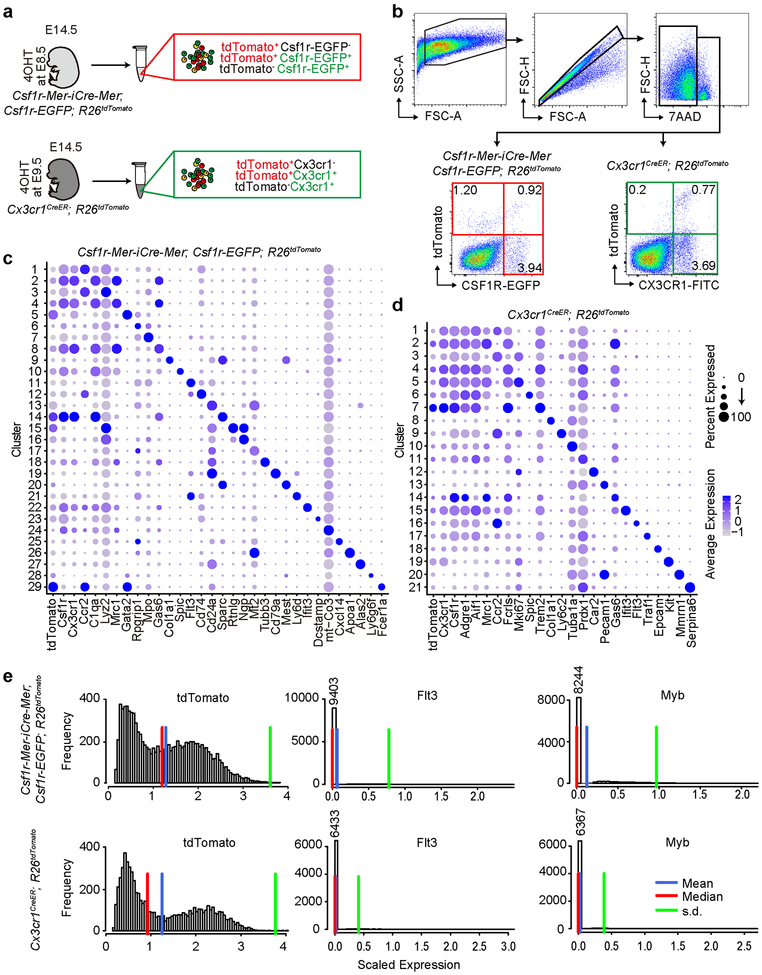
To evaluate the possible contribution of yolk-sac macrophage of EMP origin to the postnatal osteoclast pool, we performed single cell RNA-sequencing (scRNA-seq) on developing embryos. Single cell suspensions of whole embryos at E14.5 from Csf1r-Mer-iCre-Mer; Csf1r-EGFP; R26tdTomato mice labeled at E8.5 and Cx3cr1CreER; R26tdTomato mice labeled at E9.5 were investigated. Three cell populations, tdTomato+EGFP−, tdTomato+EGFP+, and tdTomato−EGFP+ were isolated from the whole embryo of Csf1r-Mer-iCre-Mer; Csf1r-EGFP; R26tdTomato mice. tdTomato+Cx3cr1−, tdTomato+Cx3cr1+, and tdTomato−Cx3cr1+ cells were isolated from Cx3cr1CreER; R26tdTomato mice (Extended Data Fig. 4a, b). We profiled over 35,000 single cells pooled from 4 embryos using two biological replicates for each genotype. Unsupervised clustering assigned the cells into distinct 29 and 21 subpopulations from Csf1r-Mer-iCre-Mer; Csf1r-EGFP; R26tdTomato and Cx3cr1CreER; R26tdTomato mice respectively (Fig. 4a, f), and the cell subpopulations were readily identified with known marker genes (Fig. 4b, c, d, g, h, i, Extended Data Fig. 4c, d)
Figure 4. EMP- and HSC-derived cells specify distinct subpopulations.
(a) t-distributed stochastic neighbor embedding (t-SNE) plot of 19,598 cells from Csf1r-Mer-iCre-Mer; Csf1r-EGFP; R26tdTomato mice (n=2 mice) identified 29 clusters. (b) Violin plots showing Csf1r and tdTomato expression levels of the cells from Csf1r-Mer-iCre-Mer; Csf1r-EGFP; R26tdTomato mice (n=2 mice). The number in the middle column show cluster identity and the number of cells in each cluster is provided in Statistical source data Fig. 4. (c) Normalized expression of indicated marker genes was visualized onto t-SNE plots of 19,598 cells from Csf1r-Mer-iCre-Mer; Csf1r-EGFP; R26tdTomato mice (n=2 mice). (d) Heatmap representing the top 10 significantly differentially expressed genes in each cluster. (e) The number of tdTomato+ cells in each cluster are shown with the expression level of Flt3. The number in the middle column show cluster identity and the number of cells and tdTomato+ cells in each cluster are provided in Statistical source data Fig. 4. (f) t-SNE plot of 16,169 cells from Cx3cr1CreER; R26tdTomato mice (n=2 mice) provided 21 clusters. (g) Violin plots showing Cx3cr1 and tdTomato expression levels of the cells from Cx3cr1CreER; R26tdTomato mice (n=2 mice). The number in the middle column show cluster identity and the number of cells in each cluster is provided in Statistical source data Fig. 4. (h) Normalized expression of indicated marker genes was visualized onto t-SNE plots of 16,169 cells from Cx3cr1CreER; R26tdTomato mice (n=2 mice). (i) Heatmap representing the top 10 significantly differentially expressed genes in each cluster. (j) The number of tdTomato+ cells in each cluster are shown with the expression level of Flt3. The number in the middle column show cluster identity and the number of cells and tdTomato+ cells in each cluster are provided in Statistical source data Fig. 4. Statistics source data are provided in Source Data Fig. 4.
tdTomatohighCsf1rhigh cells from Csf1r-Mer-iCre-Mer; Csf1r-EGFP; R26tdTomato mice, which are indicative of progenies of Csf1r+ yolk-sac macrophages, were mainly present in clusters 2, 4, 8, 10, 14, 18, 22, 23, and 29 (Fig. 4a, b). These cells expressed pan-macrophage markers, such as Adgre1 and Aif1 (Fig. 4c). tdTomatolowCsf1rhigh cells which are indicative of HSC-derived monocyte/macrophage were present in clusters 1, 3, 6, 7, and 24 (Fig. 4a, b). Genes, such as Ccr2 and Ly6c2, encoding monocyte makers, were expressed in these clusters (Fig. 4c). Cluster 10 was enriched with genes that were known as markers of Kupper cell and splenic red pulp macrophage, such as Spic and Id321. Although 4OHT induction at E8.5 labeled mainly yolk-sac macrophages, it also labeled other subpopulations of cells such as Ngp+Ly6g+ neutrophils (Cluster 15), Alas2+HbA2+ erythrocytes (Cluster 27), and Pecam1+Cdh5+ endothelial cells (Cluster 20) (Fig. 4c, Extended Data Fig. 4c). Importantly, cluster 23 was a Dcstamp+Ocstamp+Atp6v0d2+Ctsk+Mmp9+ osteoclast-specific population34–38. In cells from Cx3cr1CreER; R26tdTomato mice, tdTomatohighCx3cr1high cells were located in clusters 2, 4, 6, and 7, which represented yolk-sac-derived macrophage populations (Fig. 4f, g). They demonstrated higher expression levels of Mrc1, Lyve1, C1q1, Trem2, and Hexb. On the other hand, cluster 1 and 3 included Cx3cr1hightdTomatolow cells which expressed high levels of Ccr2 and Ifitm3 representing HSC-derived monocyte/macrophage (Fig. 4i).
To delineate the distribution of tdTomato+ fate-mapping cells to HSC lineage, we quantified the number of tdTomato+ cells in the Flt3+ clusters. Total 726 tdTomato+ cells (7.02%) from Csf1r-Mer-iCre-Mer; Csf1r-EGFP; R26tdTomato mice distributed to cluster 11, 12, 19, and 21 (Fig. 4e) and total 73 tdTomato+ cells (1.08%) from Cx3cr1CreER; R26tdTomato mice distributed to cluster 16 (Fig. 4j). Though tdTomato+ cells from both mice contributed to Flt3+ HSC lineage, the expression levels of Flt3 in tdTomato+ cells were negligible (Extended Data Fig. 4e). This data supports the notion that fate mapped EMP-derived tdTomato+ cells arose independently from Flt3+ HSC lineage.
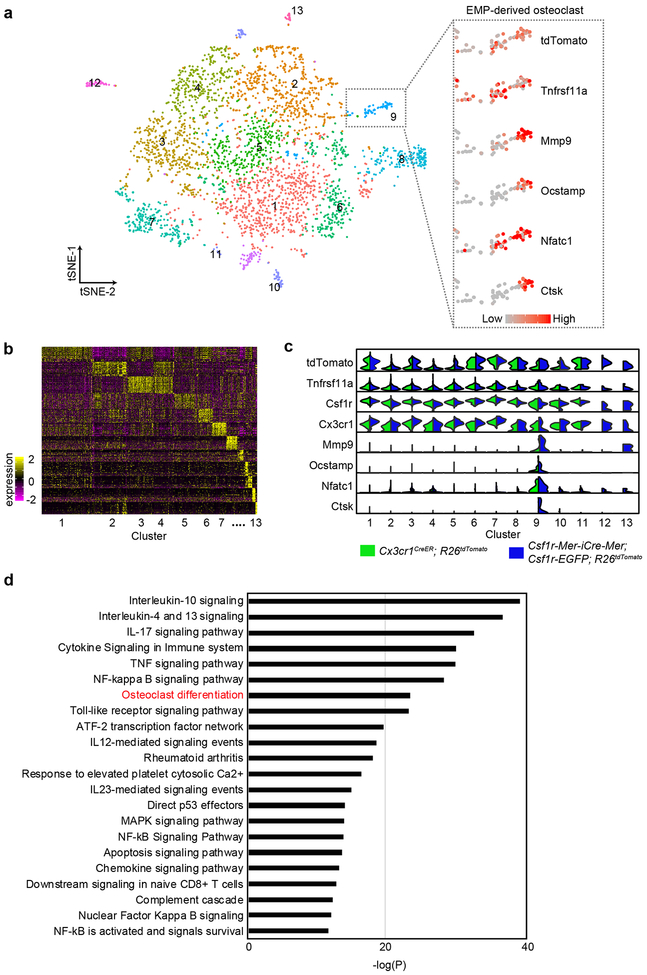
To characterize the EMP-derived osteoclast precursors, we next isolated tdTomato+Tnfrsf11a+Ptprc+ cells from the data of Csf1r-Mer-iCre-Mer; Csf1r-EGFP; R26tdTomato and Cx3cr1CreER; R26tdTomato mice, and combined them to visualize their expression profiles. Unsupervised clustering showed 13 distinct populations (Extended Data Fig. 5a, b). Cluster 9 was an osteoclast-specific cluster, containing cells highly expressing CtsK, Mmp9, Ocstamp, and Nfatc1 as well as tdTomato, Tnfrsf11a, and Csf1r representing EMP-derived mature osteoclast populations (Extended Data Fig. 5a, c, Supplementary Table 1). In addition, cells in cluster 6 expressed several genes related to osteoclast maturation and differentiation, such as activator protein-1 (AP-1) transcriptional factors (Junb/d and Fos)39, 40, C1q complement complex (C1qa/b/c)41, TNF signaling pathway genes (Tnf and Tnfsf9)42, Interleukin (IL)-1 mediated signaling pathway genes (Il-1α and β)43, and Fc gamma receptors (Fcgr3, and Fcgrt)44, 45 (Supplementary Table 2). Pathway analysis of significantly expressed genes in cluster 6 also included several promotive osteoclast differentiation pathways as well as suppressive cytokine pathways such as IL-4, 12, 13, and 10 signaling46, 47 (Extended Data Fig. 5d). Thus, cells belonging cluster 6 were likely the source of EMP-derived osteoclast precursors.
Cx3cr1+ yolk-sac macrophage descendants provide osteoclasts after bone injury
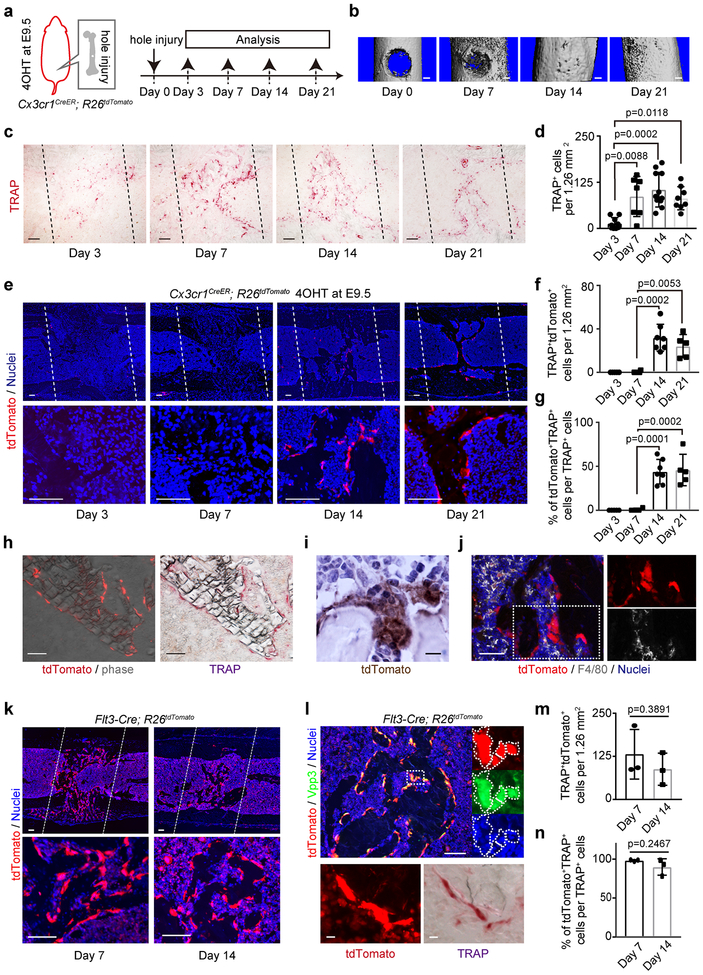
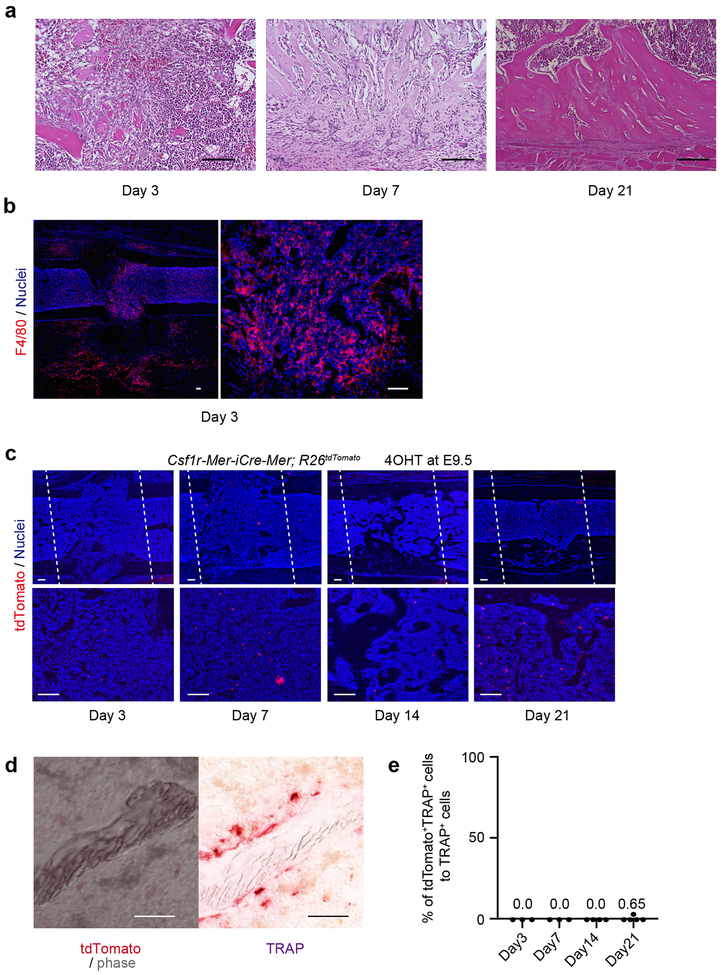
To examine the contribution of EMP-derived osteoclast precursors to adult bone remodeling after injury, 2-month-old Cx3cr1CreER; R26tdTomato mice induced with 4OHT at E9.5 were injured by generating a drill hole in the femur48 and were analyzed 3, 7, 14 and 21 days after injury (Fig. 5a). Three days after injury, F4/80+ macrophage and inflammatory cells infiltrated into the injury site (Extended Data Fig. 6a, b). Serial μCT and histological images revealed that the injury site filled with new bone within 2 weeks, which was remodeled at 21 days (Fig. 5b and Extended Data Fig. 6a). The number of TRAP+ osteoclasts increased at day 7, and their numbers peaked on day 14 (Fig. 5c, d). tdTomato+TRAP+ cells began to increase after day 7, with larger numbers at day 14 (Fig. 5e, f, h). About 35% of TRAP+ cells coexpressed tdTomato+ at day 14, indicating EMP-derived osteoclasts contributing to the bone remodeling after injury (Fig. 5g). The tdTomato+TRAP+ cells were multinucleated giant cells (Fig. 6i) but lacked expression of F4/80 (Fig. 5j), indicating that these cells were not macrophage/monocyte but osteoclasts.
Figure 5. Cx3cr1+ yolk-sac macrophage descendants provide osteoclasts after bone injury.
(a) Schematic representation of the experimental procedure. 4OHT, 4-hydroxytamoxifen. (b) μCT of the injury site during bone healing (n=3 mice per group). Scale bars, 0.2 mm. (c) TRAP staining around the injury site at day 3 (n=8), 7 (n=7), 14 (n=11), and 21 (n=8). n representing independent animals. Black dot lines represent the site of the bone injury. Scale bars, 100 μm. (d) Number of TRAP+ cells around the injury site per 1.26 mm2 at day 3 (n=8), 7 (n=7), 14 (n=11), and 21 (n=8). n representing independent animals. One-way ANOVA. Error bars denote means ± s.d. (e) tdTomato+ cells around the injury site at day 3 (n=5), 7 (n=4), 14 (n=7), and 21 (n=5). n representing independent animals. White dot lines represent the injury site. Scale bars, 100 μm. (f) Number of tdTomato+TRAP+ cells and (g) Percentage of tdTomato+TRAP+ cells per TRAP+ cells around the injury site per 1.26 mm2 at day 3 (n=5), 7 (n=4), 14 (n=7), and 21 (n=5). n representing independent animals. One-way ANOVA. Error bars denote means ± s.d. (h) tdTomato+ and TRAP+ cells around the injury site at day 21 (n=5 mice). Scale bars, 100 μm. (i) Multinucleated tdTomato+ cells around the injury site at day 14 (n=3 mice). Scale bar, 10 μm. (j) F4/80 and tdTomato expression around the injury site at day 14 (n=3 mice). Scale bar, 50 μm. (k) tdTomato+ cells of 2-month-old Flt3-Cre; R26tdTomato mice around the injury site. (n=3 mice per group). Lower panels showing magnified view. White dot lines represent the injury site. Scale bars, 100 μm. (l) TRAP staining, tdTomato expression and antibody staining with Vpp3 at day 14. Nuclei staining with hoechst showing the multinucleation (n=3 mice). Scale bar, upper; 100 μm. Lowers; 10 μm. (m) The number of tdTomato+TRAP+ cells and (n) percentage of tdTomato+TRAP+ cells per TRAP+ cells around the injury site per 1.26 mm2 (n=3 mice per group) of Flt3-Cre; R26tdTomato mice. Unpaired two-tailed t-test. Error bars denote means ± s.d. Statistics source data are provided in Source Data Fig. 5.
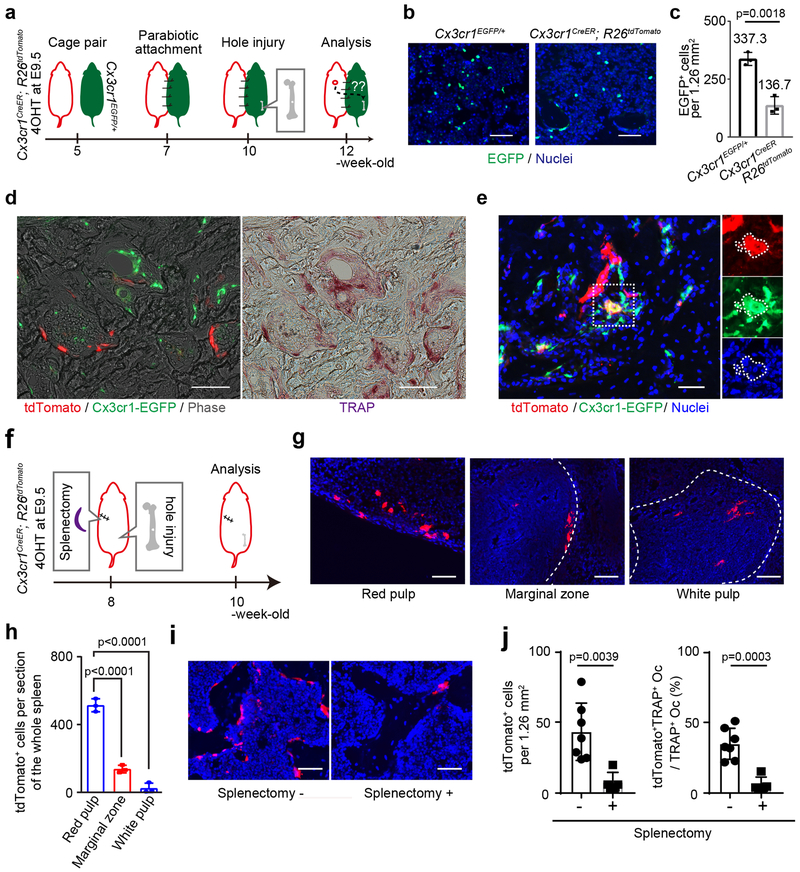
Figure 6. Cx3cr1+ yolk-sac macrophage descendants migrated into bone injury site through blood circulation.
(a) Schematic representation of the experimental procedure. 4OHT, 4-hydroxytamoxifen. (b) Representative images of EGFP expression of the BMCs 5 weeks after parabiotic combination between Cx3cr1EGFP/+ and Cx3cr1CreER; R26tdTomato mice induced with 4OHT at E9.5 (n= 3 mice per group). Scale bars, 50 μm. (c) The number of EGFP+ cells per 1.26 mm2 (n=3 mice per group). Unpaired two-tailed t-test. Error bars denote means ± s.d. (d) Representative images of tdTomato+ and EGFP+ cells around the injury site of Cx3cr1EGFP/+ mice 14 days after surgery. (n=4 independent parabiotic pairs). Left and middle panels showing tdTomato+ and EGFP+ cells. Right panel showing TRAP+ cells around the injury. Scale bars, 50 μm. (e) Representative images of tdTomato and EGFP expression around the injury site of Cx3cr1EGFP/+ mice at day 14 showing coexpression of tdTomato and EGFP. Nuclei staining with hoechst showing the multinucleation. Two of four independent parabiotic pairs showed coexpression of tdTomato and EGFP in injured Cx3cr1EGFP/+ mice. Scale bar, 50 μm. (f) Schematic representation of the experimental procedure. 4OHT, 4-hydroxytamoxifen. (g) Representative images of tdTomato expressing cells in the red pulp, marginal zone, and white pulp of the spleen of 2-month-old Cx3cr1CreER; R26tdTomato mice labeled at E9.5 (n=3 mice per group). White dot lines representing the boundary between the red and white pulps. Scale bars, 50 μm. (h) The number of tdTomato+ cells in the red pulp, marginal zone, and white pulp of the spleen (n=3 per group). One-way ANOVA. Error bars denote means ± s.d. (i) Representative images of tdTomato+ cells around the injury site 14 days after injury with (n=5 mice) or without splenectomy (n=7 mice). Scale bars, 50 μm. (j) Quantitative analysis of tdTomato+ and TRAP+ cells around the injury site 14 days after injury with (n=5 mice) or without splenectomy (n =7 mice). Unpaired two-tailed t-test. Error bars denote means ± s.d. Statistics source data are provided in Source Data Fig. 6.
We also analyzed 2-month-old Csf1r-Mer-iCre-Mer; R26tdTomato mice labeled at E9.5. We could detect a few tdTomato+ cells in the bone marrow (Extended Data Fig. 6c). However, the contribution of tdTomato+ cell to TRAP+ osteoclasts was negligible (Extended Data Fig. 6d, e).
Next, Flt3-Cre; R26tdTomato mice were analyzed 7 and 14 days after the drill hole injury (Fig. 5k). Fate mapping data showed that tdTomato+ multinucleated cells coexpressed TRAP and Vpp3, representing osteoclasts of HSC origin (Fig. 5l). HSC-derived osteoclasts had already migrated to the injury site at day 7 and provided tdTomato+TRAP+ osteoclasts around the injury site (Fig. 5m). The overlapping distribution of EMP-derived (Fig. 5g, 35.1%) and HSC-derived (Fig. 5n, 90.0%) tdTomato+TRAP+ osteoclast at day 14 provide a possibility of cell-cell fusion between both lineage cells.
Cx3cr1+ yolk-sac macrophage descendants can migrate to bone injury sites through blood circulation from a reservoir in the spleen
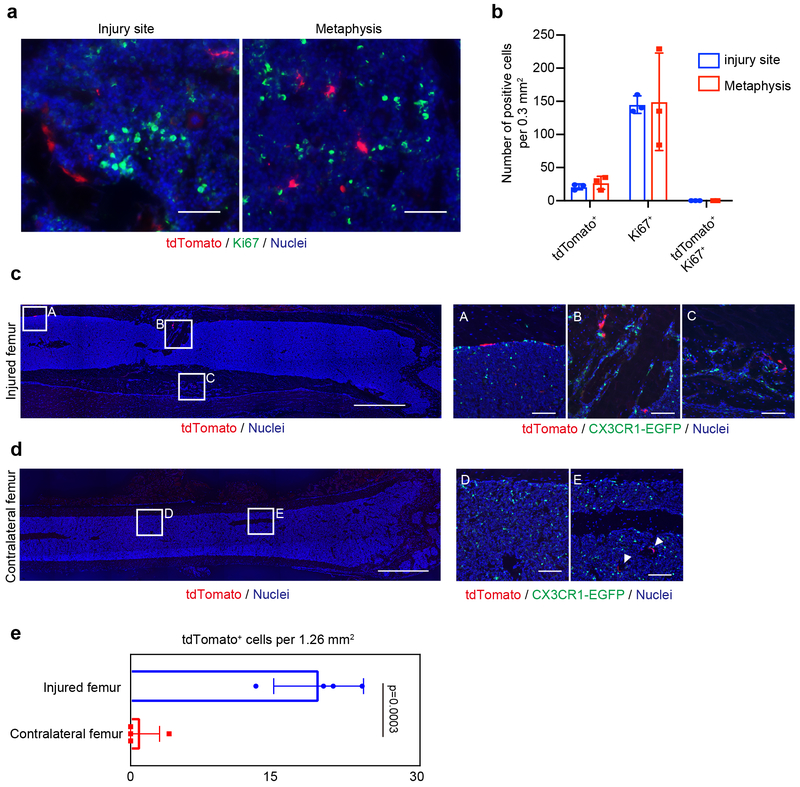
Cells from EMP-derived osteoclast precursors could migrate from proliferating cells adjacent to the bone injury or through a peripheral source in the circulation. Immunostaining for Ki67 showed low proliferation potential of tdTomato+ cells (Extended Data Fig. 7a, b), raising the possibility that these cells migrated through the circulation to the injury site from a distal source. To determine the source from which these cells arose, a parabiotic union49 was achieved between Cx3cr1EGFP/+ and Cx3cr1CreER; R26tdTomato mice labeled at E9.5. Three weeks after parabiosis, a bone injury was generated in Cx3cr1EGFP/+ mice and the injury site was analyzed 2 weeks after surgery (Fig. 6a). EGFP+ cells migrated into the Cx3cr1CreER; R26tdTomato mice were showing effective blood sharing between two mice (Fig. 6b, c). A population of tdTomato+ cells was observed at the bone injury site in Cx3cr1EGFP/+ mice and some of tdTomato+ cells coexpressed TRAP (Fig. 6d). We also found tdTomato- and EGFP-double-positive multinucleated cells at the injury site (Fig. 6e). This data supports our hypothesis that migrating EMP-derived tdTomato+ cells can fuse with local EGFP+ cells and give rise to one multinucleated osteoclast contributing bone remodeling after injury. The number of tdTomato+ cells in the contralateral femur was significantly lower than that of the injured femur (Extended Data Fig. 7c, d, e). Thus, Cx3cr1+ yolk-sac macrophage descendants were able to migrate through the bloodstream and differentiated into osteoclasts with possible fusion with local cells.
The spleen serves as a reservoir of osteoclast precursors in adult animals50. Therefore, we investigated if the spleen could be a space of EMP-derived cells that could provide osteoclasts at the site of a bone injury. We performed a splenectomy and damaged the bone using drill hole surgery in Cx3cr1CreER; R26tdTomato mice labeled at E9.5 (Fig. 6f). tdTomato+ cells in the spleen of Cx3cr1CreER; R26tdTomato mice mainly distributed in the red pulp (Fig. 6g, h), consistent with a previous report showing that macrophages in the red pulp partially originate from primitive yolk-sac51, 52. We found that the number of tdTomato+ cells and tdTomato+TRAP+ osteoclasts were substantially decreased in mice that underwent a splenectomy (Fig. 6i, j). These data provide a possibility that the spleen can be a pool of EMP-derived osteoclast precursors.
Discussion
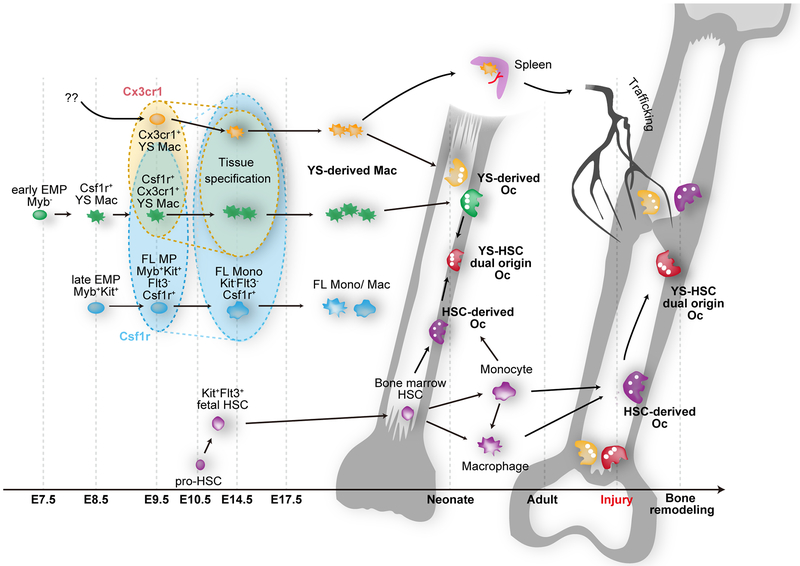
Here we investigated the origin of postnatal osteoclasts. We found that the majority of osteoclasts in neonatal bones are derived from yolk-sac macrophage of EMP origin. These cells likely participate in cell-cell fusion with HSC lineage precursors. We also found that Cx3cr1+ yolk-sac macrophage descendants uniquely give rise to long-lasting osteoclast precursors and provide osteoclasts in adult bone. Those EMP-derived precursors can migrate to the injury site via the bloodstream and can fuse with local precursors to create multinucleated giant osteoclasts contributing to bone remodeling after injury (Extended Data Fig. 8).
Jacome-Galarza et al. showed that osteoclasts of EMP origin are required for normal bone development and tooth eruption32. However, the contribution of these embryonic osteoclast precursors to postnatal bone development and bone remodeling remain unclear. Our data from fate mapping, scRNA-seq, and bone injury model suggest that progenies of Cx3cr1+ yolk-sac macrophage arise independently from the HSC lineage and can produce long-lasting osteoclast, whereas Csf1r+ precursors could not. One explanation for this finding is that a specific population of Cx3cr1+ cells at E9.5 provide the long-lasting osteoclasts. The other possibility may in part depend on the Cre recombination ability between Csf1r-Mer-iCre-Mer and Cx3cr1CreER mice.
In bone development, osteoclast precursors migrate in the mesenchyme surrounding the bone rudiments. They differentiate into TRAP+ cells and change into mature osteoclasts to curve the bone matrix and generate space for hematopoiesis53. EMP-derived osteoclasts play a crucial role in the production of the bone cavity and accelerate the transfer of HSCs into the bone cavity. EMP-derived osteoclasts decreased by 0.5 months of age when this function is completed. An additional population of EMP-derived macrophages could survive in the body and continuously provide osteoclast precursors later than 0.5 months old, representing long-lasting osteoclasts in adult mice.
We found the spleen can be a source of EMP-derived osteoclast precursors. However, the nature of their establishment in the spleen and the biological mechanisms of response to the bone injury are still unclear. Nakamichi et al. found that IL-34 signaling induced mobilization of osteoclast precursors from the spleen in osteopetrotic op/op mice50. Further, Sabatel et al. reported that lung interstitial macrophages arise from splenic reservoir monocytes through IL-10 signaling during allergic airway inflammation54. Clarification of the detailed network orchestrating the recruitment of EMP-derived osteoclasts is required.
In summary, we found that osteoclasts derive from EMPs and are involved in bone remodeling. Our recent findings provide a framework of osteoclast ontogeny and diversity of those precursor cells. Future study of the differences between osteoclasts from these populations will inform the optimal method to modulate osteoclast functions and increase the evidence that enhance our understanding that EMP-derived osteoclasts are a unique precursor population with a specific role in bone homeostasis.
Methods
Mouse strains
All animals were used according to the approved protocol by the Institutional Animal Care and Use Committee of Duke University. Csf1r-Mer-iCre-Mer (FVB-Tg(Csf1r-cre/Esr1*)1Jwp/J), Cx3cr1CreER (B6.129P2(C)-Cx3cr1tm2.1(cre/ERT2)Jung/J), R26tdTomato (B6.Cg-Gt(ROSA)26Sortm14(CAG-tdTomato)Hze/J), Csf1r-EGFP (C57BL/6-Tg(Csf1r-EGFP-NGFR/FKBP1A/TNFRSF6)2Bck/J), Cx3cr1EGFP (B6.129P-Cx3cr1tm1Litt/J), and C57BL/6J mice were purchased from Jackson Laboratory. Flt3-Cre mice have been previously described55 and kindly provided by Dr. K. Lavine (Washington University). All mice were bred under specific-pathogen-free conditions. Csf1r-Mer-iCre-Mer, Cx3cr1CreER, and Flt3-Cre mice were mated with R26tdTomato mice to generate either Csf1r-Mer-iCre-Mer; R26tdTomato, Cx3cr1CreER; R26tdTomato, or Flt3-Cre; R26tdTomato mice. In some experiments, Csf1r-Mer-iCre-Mer; R26tdTomato and Csf1r-EGFP mice were crossed to obtain Csf1r-Mer-iCre-Mer; Csf1r-EGFP; R26tdTomato mice. Csf1r-Mer-iCre-Mer mice were maintained in a mixed background of FVB and C57BL/6J. Genotyping PCR of each strain was performed according to the instructions provided by Jackson Laboratory. Embryonic development was defined based on the date of vaginal plug formation as embryonic day 0.5. To achieve Cre-recombination, 75 μg per g (bodyweight) of 4-hydroxytamoxifen (4OHT, Sigma Aldrich) dissolved in corn oil (Sigma Aldrich) was intraperitoneally injected into a pregnant female. 4OHT was supplemented with 37.5 μg per g (bodyweight) progesterone (Sigma Aldrich) to avoid fetal abortions.
Histological analysis
Samples were fixed in 4% paraformaldehyde (PFA)/phosphate-buffered saline (PBS) at 4 °C, followed by incubation in 30% sucrose in PBS (Sigma Aldrich) for overnight. Tissues were embedded in Tissue-tek O.C.T. compound (Sakura Finetek). Sections were prepared at 10 μm thickness with a Cryofilm type 3c(16UF) (SECTION-LAB) using a CM1950 cryomicrotome (Leica) according to the method described by Kawamoto56. Sections were stained with Hoechst 33342 (1:2000, Thermo Fisher Scientific) to visualize the nuclei. tdTomato and EGFP fluorescence were captured using Axio Imager Widefield Fluorescence Microscope (Zeiss) or BZ-9000 Biorevo microscope (Keyence). For immunostaining of F4/80, Vpp3, and Ki67, sections were blocked with 10% normal goat serum (VECTOR LABORATORIES) in PBS for 1 hour at room temperature. Then sections were incubated with rat anti-mouse F4/80 (1:200, Biorad), rabbit anti-ATP6V1B1 + ATP6V1B2 (1:200, Abcam), or rat anti-Ki67 (1:200, Thermo Fisher Scientific) antibody for overnight at 4 °C. Anti-rat Alexa Fluor 647 (1:2000, Thermo Fisher Scientific) and anti-rabbit Alexa Fluor 488 (1:2000, Thermo Fisher Scientific) were used as the secondary antibody. After nuclei staining with Hoechst 33342, sections were visualized using Axio Imager Widefield Fluorescence Microscope (Zeiss) or IX-83 (OLYMPUS).
For paraffin-embedded sections, samples were harvested, fixed in 4% PFA, processed, and embedded in paraffin. Sections were prepared at 5 μm thickness and subjected to hematoxylin and eosin staining after deparaffinization. To detect tdTomato expression, sections were incubated in citric acid-based antigen unmasking solution (VECTOR LABORATORIES) at 80°C for 15 minutes (min) to retrieve the antigen. Endogenous peroxidase was blocked by 3% H2O2/Methanol for 10 min. After blocking with 10% goat normal serum (VECTOR LABORATORIES), the sections were incubated with a rabbit anti-RFP antibody (1:500, Rockland) for 2 hours at room temperature. Immunodetection was performed using VECTASTAIN ABC rabbit IgG Kit and ImmPACT DAB peroxidase (HRP) Substrate (VECTOR LABORATORIES). Sections were then counterstained with hematoxylin and mounted.
Tartrate-resistant acid phosphatase (TRAP) staining
To visualize tdTomato+ and TRAP+ cells, frozen sections, described above as Kawamoto film methods, were used. First, tdTomato expression was captured by Axio Imager Widefield Fluorescence Microscope (Zeiss) without embedding. Then, sections were subjected to TRAP staining. TRAP staining solution containing Naphthol AS-MX phosphate (Sigma) and Fast Red Violet LB salt (Sigma), diluted in L-(+) Tartaric Acid (Sigma) incubation medium, were placed on the film and incubated at 37°C for 15 min. After washing the film, sections were embedded with SCMM-G1 (SECTION-LAB) and captured by Axio Imager Widefield Fluorescence Microscope (Zeiss). To merge the two types of images, Photoshop (Adobe) was used. Quantitative histological evaluations were then performed.
Preparation of cell suspensions, flow cytometry, and cell sorting
To obtain single-cell suspension from E14.5 embryos, pregnant females were euthanized by exposure to CO2. Embryos were collected from the uterus and washed with PBS. Each embryo was minced by a scalpel, and then digested with 1 mg ml−1 collagenase D (Roche), 100 U ml−1 DNase I (Sigma Aldrich) in 1% Bovine serum albumin (BSA, Sigma)/PBS for 20 min at 37 °C. The whole-body cell suspension was filtered by 70- and 30-μm cell strainer. To obtain the bone marrow cells (BMCs), 2-month-old mice tibia were used. Bilateral tibia were dissected, and the distal/proximal end of the tibia were removed. BMCs were then collected and mechanically dissociated to make a single cell suspension. BMCs were then filtered by 40-μm cell strainer.
Cell suspensions were centrifuged at 1200 rpm for 5 min and then treated with ACK lysis buffer (Thermo Fisher Scientific) for 3 min. After 5 min incubation with purified rat anti-mouse CD16/32 (mouse BD Fc block, BD Biosciences), antibody mixes were added and incubated for 30 min at 4 °C. All antibodies are listed in Supplementary Table 3. Flow cytometry was performed with a FACSCanto II flow cytometer (BD Biosciences). Data were analyzed by FlowJo 10 (Tree Star). For cell sorting, a DiVa cell sorter (BD Biosciences) was used, and the sorted cells were subjected to either scRNA-seq or primary osteoclast cultures.
scRNA library preparation and sequencing
Cell suspensions were loaded on the 10x Genomics Chromium Controller Single-Cell Instrument (10x Genomics) mixed with reverse transcription reagents along with gel beads and oil to generate single-cell gel bead in emulsions (GEMs). GEM-RT was performed in an Eppendorf Mastercycler Pro (Eppendorf): 53 °C for 45 min, 85 °C for 5 min; held at 4 °C. After RT, GEMs were broken and the single-strand cDNA was purified with DynaBeads MyOne Silane Beads (Thermo Fisher Scientific). cDNA was amplified using the Eppendorf Mastercycler Pro (Eppendorf): 98°C for 3 min; cycled 11–13×: 98 °C for 15s, 67 °C for 20 s, and 72 °C for 1 min; 72 °C for1 min; held at 4 °C. Amplified cDNA product was purified with the SPRIselect Reagent Kit (0.6 × SPRI) (Beckman Coulter). Indexed sequencing libraries were constructed using the reagents in the Chromium Single-Cell 3′ Library Kit, following these steps: (1) fragmentation, end repair and A-tailing; (2) SPRIselect cleanup; (3) adapter ligation; (4) post ligation cleanup with SPRIselect; (5) sample index PCR; (6) PostindexPCR cleanup. The barcoded sequencing libraries were quantified by quantitative PCR (KAPA Biosystems Library Quantification Kit for Illumina platforms). Sequencing libraries were transferred to the Duke University Center for Genomic and Computational Biology (GCB) and were loaded on a Novaseq 6000 (Illumina) for sequencing.
The primary analytical pipeline for the single cell analysis followed the recommended protocols from 10X Genomics. Briefly, we processed the raw FASTQ files using the most current version of the Cell Ranger software. The first steps of this program demultiplex the raw reads and align the reads to the appropriate reference transcriptome and gene expression matrices created for all single cells in each sample (http://support.10xgenomics.com/single-cell/software/pipelines/latest/what-is-cell-ranger). The secondary statistical analysis was performed using R statistical methodology, R package Seurat (http://satijalab.org/seurat/), which performs quality control and subsequent analyses on the gene expression matrices produced by CellRanger. In Seurat data was first normalized on the log scale after basic filtering for minimum gene and cell observance frequency cut-offs (http://satijalab.org/seurat/pbmc3k_tutorial.html). We then closely examined the data and performed further filtering based on a range of metrics in an attempt to identify and exclude possible multiplets. The additional removal of further technical artifacts, in order to reduce noise, was performed using regression methods. After quality control procedures were complete, we calculated principal components using the most variably expressed genes in our dataset. Significant principal components for downstream analyses were determined through methods mirroring those implemented by Macosko et al.57, and these principal components were carried forward for two main purposes: to perform cell clustering and to enhance visualization. Cells were grouped into an optimal number of clusters for de novo cell type discovery using Seurat’s FindClusters function, graph-based clustering approach with visualization of cells through the use of t-distributed stochastic neighbor embedding (t-SNE), which reduced the information captured in the selected significant principal components to two dimensions58. Differential expression of relevant cell marker genes was visualized on the t-SNE plot to reveal specific individual cell types.
Quantitative PCR
Total RNA was extracted from whole embryos at E8.5 and bone marrow cells at 2-month-old using Trizol reagent (ambient) and Direct-zol RNA Microprep (Genesee Scientific). cDNA was then reverse-transcribed by using Maxima H Minus cDNA Synthesis Master Mix (Invitrogen, M1662). Real-time PCR was then performed with the following primers using the Powerup SYBR green reagent (Invitrogen, A25777) on a QuantStudio 3 real-time PCR system (Thermo Fisher Scientific). Gene expression was calculated and expressed relative to a housekeeping gene (Hprt) using the ΔΔCT-method. Cre-forward primer; ACGTTCACCGGCATCAACGT, Cre-reverse; CTGCATTACCGGTCGATGCA, Hprt-forward; GGCTATAAGTTCTTTGCTGACCTG, and Hprt-reverse; AACTTTTATGTCCCCCGTTGA.
Pathway analysis
Pathway analysis was performed using ToppGene Suite (https://toppgene.cchmc.org/help/publications.jsp). We used a total of 163 differentially expressed genes in cluster 6 of tdTomato+Tnfrsf11a+Ptprc+ cells to identify the significantly upregulated pathways based on functional annotations and protein interactions network.
In vitro Osteoclast differentiation
tdTomato+ cells were isolated from whole-body cell suspension of E14.5 Csf1r-Mer-iCre-Mer; R26tdTomato and Cx3cr1CreER; R26tdTomato embryo and tdTomato+ cells were seeded in a 48-well plate (20,000 cells per well). Cells were cultured in α-MEM (Thermo Fisher Scientific) with 20% FBS (Sigma) containing 50 ng/ml M-CSF (R&D Systems) for two days. Cells were then cultured in the presence of 50 ng/ml soluble RANKL (Peprotech) and 50 ng/ml M-CSF for three days.
BMSc from Flt3-Cre; R26tdTomato and C57BL/6J mice were isolated and seeded in 10 cm dish. Nonadherent bone marrow cells were seeded (20, 000 cells per well of 48-well plate) and cultured in α-MEM with 20% FBS containing 50 ng/ml M-CSF for two days. Cells were then cultured in the presence of 50 ng/ml soluble RANKL and 50 ng/ml M-CSF for three days.
Cells were fixed with 4% PFA/PBS and subjected to TRAP staining. Multinucleated (>3 nuclei) TRAP+ cells were counted as osteoclast and captured by BZ-9000 Biorevo microscope (Keyence).
Drill hole surgery
Two-month-old mice received the drill hole surgery under the anesthesia. A 22G needle (0.7 mm diameter, BD) was used to create a hole on the right femur approximately 6 mm above the knee joint without a skin incision. Mice were sacrificed at 3, 7, 14, and 21 days after surgery and subjected to μCT (VivaCT 80, Scanco Medical) and histological analysis.
Parabiosis surgery
Two mice were habituated in the same cage to ensure harmonious cohabitation. After the anesthesia, a longitudinal skin incision was performed from elbow to knee joint. After a suturing at the olecranon, muscle and subcutaneous tissue of the two mice were connected by continuous sutures. A skin suture was then performed in the area from the elbow to knee joint. Mice were monitored daily to observe for signs of pain and distress such as shaking, lethargy, chewing of the tail, arched back, and lack of grooming. After a total three weeks combination, a mouse received a drill hole surgery on the right femur under the anesthesia. Two weeks after the drill hole surgery, mice were sacrificed and subjected to histological analysis.
Splenectomy surgery
After the anesthesia, the abdominal cavity was exposed through a left lateral incision extending around 1cm. Splenic vessels were collapsed with cautery, then the spleen was removed with the scissors. The abdominal musculature and the skin were closed with suture.
Statistical analysis and reproducibility
Data are shown as averages and standard deviations with individual values per sample. Statistical analysis was performed with either Prism (GraphPad) or Statcel3 (OMS) using unpaired two-tailed t-test and ANOVA followed by the Tukey-Kramer post-hoc test. Significance was considered at P<0.05. All statistical analysis performed in this manuscript and their respective parameters are shown in the Figure legends and Statistical source data Fig. 1–6 and Statistical source data Extended data Fig. 3, 5, 6, and 7.
The number (n) of biological pepeats has been indicated in each figure legend. All representative data are shown from independently repeated experiments or independents animals with similar results.
Data availability
Single cell RNA sequencing data that support the findings of this study have been deposited in the Gene Expression Omnibus (GEO) under accession code GSE125088. Source data have been provided as Statistical source data Fig. 1–6 and Statistical source data Extended data Fig. 3, 5, 6, and 7. All other data supporting the findings of this study are available from the corresponding author on reasonable request.
Extended Data
Extended Data Fig. 1.
Non-leakiness of Csf1r-Mer-iCre-Mer mice. (a) Representative image of the postnatal day (P) 0 femur of Csf1r-Mer-iCre-Mer; R26tdTomato mice without 4 hydroxytamoxifen (4OHT) induction (n=3 mice). Scale bars, upper panel; 500 μm. Lower panels; 100 μm.
Extended Data Fig. 2.
Cx3cr1+ yolk-sac macrophage descendant in several skeletal elements. (a) Representative image of the postnatal day (P) 3 femur of Cx3cr1CreER; R26tdTomato mice without 4 hydroxytamoxifen (4OHT) induction (n=3 mice). Scale bar, 100 μm. (b) Representative images of tdTomato+ cells in neonatal brain and calvaria of Cx3cr1CreER; R26tdTomato mice treated with 4OHT at E9.5 (n=3 mice). Scale bars, 50 μm. (c) Representative image of tdTomato and F4/80 expression in the scapula of 2-month-old (mo) Cx3cr1CreER; R26tdTomato mice labeled at E9.5 (n=3 mice). Scale bar, 50 μm. (d) Representative image of tdTomato and F4/80 expression in the vertebral body of 2 mo Cx3cr1CreER; R26tdTomato mice labeled at E9.5 (n=3 mice). Scale bars, 50 μm.
Extended Data Fig. 3.
Characterization of HSC- and EMP- derived cells. (a) Representative image of the femur of embryonic day (E) 17.5 R26tdTomato mice (Cre-negative littermate control of Flt3-Cre; R26tdTomato mice, n = 3 mice). Scale bar, 100 μm. (b) Relative mRNA expression levels of Cre were analyzed by quantitative PCR. RNA was isolated from adult bone marrow cells (BMCs) and E8.5 whole body. Flt3-Cre; R26tdTomato mice and their littermate Cre-negative control were used. (c) Gating strategy of CD45+tdTomato+ BMCs. (d) Flow cytometry analysis of tdTomato+ cells from whole-body cell suspension of E14.5 Csf1r-Mer-iCre-Mer; R26tdTomato mice labeled at E8.5 (n = 6 embryos) and Cx3cr1CreER; R26tdTomato mice labeled at E9.5 (n = 5 embryos). 4OHT, 4-hydroxytamoxifen. (e) Quantitative visualization of percentage of tdTomato+ and RANK+ cells from whole-body cell suspension of E14.5 Csf1r-Mer-iCre-Mer; R26tdTomato mice labeled at E8.5 (n = 6 embryos) and Cx3cr1CreER; R26tdTomato mice labeled at E9.5 (n = 5 embryos). Unpaired two-tailed t-test. Error bars denote means ± s.d. (f) Percentage of F4/80highCD11bint macrophage and CD11bhighF4/80int monocyte isolated from E14.5 whole body lysate of Csf1r-Mer-iCre-Mer; R26tdTomato mice labeled at E8.5 (n = 6 embryos) and Cx3cr1CreER; R26tdTomato mice labeled at E9.5 (n = 5 embryos). Statistics source data are provided in Source Data Extended Data Fig. 3.
Extended Data Fig. 4.
Single cell RNA-sequencing analysis of E14.5 embryo. (a) Schematic representation of sample preparation for the single cell RNA-sequencing. 4OHT, 4-hydroxytamoxifen. (b) Cell sorting strategy for the single cell RNA-sequencing. tdTomato+EGFP-, tdTomato+EGFP+, and tdTomato-EGFP+ (red box) were isolated from whole-body cell suspension of Csf1r-Mer-iCre-Mer; Csf1r-EGFP; R26tdTomato mice labeled at E8.5. tdTomato+CX3CR1-, tdTomato+CX3CR1+, and tdTomato-CX3CR1+ cell populations (green box) were also isolated from E14.5 Cx3cr1CreER; R26tdTomato mice labeled at E9.5. Two biological replicates of each genotype. (c) Dot plot showing expression of the selected marker gene in each cluster of Csf1r-Mer-iCre-Mer; Csf1r-EGFP; R26tdTomato mice. The size of the dot encodes the percentage expression, and its color encodes the average expression level. (d) Dot plot showing expression of the selected marker gene in each cluster of Cx3cr1CreER; R26tdTomato mice. (e) Scaled expression level and frequency (the number of cells) of tdTomato, Myb, and Flt3 were visualized. tdTomato+ cells from Csf1r-Mer-iCre-Mer; Csf1r-EGFP; R26tdTomato (n=10,336 cells) and Cx3cr1CreER; R26tdTomato (n=6,706 cells) mice were evaluated.
Extended Data Fig. 5.
Single cell RNA sequencing identified EMP-derived osteoclast and their precursor populations. (a) t-SNE plot of tdTomato+Tnfrsf11a+Ptprc+ cells (n=3,368 cells) from Csf1r-Mer-iCre-Mer; Csf1r-EGFP; R26tdTomato and Cx3cr1CreER; R26tdTomato mice identifying 13 clusters. The right gray rectangle representing the normalized expression of indicated marker genes visualized onto t-SNE plots. Cells in cluster 9 expressed osteoclast-specific marker genes. EMP, erythromyeloid progenitor. (b) Heatmap representing the top 10 significantly differentially expressed genes in each cluster. (c) Violin plots showing mRNA expression levels of selected marker genes. Green color showing the expression levels of the cells from Cx3cr1CreER; R26tdTomato mice. Blue color showing the expression levels of the cells from Csf1r-Mer-iCre-Mer; Csf1r-EGFP; R26tdTomato mice. The number shows cluster identity, and the number of cells in each cluster is provided in Statistical source data Extended Data Fig 5. (d) Selected pathways significantly enriched in the cells belonging cluster 6 (n=274 cells). Hypergeometric probability mass function was used. Statistics source data are provided in Source Data Extended Data Fig. 5.
Extended Data Fig. 6.
The healing process of the bone injury. (a) Representative images of the bone injury site during the healing process. 2-month-old C57BL/6J mice received drill hole injury and were analyzed (n=3 mice per group). Hematoxylin and Eosin staining showing inflammatory cells (day 3), newly synthesized bone (day 7), and regenerated bone tissue (day 21). Scale bars, 100 μm. (b) Immunohistochemical analysis for F4/80 expression. Representative images showing F4/80+ macrophages around the injury site at day 3 (n=3 mice). Scale bars, 100 μm. (c) Representative images of tdTomato+ cells around the injury site. 2-month-old Csf1r-Mer-iCre-Mer; R26tdTomato mice induced with 4OHT at E9.5 received drill hole injury and were analyzed at day 3 (n=3), 7 (n=3), 14 (n=4), and 21 (n=5). n representing independent animals. White dot lines represent the injury site. 4OHT, 4-hydroxytamoxifen. Scale bars, 100 μm. (d) Representative visualization of tdTomato+ and TRAP+ cells showing less contribution of tdTomato+ cells to the bone remodeling at day 14 (n=4 mice). Scale bars, 50 μm. (e) Percentage of tdTomato+TRAP+ to TRAP+ cells around the injury site of Csf1r-Mer-iCre-Mer; R26tdTomato mice at day 3 (n=3), 7 (n=3), 14 (n=4), and 21 (n=5). n representing independent animals. Statistics source data are provided in Source Data Extended Data Fig. 6.
Extended Data Fig. 7.
Migration of EMP-derived osteoclast precursors through the blood circulation. (a) Immunohistochemical analysis for Ki67 expression. Representative images showing Ki67+ and tdTomato+ cells around the injury site and adjacent metaphysis at day 14 (n=3 mice per group). Scale bars, 50 μm. (b) The number of single positive cells of Ki67 and tdTomato and double-positive cells per 0.3 mm2 were quantified (n=3 mice per group). Error bars denote means ± s.d. (c) Representative images of the injured femur of Cx3cr1EGFP/+ mice after the parabiotic union. tdTomato+ cells migrated through the blood circulation at the site of a bone injury. Scale bars, 1 mm. Right panels showing enlarged images (n=4 independent parabiotic pairs). Scale bars, 100 μm. (d) Representative images of uninjured side femur of Cx3cr1EGFP/+ mice. Scale bars, 1 mm. Right panels showing enlarged images (n = 4 independent parabiotic pairs). White triangles indicating tdTomato+ cells. Scale bars, 100 μm. (e) The number of tdTomato+ cells around the injury site and contralateral side of the femur. tdTomato+ cells per 1.26 mm2 were counted and visualized by bar chart (n = 4 mice per group). Unpaired two-tailed t-test. Error bars denote means ± s.d. Statistics source data are provided in Source Data Extended Data Fig. 7.
Extended Data Fig. 8.
Schematic representation showing the differential origin of osteoclast precursors and their differentiation. Myb-independent early erythromyeloid progenitors (EMPs) appear around E7–7.5 in the yolk-sac and differentiate into Csf1r+ yolk-sac macrophage (YS Mac) at E8.5 without passing through monocyte intermediates. YS Mac differentiates into CX3C chemokine receptor 1 (CX3CR1) positive premacrophage (pMac), resulting in a significant source of yolk-sac-derived macrophages. Late EMPs emerge in the yolk-sac at E8.5 and migrate to the fetal liver to produce Myb-expressing fetal liver (FL) myeloid progenitors (MP), resulting in FL monocyte (FL Mono). Hematopoietic stem cell precursors (pro-HSCs) emerge at E10.5. Pro-HSCs migrate to the fetal liver around E12 and turns to fetal HSCs, which later shift to the bone marrow. Bone marrow HSCs eventually can establish the circulating monocyte-derived macrophages. YS-derived macrophages differentiate into osteoclast (YS-derived Oc) in the neonatal bone with possible cell-cell fusion with HSC-derived Oc precursors. Cx3cr1+ yolk-sac macrophage descendants in the spleen can provide long-lasting Oc that contribute to the postnatal bone remodeling after injury via the bloodstream.
Supplementary Material
List of differentially expressed genes in cluster 9 of tdTomato+Tnfrsf11a+Ptprc+ cells (total 94 cells) compared to all remaining cells. Non-parameteric Wilcoxon rank sum test was used.
List of differentially expressed genes in cluster 6 of tdTomato+Tnfrsf11a+Ptprc+ cells (total 274 cells) compared to all remaining cells. Non-parameteric Wilcoxon rank sum test was used.
Antibodies for fluorescence-activated cell sorting
Acknowledgments
We thank Anthony J. Mirando, Shintaro Ide, Emily Hocke and Karen Abramson for assistance and helpful discussions. We thank Duke Molecular Physiology Institute Molecular Genomics Core for generation and analysis of 10x Genomics scRNA-seq libraries. We thank Tomoatsu Kimura for reading the manuscript and helpful discussion. We also thank Gurpreet S. Baht for the instruction of the parabiosis surgery. This research was supported by a grant from the National Institute on Aging (NIA) of the National Institutes of Health (NIH) R01 AG049745 and NIH R01 AI088100. The content is solely the responsibility of the authors and does not necessarily represent the official views of the NIH.
Footnotes
Competing financial interests
The authors declare no competing financial interests.
References
- 1.Frost HM, Vilanueva AR, Jett S & Eyring E Tetracycline-based analysis of bone remodelling in osteopetrosis. Clinical orthopaedics and related research 65, 203–217 (1969). [PubMed] [Google Scholar]
- 2.Chan CKF et al. Identification of the Human Skeletal Stem Cell. Cell 175, 43–56 e21 (2018). [DOI] [PMC free article] [PubMed] [Google Scholar]
- 3.Debnath S et al. Discovery of a periosteal stem cell mediating intramembranous bone formation. Nature 562, 133–139 (2018). [DOI] [PMC free article] [PubMed] [Google Scholar]
- 4.Yue R, Zhou Bo O. Shimada, Issei S, Zhao Z & Morrison Sean J. Leptin Receptor Promotes Adipogenesis and Reduces Osteogenesis by Regulating Mesenchymal Stromal Cells in Adult Bone Marrow. Cell Stem Cell 18, 782–796 (2016). [DOI] [PubMed] [Google Scholar]
- 5.Udagawa N et al. Origin of osteoclasts: mature monocytes and macrophages are capable of differentiating into osteoclasts under a suitable microenvironment prepared by bone marrow-derived stromal cells. Proceedings of the National Academy of Sciences of the United States of America 87, 7260–7264 (1990). [DOI] [PMC free article] [PubMed] [Google Scholar]
- 6.Takahashi N et al. Postmitotic osteoclast precursors are mononuclear cells which express macrophage-associated phenotypes. Developmental biology 163, 212–221 (1994). [DOI] [PubMed] [Google Scholar]
- 7.Lacey DL et al. Osteoprotegerin ligand is a cytokine that regulates osteoclast differentiation and activation. Cell 93, 165–176 (1998). [DOI] [PubMed] [Google Scholar]
- 8.Yasuda H et al. Osteoclast differentiation factor is a ligand for osteoprotegerin/osteoclastogenesis-inhibitory factor and is identical to TRANCE/RANKL. Proceedings of the National Academy of Sciences of the United States of America 95, 3597–3602 (1998). [DOI] [PMC free article] [PubMed] [Google Scholar]
- 9.Jee WS & Nolan PD ORIGIN OF OSTEOCLASTS FROM THE FUSION OF PHAGOCYTES. Nature 200, 225–226 (1963). [DOI] [PubMed] [Google Scholar]
- 10.Horton MA, Pringle JA & Chambers TJ When is it an osteoclast? Journal of clinical pathology 38, 596–597 (1985). [DOI] [PMC free article] [PubMed] [Google Scholar]
- 11.Italiani P & Boraschi D Development and Functional Differentiation of Tissue-Resident Versus Monocyte-Derived Macrophages in Inflammatory Reactions. Results and problems in cell differentiation 62, 23–43 (2017). [DOI] [PubMed] [Google Scholar]
- 12.van de Laar L et al. Yolk Sac Macrophages, Fetal Liver, and Adult Monocytes Can Colonize an Empty Niche and Develop into Functional Tissue-Resident Macrophages. Immunity 44, 755–768 (2016). [DOI] [PubMed] [Google Scholar]
- 13.Moore MA & Metcalf D Ontogeny of the haemopoietic system: yolk sac origin of in vivo and in vitro colony forming cells in the developing mouse embryo. British journal of haematology 18, 279–296 (1970). [DOI] [PubMed] [Google Scholar]
- 14.Hoeffel G & Ginhoux F Fetal monocytes and the origins of tissue-resident macrophages. Cellular immunology 330, 5–15 (2018). [DOI] [PubMed] [Google Scholar]
- 15.Lee CZW, Kozaki T & Ginhoux F Studying tissue macrophages in vitro: are iPSC-derived cells the answer? Nature reviews. Immunology 18, 716–725 (2018). [DOI] [PubMed] [Google Scholar]
- 16.Palis J, Robertson S, Kennedy M, Wall C & Keller G Development of erythroid and myeloid progenitors in the yolk sac and embryo proper of the mouse. Development 126, 5073–5084 (1999). [DOI] [PubMed] [Google Scholar]
- 17.Ginhoux F & Guilliams M Tissue-Resident Macrophage Ontogeny and Homeostasis. Immunity 44, 439–449 (2016). [DOI] [PubMed] [Google Scholar]
- 18.Ginhoux F et al. Fate mapping analysis reveals that adult microglia derive from primitive macrophages. Science 330, 841–845 (2010). [DOI] [PMC free article] [PubMed] [Google Scholar]
- 19.Gomez Perdiguero E et al. Tissue-resident macrophages originate from yolk-sac-derived erythro-myeloid progenitors. Nature 518, 547–551 (2015). [DOI] [PMC free article] [PubMed] [Google Scholar]
- 20.Schulz C et al. A Lineage of Myeloid Cells Independent of Myb and Hematopoietic Stem Cells. Science 336, 86 (2012). [DOI] [PubMed] [Google Scholar]
- 21.Mass E et al. Specification of tissue-resident macrophages during organogenesis. Science 353 (2016). [DOI] [PMC free article] [PubMed] [Google Scholar]
- 22.Hoeffel G et al. C-Myb(+) erythro-myeloid progenitor-derived fetal monocytes give rise to adult tissue-resident macrophages. Immunity 42, 665–678 (2015). [DOI] [PMC free article] [PubMed] [Google Scholar]
- 23.Perdiguero EG & Geissmann F The development and maintenance of resident macrophages. Nature immunology 17, 2–8 (2016). [DOI] [PMC free article] [PubMed] [Google Scholar]
- 24.Plein A, Fantin A, Denti L, Pollard JW & Ruhrberg C Erythro-myeloid progenitors contribute endothelial cells to blood vessels. Nature 562, 223–228 (2018). [DOI] [PMC free article] [PubMed] [Google Scholar]
- 25.Wilson CH et al. The kinetics of ER fusion protein activation in vivo. Oncogene 33, 4877–4880 (2014). [DOI] [PMC free article] [PubMed] [Google Scholar]
- 26.Romeo SG et al. Endothelial proteolytic activity and interaction with non-resorbing osteoclasts mediate bone elongation. Nature cell biology 21, 430–441 (2019). [DOI] [PubMed] [Google Scholar]
- 27.Stremmel C et al. Yolk sac macrophage progenitors traffic to the embryo during defined stages of development. Nature communications 9, 75 (2018). [DOI] [PMC free article] [PubMed] [Google Scholar]
- 28.Goldmann T et al. Origin, fate and dynamics of macrophages at central nervous system interfaces. Nature immunology 17, 797–805 (2016). [DOI] [PMC free article] [PubMed] [Google Scholar]
- 29.Mossadegh-Keller N et al. Developmental origin and maintenance of distinct testicular macrophage populations. The Journal of experimental medicine 214, 2829 (2017). [DOI] [PMC free article] [PubMed] [Google Scholar]
- 30.Molawi K et al. Progressive replacement of embryo-derived cardiac macrophages with age. The Journal of experimental medicine 211, 2151–2158 (2014). [DOI] [PMC free article] [PubMed] [Google Scholar]
- 31.Hagemeyer N et al. Transcriptome-based profiling of yolk sac-derived macrophages reveals a role for Irf8 in macrophage maturation. The EMBO journal 35, 1730–1744 (2016). [DOI] [PMC free article] [PubMed] [Google Scholar]
- 32.Jacome-Galarza CE et al. Developmental origin, functional maintenance and genetic rescue of osteoclasts. Nature 568, 541–545 (2019). [DOI] [PMC free article] [PubMed] [Google Scholar]
- 33.Takayanagi H et al. Induction and activation of the transcription factor NFATc1 (NFAT2) integrate RANKL signaling in terminal differentiation of osteoclasts. Developmental cell 3, 889–901 (2002). [DOI] [PubMed] [Google Scholar]
- 34.Yagi M et al. DC-STAMP is essential for cell-cell fusion in osteoclasts and foreign body giant cells. The Journal of experimental medicine 202, 345–351 (2005). [DOI] [PMC free article] [PubMed] [Google Scholar]
- 35.Yang M et al. Osteoclast stimulatory transmembrane protein (OC-STAMP), a novel protein induced by RANKL that promotes osteoclast differentiation. J Cell Physiol 215, 497–505 (2008). [DOI] [PMC free article] [PubMed] [Google Scholar]
- 36.Miyamoto H et al. Osteoclast stimulatory transmembrane protein and dendritic cell-specific transmembrane protein cooperatively modulate cell-cell fusion to form osteoclasts and foreign body giant cells. Journal of bone and mineral research : the official journal of the American Society for Bone and Mineral Research 27, 1289–1297 (2012). [DOI] [PubMed] [Google Scholar]
- 37.Wu H, Xu G & Li YP Atp6v0d2 is an essential component of the osteoclast-specific proton pump that mediates extracellular acidification in bone resorption. Journal of bone and mineral research : the official journal of the American Society for Bone and Mineral Research 24, 871–885 (2009). [DOI] [PMC free article] [PubMed] [Google Scholar]
- 38.Saftig P et al. Impaired osteoclastic bone resorption leads to osteopetrosis in cathepsin-K-deficient mice. Proceedings of the National Academy of Sciences of the United States of America 95, 13453–13458 (1998). [DOI] [PMC free article] [PubMed] [Google Scholar]
- 39.Grigoriadis AE et al. c-Fos: a key regulator of osteoclast-macrophage lineage determination and bone remodeling. Science 266, 443–448 (1994). [DOI] [PubMed] [Google Scholar]
- 40.Ikeda F et al. Critical roles of c-Jun signaling in regulation of NFAT family and RANKL-regulated osteoclast differentiation. The Journal of clinical investigation 114, 475–484 (2004). [DOI] [PMC free article] [PubMed] [Google Scholar]
- 41.Teo BH, Bobryshev YV, Teh BK, Wong SH & Lu J Complement C1q production by osteoclasts and its regulation of osteoclast development. The Biochemical journal 447, 229–237 (2012). [DOI] [PubMed] [Google Scholar]
- 42.Kobayashi K et al. Tumor necrosis factor alpha stimulates osteoclast differentiation by a mechanism independent of the ODF/RANKL-RANK interaction. The Journal of experimental medicine 191, 275–286 (2000). [DOI] [PMC free article] [PubMed] [Google Scholar]
- 43.Kim JH et al. The mechanism of osteoclast differentiation induced by IL-1. Journal of immunology (Baltimore, Md. : 1950) 183, 1862–1870 (2009). [DOI] [PubMed] [Google Scholar]
- 44.Pierce AM & Lindskog S Evidence for capping of Fc gamma receptors on osteoclasts. Calcified tissue international 39, 109–116 (1986). [DOI] [PubMed] [Google Scholar]
- 45.Seeling M et al. Inflammatory monocytes and Fcγ receptor IV on osteoclasts are critical for bone destruction during inflammatory arthritis in mice. Proceedings of the National Academy of Sciences 110, 10729 (2013). [DOI] [PMC free article] [PubMed] [Google Scholar]
- 46.Hong MH, Williams H, Jin CH & Pike JW The inhibitory effect of interleukin-10 on mouse osteoclast formation involves novel tyrosine-phosphorylated proteins. Journal of bone and mineral research : the official journal of the American Society for Bone and Mineral Research 15, 911–918 (2000). [DOI] [PubMed] [Google Scholar]
- 47.Bendixen AC et al. IL-4 inhibits osteoclast formation through a direct action on osteoclast precursors via peroxisome proliferator-activated receptor γ1. Proceedings of the National Academy of Sciences 98, 2443 (2001). [DOI] [PMC free article] [PubMed] [Google Scholar]
- 48.He YX et al. Impaired bone healing pattern in mice with ovariectomy-induced osteoporosis: A drill-hole defect model. Bone 48, 1388–1400 (2011). [DOI] [PubMed] [Google Scholar]
- 49.Conboy IM et al. Rejuvenation of aged progenitor cells by exposure to a young systemic environment. Nature 433, 760–764 (2005). [DOI] [PubMed] [Google Scholar]
- 50.Nakamichi Y et al. Spleen serves as a reservoir of osteoclast precursors through vitamin D-induced IL-34 expression in osteopetrotic op/op mice. Proceedings of the National Academy of Sciences of the United States of America 109, 10006–10011 (2012). [DOI] [PMC free article] [PubMed] [Google Scholar]
- 51.N AG & Castrillo A Origin and specialization of splenic macrophages. Cellular immunology 330, 151–158 (2018). [DOI] [PubMed] [Google Scholar]
- 52.Kurotaki D, Uede T & Tamura T Functions and development of red pulp macrophages. Microbiology and immunology 59, 55–62 (2015). [DOI] [PubMed] [Google Scholar]
- 53.Blavier L & Delaisse JM Matrix metalloproteinases are obligatory for the migration of preosteoclasts to the developing marrow cavity of primitive long bones. Journal of cell science 108 ( Pt 12), 3649–3659 (1995). [DOI] [PubMed] [Google Scholar]
- 54.Sabatel C et al. Exposure to Bacterial CpG DNA Protects from Airway Allergic Inflammation by Expanding Regulatory Lung Interstitial Macrophages. Immunity 46, 457–473 (2017). [DOI] [PubMed] [Google Scholar]
- 55.Epelman S et al. Embryonic and adult-derived resident cardiac macrophages are maintained through distinct mechanisms at steady state and during inflammation. Immunity 40, 91–104 (2014). [DOI] [PMC free article] [PubMed] [Google Scholar]
- 56.Kawamoto T Use of a new adhesive film for the preparation of multi-purpose fresh-frozen sections from hard tissues, whole-animals, insects and plants. Archives of histology and cytology 66, 123–143 (2003). [DOI] [PubMed] [Google Scholar]
- 57.Macosko EZ et al. Highly Parallel Genome-wide Expression Profiling of Individual Cells Using Nanoliter Droplets. Cell 161, 1202–1214 (2015). [DOI] [PMC free article] [PubMed] [Google Scholar]
- 58.van der Maaten L & Hinton G Visualizing Data using t-SNE. J. Mach. Learn. Res 9, 2579–2605 (2008). [Google Scholar]
Associated Data
This section collects any data citations, data availability statements, or supplementary materials included in this article.
Supplementary Materials
List of differentially expressed genes in cluster 9 of tdTomato+Tnfrsf11a+Ptprc+ cells (total 94 cells) compared to all remaining cells. Non-parameteric Wilcoxon rank sum test was used.
List of differentially expressed genes in cluster 6 of tdTomato+Tnfrsf11a+Ptprc+ cells (total 274 cells) compared to all remaining cells. Non-parameteric Wilcoxon rank sum test was used.
Antibodies for fluorescence-activated cell sorting
Data Availability Statement
Single cell RNA sequencing data that support the findings of this study have been deposited in the Gene Expression Omnibus (GEO) under accession code GSE125088. Source data have been provided as Statistical source data Fig. 1–6 and Statistical source data Extended data Fig. 3, 5, 6, and 7. All other data supporting the findings of this study are available from the corresponding author on reasonable request.


