

Abstract
BACKGROUND:
Activated forms of Ras are enhanced in both breast cancer as well as the cell lines with EGFR and HER2 expression. Therefore, H-Ras could be activated in breast tumours in the absence of direct mutational activation of Ras itself and could contribute to 20-50% of the cases. Expression inhibition, signal transduction interruption from H-Ras to the nucleus could become a promising therapeutic target.
AIM:
The aim of this study was to investigate the clinical and morphological criteria of locally advanced breast cancer and the expression of H-Ras oncoprotein in patients who have been subjected to different regimens of farnesyltransferase inhibitor.
METHODS:
H-Ras status was assessed by immunohistochemistry (IHC).
RESULTS:
An association between the expressions of H-Ras and Her2/neu (p = 0.001) as well as the tumour proliferation index Ki-67 (p = 0.001) in patients with breast cancer was established. Analysis of the relationship between H-Ras expression showed a relatively strong association with progression-free survival both before the treatment (V = 0.47; p = 0.001) and after the treatment (V = 0.45; p = 0.001). These results may indicate the clinical applicability of H-Ras as a prognostic factor or serve as a therapeutic target for breast cancer treatment.
CONCLUSION:
These results could indicate the potential clinical application of H-Ras as a prognostic factor or a therapeutic target for breast cancer treatment.
Keywords: Breast cancer, H-Ras, Immunohistochemistry, Prognostic, Biomarker
Introduction
High heterogeneity of breast cancer highlights molecular nature of malignant cells as a fundamentally important aspect, which is connected to the biological behaviour of the tumour and characterises their growth rate, ability to invade and metastasise and influences disease prognosis [1], [2].
It has been proven that mutations and certain genes’ rearrangements lead to the activation of signalling system both at the level of growth factors and their receptors, as well as on the downstream level of signal transmission along the protein cascade into the cell nucleus. As a result, activation of the signaling system on the downstream level occurs regardless of the involvement of the ligand and the receptor [3].
Mutational activation of RAS genes contributes to the formation of malignant processes in more than 30% of cases, which makes them one of the most frequent oncogenic mutations [4]. Three isoforms – KRAS, HRAS and NRAS, are among the most studied genes of the RAS family. Mutations in KRAS oncogenes occupy the highest percentage of occurrence in colorectal cancer patients, making up to 21,6% of cases, while NRAS makes up to 8.0% and HRAS is the least frequent making up to 3.3% of cases [5]. Spandidos D.A. showed for the first time that malignant breast tumours have an increased expression of HRAS oncogene compared to the corresponding samples of the normal tissue [6]. Further research identified an association between the high expression of p21 Ras oncogene in breast cancer and the aggressive course of the disease [7]. In another study, comparative analysis of HRAS oncogene expression of breast cancer and stomach cancer with regular clinical and pathological parameters was conducted, which revealed that high expression of p21 Ras oncogene in breast cancer patients is often associated with the tumour aggressiveness [8], [9], [10].
Although Ras rarely mutates in case of breast cancer, Ras is activated by various upstream regulators, including the epidermal growth factor receptors family, in particular, ErbB1 and ErbB2 [11].
Previous studies have shown that c-Ha-Ras protein expression could be used as a prognostic marker for the breast cancer progression as well as patients’ stratification based on the expression status and risk of development of metastasis for choosing preoperative chemotherapy courses [12].
Blocking Ras signalling and H-Ras inhibition in breast cancer is quite promising. Considerable efforts have been made to develop pharmacological agents that block the function of Ras. One of them is a development of effector signalling inhibitors-Raf-MEK-ERK and PI3K-AKT-mTOR pathways inhibitors in particular, which have Ras mutations. The second step is to inhibit the association of the Ras membrane alternative prenylation, whereby they are modified by the addition of another isoprenoid lipid, geranylgeraniol. Geranylgeranylated Ras-proteins remain functional and get transformed in the presence of farnesyltransferase inhibitors. Therefore, farnesyltransferase inhibitors have demonstrated anti-tumor activity in breast cancer [13], [14], [15], [16], [17].
Another mechanism by which Ras could be activated in breast cancer is associated with decreased expression of RasGAP regulatory protein. Mutations in the NF1 gene in neurofibromatosis contribute to the decreased formation of RasGAP neurofibromin. Hence women with this pathology have a higher risk of breast cancer development [18], [19].
A relatively recently discovered mechanism of increased H-Ras expression in breast cancer showed that the expression of miRNA let-7 – a negative regulator of the expression of H-Ras protein, is reduced in cancer stem cells and clinical samples. Studies have also shown that restoration of the expression of let-7 reduces the expression of H-Ras, cells proliferation and metastatic spread [20]. Thus, understanding the mechanisms of action on signalling pathways contributes to the detection of novel therapeutic targets for breast cancer treatment. We suggest that H-Ras could become a target for farnesyltransferase inhibitor, as well as in combination with other immunohistochemical factors, will contribute to the breast tumour progression.
This study aimed to investigate the clinical and morphological criteria for locally advanced breast cancer and H-Ras oncoprotein expression in patients who were subjected to the different treatment regimens with farnesyltransferase inhibitors.
Material and Methods
The present study was conducted after ethical approval from the Institutional Ethics Committee (17/9/10/KSMU/IEC/2017). In the present study morphological samples of patients with histologically verified stage II or III of the disease, T2N1-2M0, T3N0-2M0 served as inclusion criteria for the study. A group of 100 female patients with locally advanced breast cancer were recruited from June 2012 to February 2014. Their age ranged from 29 to 78 years, averaged at 59 ± years. The clinical staging was determined by the International TNM classification system (7th edition). The study was approved by the Ethics Committee of Karaganda Medical University (Karaganda, Kazakhstan).
Immunohistochemical determination of H-Ras oncoprotein expression was done on archival histological material samples of patients with breast cancer before and after the treatment. For immunohistochemical studies histological paraffin slices up to 5 μm thick were prepared, followed by dewaxing, then the slices were dehydrated and washed in sodium citrate buffer (PBS, sc-294091, Santa Cruz). Immunohistochemical staining of prepared slices was done using the avidin-biotin system of antigen detection ImmunoCruz® ABC Kit (sc-516216) by the manufacturer instructions. To visualise the positive reaction 3,3-diaminobenzidine tetrachloride (DAB, sc-24982) was used as a chromogen.
Mouse monoclonal anti-IgG1 antibodies to H-Ras protein (sc-29, Santa Cruz) of murine, rat and human origin characterised by the positive reaction in the cytoplasm of the tumour cells were used in this study. Primary antibodies against H-Ras were substituted with a buffer (PBS) or non-immune anti-IgG1 as a negative control. Two independent researchers were involved in the expression assessment. Positive staining on the tumour cells membrane and cytoplasm was considered as a positive test. The percentage of positively stained cells and the intensity of staining were evaluated. Percent of positively stained cells: < 10%-0; 10-50%-1; 51-80-2%; > 81%-3. The intensity of the staining: no reaction-0 points, weak reaction-1 point; moderate reaction-2 points, pronounced reaction – 3 points. IRS rating scale: 0-2 points – negative reaction; 3-4 points – weak reaction; 6-8 points – moderate reaction; 9-12 points – pronounced reaction.
Statistical analysis. The corresponding data are presented as a mean ± standard deviation (N = 3); confidence interval was calculated using Wald’s methods. The analysis of the significance of relationships between the qualitative variables was performed using Pearson’s chi-square criteria. Kramer’s correlation analysis was used to assess the relationship between two qualitative variables. To assess the relationship between the two quantitative variables, Spearman’s correlation method was performed. Statistical analysis was carried out using Statistica 10. P < 0.05 was considered to be an indicator of statistical significance.
Results
All 100 patients were females with the mean age of ± 59 years. The average follow-up period was 12 months. The majority (68%) of patients had stage II of the disease. In 65% of cases, regional metastatic spread in one axillary lymph node was detected, 9%-in two lymph nodes, 4%-in three.
H-Ras expression was evaluated in 200 tumour tissue samples before and after the neoadjuvant therapy for breast cancer. Immunohistochemical staining of H-Ras was performed (Figure 1). The immunohistochemical reaction was described as no reaction, a weak reaction and an intense reaction. According to the classification criteria, positive H-Ras expression was identified in 45 tumours (45%) before the treatment and in 35 tumours (35%) after the treatment.
Figure 1.
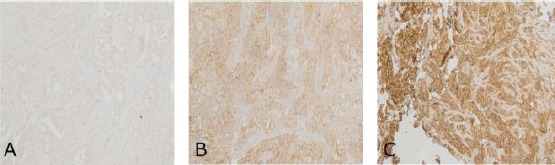
Immunohistochemical staining for the expression of H-Ras in human breast tissues of locally advanced cancer. The intensity of staining was described as A) no reaction; B) a weak reaction and C) an intense reaction (x 200 magnification)
Analysis of the relationship between the H-Ras expression before and after the treatment with clinical and pathological variables is summarised in Table 1.
Table 1.
Relationship between the H-Ras expression and clinical and morphological criteria of 100 breast cancer patients (p = 0.05)
| Features | N | H-Ras expression before the treatment p level | χ2. p level | H-Ras expression after the treatment | χ2. p level | ||
|---|---|---|---|---|---|---|---|
| Negative (n = 55) [CI, %] | Positive (n = 45) [CI. %] | Negative (n = 65) [CI. %] | Positive (n = 35) [CI, %] | ||||
| Age | |||||||
| ≤ 50 | 29 | 16 [37.54; 71.60] | 13 [28.40; 62.46] | 2.87; 0.41 | 18 [43.95; 77.36] | 11 [22.64; 56.05] | 2.71 0.25 |
| > 50 | 71 | 39 [43.40; 65.95] | 32 [34.05; 56.60] | 4.19 0.37 | 47 [54.59; 76.15] | 24 [23.85; 45.41] | 5.05 0.16 |
| Depth of tumour invasion | |||||||
| T2 | 65 | 34 [40.38;63.98] | 31 [36.03; 59.62] | 41 [50.90; 73.79] | 24 [26.21; 49.10] | ||
| T3 | 17 | 7 [21.56;64.05] | 10 [35.95; 78.44] | 8.06 0.62 | 10 [35.95; 78.44] | 7 [21.56; 64.05] | 5.12 0.69 |
| T4 | 18 | 13 [48.80;87.83] | 5 [12.17; 51.20] | 14 [54.25; 91.53] | 4 [8.47; 45.75] | ||
| Regional metastatic spread | |||||||
| N0 | 16 | 8 [28.00;72.00] | 8 [28.00; 72.00] | 8 [28.00; 72.00] | 8 [28.00; 72.00] | ||
| N1 | 66 | 34 [39.71;63.15] | 32 [36.85; 60.29] | 2.08 0.83 | 43 [53.08; 75.55] | 23 [24.45; 46.92] | 4.74 0.19 |
| N2 | 11 | 9 [51.15;96.01] | 2 [3.99;48.85] | 8 [42.89; 90.80] | 3 [9.20; 57.11] | ||
| N3 | 7 | 4 [24.98;84.25] | 3 [15.75; 75.02] | 6 [46.65; 99.47] | 1 [0.53; 53.35] | ||
| Estrogen receptors | |||||||
| Negative | 52 | 26 [36.89;63.11] | 26 [36.89; 63.11] | 10.80 0.05 | 30 [44.18; 70.14] | 22 [29.86; 55.82] | 5.31 0.14 |
| Positive | 48 | 32 [52.49;78.38] | 16 [21.62; 47;51] | 35 [58.89; 83.54] | 13 [16.46; 41.11] | ||
| Progesterone receptors | |||||||
| Negative | 64 | 30 [35.17;58.93] | 34 [41.07; 64.83] | 5.17 0.39 | 40 [50.23; 73.35] | 24 [26.65; 49.77] | 1.38 0.70 |
| Positive | 36 | 25 [53.03;82.11] | 11 [17.89; 56.97] | 25 [53.03;82.11] | 11 [17.89; 56.97] | ||
| Her-2\neu status | |||||||
| Negative | 54 | 49 [79.67;96.40] | 5 [3.60; 20.33] | 61.68 0.001 | 51 [84.30; 96.68] | 3 [1.32; 15.70] | 51.42 0.001 |
| Positive | 46 | 6 [5.74; 26.04] | 40 [73.96; 94.26] | 14 [19.00; 44.89] | 32 [55.11; 81.00] | ||
| Ki-67 proliferation index | |||||||
| < 15 | 34 | 1 [0.78; 16.22] | 33 [83.78;99.78] | 265.81 0.001 | 1 [0.78; 16.22] | 33 [0.78; 16.22] | 155.04 0.004 |
| ≥ 15 | 66 | 11 [9.39; 27.61] | 45 [56.17; 78.19] | 21 [21.81; 43.83] | 35 [41.16; 64.57] | ||
| Therapy | |||||||
| Arglabin | 31 | 14 [29.15;62.24] | 17 [37.76;70.85] | 20 [46.88; 78.95] | 11 [21.05; 53.12] | ||
| AC | 38 | 23 [44.69;74.43] | 15 [25.57; 55.31] | 11.96 0.28 | 23 [44.69; 74.43] | 15 [25.57; 55.31] | 7.86 0.44 |
| AC + Arglabin | 31 | 18 [40.74;73.61] | 13 [26.39; 59.26] | 22 [53.25; 84.06] | 9 [15.94; 46.75] | ||
AC– treatment regimen adriablastin + cyclophosphan.
As a result of the performed comparative analysis, a statistically significant difference between HRAS and clinical and pathological features such as Her-2/neu (p = 0.001), Ki-67 proliferating index (p = 0.001) of the patients with a verified breast cancer diagnosis were found.
A study of the efficacy of the therapy showed a strong relationship between the sum of the diameters of the tumour according to the RECIST 1.1 and percentage reduction of the tumour size (r = 0.87; p < 0.05) (Figure 2).
Figure 2.
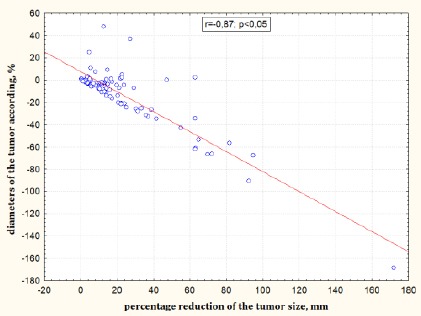
Relationship between the sum of the diameters of the tumour according to the RECIST 1.1 and percentage reduction of the tumour size
According to the results of the association analysis of the expression ability of H-Ras oncoprotein with clinicopathological factors in breast cancer, a strong correlation with the expression of Her-2/neu was determined, where Kramer’s correlation coefficient of V = 0.78 (p = 0.001) before the treatment and V = 0.67 (p = 0.001) after the treatment. In addition, the strong correlation with the proliferative activity index Ki-67 and H-Ras before the treatment with V = 0.57 (p = 0.001) and relatively-strong correlation with H-Ras after the treatment with V = 0.53 (p = 0.001) were identified.
When analyzing the relationship between the H-Ras expression and progression-free survival, Kramer’s correlation coefficient before the treatment was V = 0.47 (χ2 = 68.92, p = 0.001) and V = 0.45 (χ2 = 62.11, p = 0.001) after the treatment, which indicates the presence of relatively strong correlation. Also, the correlation between the percentage of positively stained for H-Ras cells and progression-free survival (time to progression) was investigated. Spearman’s correlation coefficient was calculated: r = -0.78 before the treatment and r = -0.72 after the treatment.
The relationship between H-Ras and progesterone receptors turned to be less pronounced and accounted for V = 0.32 (p = 0.06) before the treatment and V = 0.25 (p = 0.17) after the treatment. Correlation between H-Ras and estrogen receptors was found to be V = 0.26 (p = 0.15) before the treatment and V = 0.23 (p = 0.11) after the treatment, which is considered to be moderate, however considering p value, the relationship was not significant.
When studying the relationship between H-Ras with effectiveness of anti-tumor therapy according to the RECIST 1 criteria, Kramer’s correlation coefficient was V = 0.1 (p = 0.84) and V = 0.15 (p = 0.94), the obtained results require further study.
Discussion
Ras activation in breast cancer tumour could occur in the presence of EGFR or HER2 without direct mutation in Ras itself and could account for 20-50% of cases [21], [22]. Thus, expression inhibition and H-Ras to nucleus signalling interruption could become a promising therapeutic target. The immunohistochemical study had shown that in 45% of breast cancer cases before the treatment and 35% of cases after the treatment H-Ras expression was present. Previous research indicated that H-Ras was expressed in 60% of breast cancer cases, while a mutation in this gene attribute to only 5-10% of cases, which could be due to post-transcriptional regulation mechanisms [23], [24]. Moreover, it was shown that H-Ras positive breast cancer patients had a worse prognosis than H-Ras negative patients. Analysis of relationship between the H-Ras expression and progression-free survival indicated a relatively strong correlation both before the treatment (V = 0.47; p = 0.001) and after the treatment (V = 0.45; p = 0.001). Correlation between H-Ras and progression-free survival (time to progression) before the treatment was r = -0.78 (p = 0.03) and after the treatment r = -0.72 (p = 0.04).
The results of this study showed that there is a correlation between H-Ras expression and Her2/neu expression (p = 0.001) as well as with the tumour proliferation index Ki-67 (p = 0.001) in patients with breast cancer. These results could indicate the potential clinical application of H-Ras as a prognostic factor or a therapeutic target for breast cancer treatment.
Footnotes
Funding: This work was supported by the grant of the Ministry of Education and Science of the Republic of Kazakhstan (grant № 0118PK00008) “Pharmacogenetic study of terpenoid molecules and the molecular mechanisms of their action.”
Competing Interests: The authors have declared that no competing interests exist
References
- 1.Stepina MB, Frolova MA. Rak molochnoj zhelezy:naibolee vazhnye nauchnye sobytiya i vyvody poslednih let. [Breast cancer:the most important scientific events and conclusions of recent years] Prakticheskaya onkologiya [Practical oncology] 2011;12(1):6–11. [Google Scholar]
- 2.De Azambuja E, Cardoso F, de Castro G, et al. Ki-67 as prognostic marker in early breast cancer:a meta-analysis of published studies involving 12,155 patient. Brit J Cancer. 2007;96:1504–1513. doi: 10.1038/sj.bjc.6603756. https://doi.org/10.1038/sj.bjc.6603756 PMid:17453008 PMCid:PMC2359936. [DOI] [PMC free article] [PubMed] [Google Scholar]
- 3.Jiang BH, Liu LZ. PI3K/PTEN signaling in angiogenesis and tumorigenesis. Adv Cancer Res. 2009;102:19–65. doi: 10.1016/S0065-230X(09)02002-8. https://doi.org/10.1016/S0065-230X(09)02002-8. [DOI] [PMC free article] [PubMed] [Google Scholar]
- 4.Karnoub AE, Weinberg RA. Ras oncogenes:split personalities. Nat Rev Mol Cell Biol. 2008;9(7):517–531. doi: 10.1038/nrm2438. https://doi.org/10.1038/nrm2438 PMid:18568040 PMCid:PMC3915522. [DOI] [PMC free article] [PubMed] [Google Scholar]
- 5.Jemal A, Siegel R, Xu J, Ward E. Cancer statistics, 2010. CA Cancer J. Clin. 2010;60(5):277–300. doi: 10.3322/caac.20073. https://doi.org/10.3322/caac.20073 PMid:20610543. [DOI] [PubMed] [Google Scholar]
- 6.Spandidos DA, Agnantis NJ. Human malignant tumours of the breast, as compared to their respective normal tissue, have elevated expression of the Harvey ras oncogene. Anticancer Res. 1984;4:269–272. [PubMed] [Google Scholar]
- 7.Agnantis NJ, Parissi P, Anagnostakis D, Spandidos DA. Comparative study of Harvey-ras oncogene expression with conventional clinicopathologic parameters of breast cancer. Oncology. 1986;43:36–39. doi: 10.1159/000226101. https://doi.org/10.1159/000226101 PMid:2417178. [DOI] [PubMed] [Google Scholar]
- 8.Xiao Yu Wu Wen, Tao Liu, Zhen Feng Wu. Identification of HRAS as cancer-promoting gene in gastric carcinoma cell aggressiveness. Am J Cancer Res. 2016;6(9):1935–1948. [PMC free article] [PubMed] [Google Scholar]
- 9.Efremidis AP, Agnantis NJ, Patra F, Papadopoulou C, Spandidos DA. Clinical significance of elevated p21 ras oncogene expression in breast cancer patients. Cancer J. 1989;2:288–291. [Google Scholar]
- 10.Geyer FC, Li A, Papanastasiou AD, Smith A, Selenica P, Burke KA, Edelweiss M, Wen HC, Piscuoglio S, Schultheis AM, Martelotto LG. Recurrent hotspot mutations in HRAS Q61 and PI3K-AKT pathway genes as drivers of breast adenomyoepitheliomas. Nat Commun. 2018;9(1):1816. doi: 10.1038/s41467-018-04128-5. https://doi.org/10.1038/s41467-018-04128-5 PMid:29739933 PMCid:PMC5940840. [DOI] [PMC free article] [PubMed] [Google Scholar]
- 11.Giai M, Roagna R, Ponzone R, De Bortoli M. Prognostic and predictive relevance of c-erbB-2 and ras expression in node positive and negative breast cancer. Anticancer Res. 1994;14(3B):1441–50. PMID:7915096. [PubMed] [Google Scholar]
- 12.Roy D, Calaf G, Hei TK. Allelic imbalance at 11p15.5-15.4 correlated with c-Ha-ras mutation during radiation-induced neoplastic transformation of human breast epithelial cells. Int J Cancer. 2003;103:730–737. doi: 10.1002/ijc.10895. https://doi.org/10.1002/ijc.10895 PMid:12516091. [DOI] [PubMed] [Google Scholar]
- 13.Downward J. Targeting RAS signalling pathways in cancer therapy. Nat Rev Cancer. 2003;3:11–22. doi: 10.1038/nrc969. https://doi.org/10.1038/nrc969 PMid:12509763. [DOI] [PubMed] [Google Scholar]
- 14.Baines AT, Xu D, Der CJ. Inhibition of Ras for cancer treatment:the search continues. Future Med Chem. 2011;3(14):1787–1808. doi: 10.4155/fmc.11.121. https://doi.org/10.4155/fmc.11.121 PMid:22004085 PMCid:PMC3347641. [DOI] [PMC free article] [PubMed] [Google Scholar]
- 15.Cox AD, Der CJ, Philips MR. Targeting RAS Membrane Association:Back to the Future for Anti-RAS Drug Discovery? Clin Cancer Res. 2015;21(8):1819–27. doi: 10.1158/1078-0432.CCR-14-3214. https://doi.org/10.1158/1078-0432.CCR-14-3214 PMid:25878363 PMCid:PMC4400837. [DOI] [PMC free article] [PubMed] [Google Scholar]
- 16.Sirota V. Radiomodification by capecitabine and arglabin in radiation therapy of breast cancer patients. Dove press journal:breast cancer:targets and therapy. 2014;6:179–189. [Google Scholar]
- 17.Zhumakayeva A, Rakhimov K, Sirota V, Arystan L, Madiyarov A, Adekenov S. Long-term results of combination therapy for locally advanced breast cancer. Georgian Med News. 2018;282:30–35. [PubMed] [Google Scholar]
- 18.Sharif S, Moran A, Huson SM, Iddenden R, Shenton A, Howard E, Evans DG. Women with neurofibromatosis 1 are at a moderately increased risk of developing breast cancer and should be considered for early screening. J Med Genet. 2007;44(8):481–4. doi: 10.1136/jmg.2007.049346. https://doi.org/10.1136/jmg.2007.049346 PMid:17369502 PMCid:PMC2597938. [DOI] [PMC free article] [PubMed] [Google Scholar]
- 19.Guran S, Safali M. A case of neurofibromatosis and breast cancer:loss of heterozygosity of NF1 in breast cancer. Cancer Genet Cytogenet. 2005;156(1):86–8. doi: 10.1016/j.cancergencyto.2004.04.019. https://doi.org/10.1016/j.cancergencyto.2004.04.019 PMid:15588864. [DOI] [PubMed] [Google Scholar]
- 20.Yu F, Yao H, Zhu P, Zhang X, Pan Q, Gong C, Huang Y, Hu X, Su F, Lieberman J, Song E. let-7 Regulates Self Renewal and Tumorigenicity of Breast Cancer Cells. Cell. 2007;131(6):1109–23. doi: 10.1016/j.cell.2007.10.054. https://doi.org/10.1016/j.cell.2007.10.054 PMid:18083101. [DOI] [PubMed] [Google Scholar]
- 21.Eckert LB, Repasky GA, Ulku AS, McFall A, Zhou H, Sartor CI, Der CJ. Involvement of Ras activation in human breast cancer cell signaling, invasion, and anoikis. Cancer Res. 2004;64(13):4585–92. doi: 10.1158/0008-5472.CAN-04-0396. https://doi.org/10.1158/0008-5472.CAN-04-0396 PMid:15231670. [DOI] [PubMed] [Google Scholar]
- 22.Pylayeva-Gupta Y, et al. RAS oncogenes:weaving a tumorigenic web. Nat Rev Cancer. 2011;11:761–774. doi: 10.1038/nrc3106. https://doi.org/10.1038/nrc3106 PMid:21993244 PMCid:PMC3632399. [DOI] [PMC free article] [PubMed] [Google Scholar]
- 23.Gloria M. Calaf and Jorge Abarca-quinones. Ras protein expression as a marker for breast cancer. Oncol Lett. 2016;11(6):3637–3642. doi: 10.3892/ol.2016.4461. https://doi.org/10.3892/ol.2016.4461 PMid:27284366 PMCid:PMC4887929. [DOI] [PMC free article] [PubMed] [Google Scholar]
- 24.Hatzidaki E, Parsonidis P, Apostolou P, Daikopoulou V, Papasotiriou I. Novel small molecule decreases cell proliferation, migration, clone formation, and gene expression through ERK inhibition in MCF-7 and MDA-MB-231 breast cancer cell lines. Anticancer Drugs. 2019;30(6):618–27. doi: 10.1097/CAD.0000000000000766. https://doi.org/10.1097/CAD.0000000000000766 PMid:30741723. [DOI] [PubMed] [Google Scholar]