Abstract
Metabolomics aims at the comprehensive identification of metabolites in complex mixtures to characterize the state of a biological system and elucidate their roles in biochemical pathways. For many biological samples, a large number of spectral features observed by NMR spectroscopy and mass spectrometry (MS) belong to unknowns, i.e. these features do not belong to metabolites that have been previously identified, and their spectral information is not available in databases. By combining NMR, MS, and combinatorial cheminformatics, the analysis of unknowns can be pursued in complex mixtures requiring minimal purification. This chapter describes the SUMMIT MS/NMR approach covering sample preparation, NMR and MS data collection and processing, and the identification of likely unknowns with the use of cheminformatics tools and the prediction of NMR spectral properties.
1. INTRODUCTION
The field of metabolomics (or metabonomics) represents a systems biological or -omics approach to the study of metabolites in biological systems, such as biofluids, cell cultures, tissues, or whole organisms (Nicholson & Wilson, 2003). The characterization and quantitation of the metabolites provides valuable information about the state of an organism. It has been estimated that the human body alone contains over 100,000 different metabolites (Markley, Brüschweiler, Edison, Eghbalnia, Powers, Raftery et al., 2017). While an increasing number of metabolites can be found in spectroscopic databases (Markley, Ulrich, Berman, Henrick, Nakamura & Akutsu, 2008; Tautenhahn, Cho, Uritboonthai, Zhu, Patti & Siuzdak, 2012; Wishart, Feunang, Marcu, Guo, Liang, Vazquez-Fresno et al., 2018), a large number remains “unknown”, i.e. their spectral features are observed in experiments, but their chemical identities remain unknown. Identification of unknowns is an important task to discover biochemical pathways and understand their role for health and disease, and to provide this information for a broad range of untargeted metabolomics studies.
Identification of unknowns by traditional natural product analysis methods, which are mostly based on nuclear magnetic resonance (NMR) spectroscopy, requires their physical separation. This is a very time-consuming process and, hence, impractical for routine and high-throughput applications. The two primary analytical techniques in metabolomics are NMR (Larive, Barding & Dinges, 2015; Markley et al., 2017; Nagana Gowda & Raftery, 2017) and mass spectrometry (MS) (Gowda & Djukovic, 2014; Huan, Tang, Li, Shi, Lin & Li, 2015; Rathahao-Paris, Alves, Junot & Tabet, 2016). However, when these two methods are used independently, identification of unknown metabolites in complex biological mixtures is a challenge (Bingol & Brüschweiler, 2015).
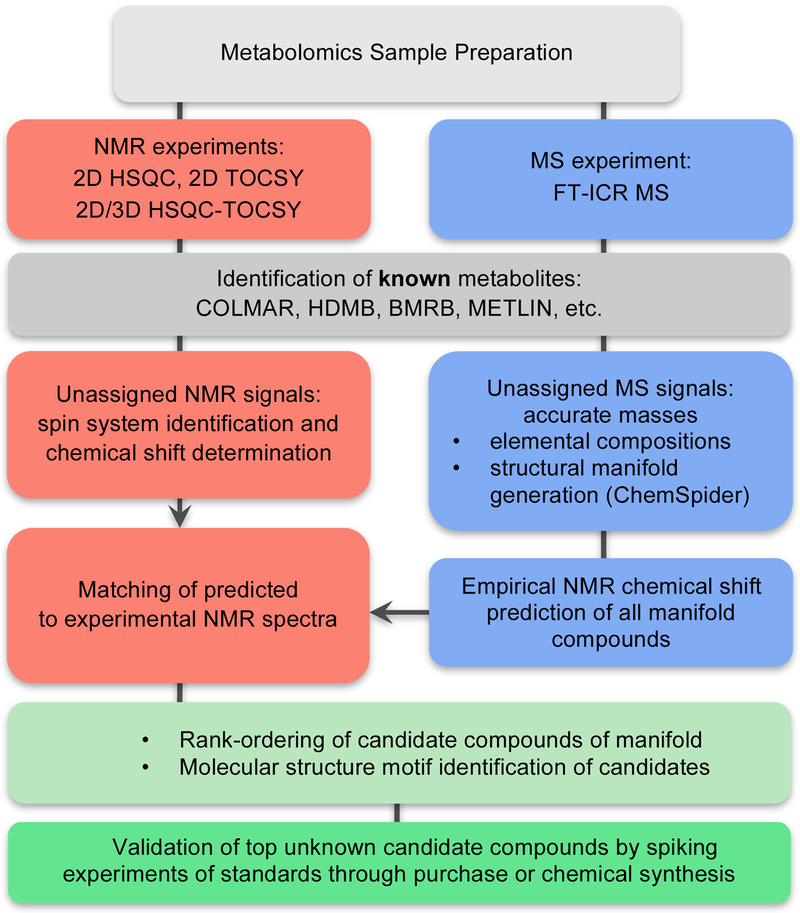
We describe here a recent approach for the determination of unknowns in complex mixtures called SUMMIT MS/NMR (for Structure of Unknown Metabolomic Mixture components by MS/NMR), which synergistically combines data obtained from both experimental methods along with information from combinatorial cheminformatics (Bingol, Bruschweiler-Li, Yu, Somogyi, Zhang & Brüschweiler, 2015; Wang, He, Li, Bruschweiler-Li, Marshall & Brüschweiler, 2017). The approach can dramatically shorten the time for the identification of unknown metabolites and is applicable to a wide range of complex mixtures encountered in metabolomics. The general workflow of SUMMIT MS/NMR is depicted in Figure 1 and the individual steps are discussed in more detail in the following sections.
Figure 1.
Flowchart of the SUMMIT MS/NMR method.
2. SAMPLE PREPARATION
2.1. Metabolite extraction
Complex metabolite mixture analysis can be performed after an appropriate extraction procedure based on sample type. Polar and non-polar metabolites should be separated and subjected to measurements under different solvent conditions. The extraction protocol should reduce protein content so that residual proteins will not interfere with subsequent NMR/MS measurements. Critical steps include the following:
Grind solid samples (using an established method such as mortar and pestle or a homogenizer) to release metabolites from the matrix into a liquid. Liquid samples that do not contain proteins can be prepared for measurement without further treatment. Liquid samples containing proteins should be diluted with water until the protein concentration is below 2 mg/mL and should be subjected to the following solvent extraction protocol.
Add sequentially cold methanol then cold chloroform in a ratio of 1:1:1 (liquid sample:methanol:chloroform) and vortex vigorously after each addition (Zhang, Bruschweiler-Li, Robinette & Brüschweiler, 2008).
Leave the mixture on ice for 30 minutes.
Centrifuge at 5,000 xg for 30 minutes for phase separation. A thin layer of protein precipitate, if any, will form between the polar and non-polar phases.
Carefully transfer each phase to a separate new tube.
Dry both the polar and non-polar phases using a speedvac/rotary evaporator/lyophilizer as appropriate.
Aliquot the sample for subsequent NMR and MS measurements.
2.2. Preparing polar sample for NMR measurements
Re-suspend the dried sample by adding 178 μL of D2O, 20 μL of 500 mM sodium phosphate buffer prepared in D2O so that the final pH is 7–7.4, and 2 μL of DSS (4,4-dimethyl-4-silapentane-1-sulfonic acid) for a final concentration of 0.2–1 mM. For a liquid sample (e.g. urine) use 178 μL of sample instead of D2O.
Transfer the total volume of 200 μL to a 3 mm NMR tube. Optionally, a 5 mm tube can be used by scaling up each solution to make the final volume 600 μL.
2.3. Preparing polar sample for MS measurements
Re-suspend 1.5–2 mg of dried sample in 200 μL of H2O.
Aliquot 10 μL of the sample to a new tube.
Dilute the aliquot 10-fold with 50%/50% (v/v) ACN/H2O containing 0.1% formic acid.
3. NMR EXPERIMENTS
Acquire the following 2D and 3D NMR spectra of metabolite mixtures with a high-field Bruker AVANCE solution-state NMR spectrometer, if possible equipped with a cryogenically cooled TCI probe at 298 K. To obtain high spectral resolution and sensitivity, a high magnetic field strength is desired, e.g. 20 Tesla (corresponding to 850 MHz proton frequency), but lower fields such as 600–800 MHz should suffice.
3.1. 2D 13C-1H HSQC
Collect the 2D 13C–1H HSQC spectra (standard Bruker pulse sequence: hsqcetgpsisp2.2) with 256 t1 and 1024 t2 complex points for a total measurement time of ~2 h. For an 850 MHz spectrometer, set the spectral width along the indirect and direct dimensions to 34205.6 and 10204.1 Hz, respectively (for spectrometers at other magnetic fields, scale the spectral widths proportionally to the field). Set the number of acquisitions per t1 increment to 8 (number of scans). Set the transmitter frequency offset to 80 ppm in the 13C dimension and 4.7 ppm in the 1H dimension. Set the relaxation delay to 1.5 s. The number of scans and t1 increments can be increased to meet the sensitivity and resolution requirements.
3.2. 2D 1H-1H TOCSY
Collect the 2D 1H–1H TOCSY spectra (standard Bruker pulse sequence: dipsi2gpphzs.2, which is optionally modified to suppress strong diagonal peaks) with 512 t1 and 1024 t2 complex points for a total measurement time of ~4 h. Set the spectral width along the indirect and direct dimensions to 10204.1 Hz (for 850 MHz spectrometer). Set the number of acquisitions per t1 increment to 8. Set the transmitter frequency offset to 4.7 ppm in both 1H dimensions. Set the TOCSY mixing time to 80–120 ms, depending on the size of the expected spin systems (larger spin systems benefit from longer mixing times). Set the relaxation delay to 2 s.
3.3. 2D 13C-1H HSQC-TOCSY
Collect the 2D 13C–1H HSQC-TOCSY spectra (standard Bruker pulse sequence: hsqcdietgpsisp.2) with 512 t1 and 2048 t2 complex points for a total measurement time of ~8.5 h. Set the spectral width along the indirect and direct dimensions is 34205.6 and 10204.1 Hz, respectively (for 850 MHz spectrometer). Set the number of acquisitions per t1 increment to 16. Set the transmitter frequency offset to 80 ppm in the 13C dimension and 4.7 ppm in the 1H dimension. Set the TOCSY mixing time for the 2D 13C–1H HSQC-TOCSY to 80–120 ms. Set the relaxation delay to 1.5 s.
3.4. 3D 13C-1H HSQC-TOCSY
Collect the 3D 13C–1H HSQC-TOCSY spectra (standard Bruker pulse sequence: hsqcdietgpsisp3d.2) with 64 t1, 128 t2, and 2048 t3 complex points for a total measurement time of ~113 h. Set the spectral width along the indirect and direct dimensions to 34205.6, 10204.1, and 10204.1 Hz (for 850 MHz spectrometer). Set the number of acquisitions per t1 increment to 8. Set the transmitter frequency offset to 80 ppm in the 13C dimension and 4.7 ppm in the 1H dimension. Set the relaxation delay to 1.45 s.
3.5. NMR data processing
Process the data using NMRPipe (Delaglio, Grzesiek, Vuister, Zhu, Pfeifer & Bax, 1995) by carrying out two-fold zero-filling along the indirect dimensions, apodization with a sine-bell window function, followed by Fourier transformation and phase- and baseline-correction. Peak-pick all spectra using Sparky (Goddard & Keller). Convert all NMR spectra to MATLAB format for maximal clique analysis.
4. ANALYSIS OF NMR SPECTRA
4.1. Discrimination between knowns and unknowns
Before determining unknowns from the spectra of complex mixtures, it is important to first discriminate spectral peaks that belong to unknowns from peaks that belong to known metabolites. Features identified via MS will be queried on various publicly available databases of known analytes, such as METLIN (Smith, O’Maille, Want, Qin, Trauger, Brandon et al., 2005) or HMDB (Wishart et al., 2018). On the NMR side, this is directly accomplished by the COLMARm method (Bingol, Li, Zhang & Brüschweiler, 2016), which is based on analysis of two to three 2D NMR spectra of a complex mixture, including a 2D 13C-1H HSQC along with a 2D 1H-1H TOCSY and/or a 2D 13C-1H HSQC-TOCSY.
Upload these spectra to the public COLMARm web server (http://spin.ccic.ohio-state.edu/index.php/colmarm) where the HSQC spectrum is automatically peak-picked and queried against the COLMAR metabolomics database (Bingol et al., 2016), which will return a list of known metabolites present in the mixture.
Validate the metabolite list against either one or both TOCSY-based experiments through the COLMARm interface.
The same 2D NMR spectra are subsequently used for the determination of unknowns via the SUMMIT MS/NMR protocol because cross-peaks that remained unassigned are candidates to belong to unknown metabolites.
4.2. NMR spin system determination of unknowns
The NMR signals that remain unassigned need first to be sorted into individual spin systems. The determination of spin system information is based on multidimensional 13C-1H and 1H-1H NMR cross-peaks. The 3D 13C-1H HSQC-TOCSY provides 13C(ω1), 1H(ω2), and 1H(ω3) correlations and resolves overlap of cross-peaks in the 2D 13C(ω1)-1H(ω2) plane by spreading the resonances along the orthogonal 1H(ω3) dimension, which is the direct 1H detection dimension (Misiak & Kozminski, 2009; Reardon, Marean-Reardon, Bukovec, Coggins & Isern, 2016). Measuring an additional high-resolution 2D 13C-1H HSQC spectrum to complement the 13C and 1H correlation information from the 3D experiment is suggested. Determine the unknown spin system information directly from the 3D 13C-1H HSQC-TOCSY NMR spectrum as follows:
From the 3D 13C-1H HSQC-TOCSY spectrum, extract all 1D 1H traces along ω3 for each 13C-1H cross-peak (ω1, ω2) identified from the high-resolution 2D 13C-1H HSQC spectrum.
Compare the 1H-1H correlations in the 1D 1H traces along ω3 for each pair of 13C-1H cross-peaks to determine whether two 13C-1H cross-peaks belong to the same molecule. For a pair of 13C-1H cross-peaks, (ω1’, ω2’) and (ω1’’, ω2’’), if they share 3D cross-peaks at positions (ω1,ω2,ω3) = (ω1’,ω2’,ω2’), (ω1’,ω2’,ω2’’), (ω1’’,ω2’’,ω2’’), (ω1’’,ω2’’,ω2’) with proton chemical shift error within 0.02 ppm, they are considered as peaks from the same spin system.
After finding all pairs of 2D cross-peaks that are connected in step 2, use these cross-peaks to define the edges of a mathematical graph in which the nodes correspond to directly bonded 13C-1H spin pairs. Analyze this graph in terms of “maximal clique” analysis using the Bron-Kerbosch algorithm (Li, Wang & Brüschweiler, 2017).
After all spin systems are determined automatically, they can optionally be manually refined in order to minimize the occurrence of false positives by visually confirming the spin systems with the 2D 13C-1H HSQC-TOCSY and 2D 1H-1H TOCSY spectra (Wang et al., 2017).
Store all the spin system information as a group of pairs of (13C, 1H) peaks for subsequent spin system scoring as described in Section 8.
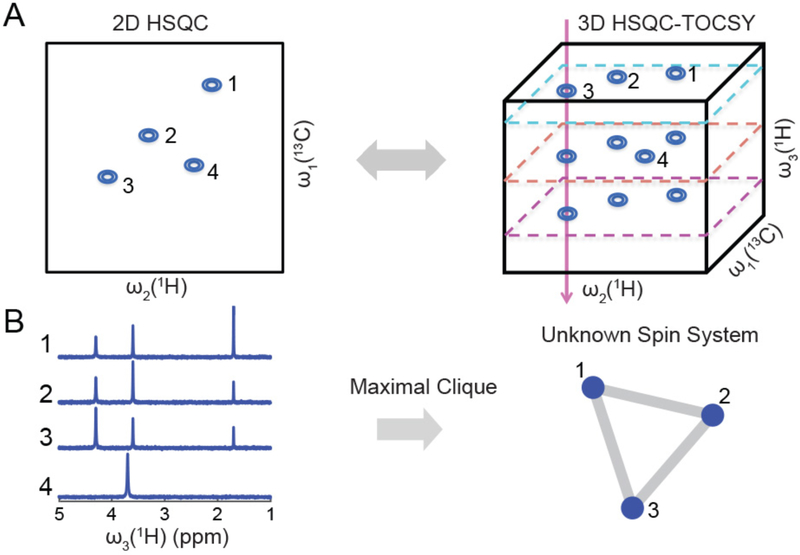
To increase the resolution of the two indirect dimensions while keeping the measurement time reasonably short, the use of non-uniform sampling methods in the 3D experiment (Kazimierczuk & Orekhov, 2015) is recommended. Figure 2 depicts a schematic diagram for spin system determination from the 3D 13C-1H HSQC-TOCSY NMR spectrum.
Figure 2.
Extraction of spin systems of individual mixture compounds from the 3D 13C-1H HSQC-TOCSY. Panel (A) shows the relationship between cross-peaks from the 2D 13C-1H HSQC spectrum (left) and the 3D 13C-1H HSQC-TOCSY spectrum (right). Panel (B) illustrates how 1D cross sections along ω3 (1H) of the 3D HSQC-TOCSY spectrum of (A) yield spin system information, which is extracted by use of a maximal clique approach. Traces 1, 2, 3 show high similarity because they belong to the same spin system consisting of three protons, whereas trace 4 belongs to a separate spin system with a single proton. Figure adapted with permission from Wang et al., 2017.
5. MS EXPERIMENTS
Due to its very high mass accuracy (0.1–1.0 ppm), ultrahigh resolution Fourier transform ion cyclotron resonance mass spectrometry (FT-ICR MS) enables the determination of the elemental compositions of metabolites in complex mixtures (Kim, Rodgers & Marshall, 2006; Marshall, Hendrickson & Jackson, 1998). Here we describe the experimental protocol and parameter settings for a 15 Telsa FT-ICR MS experiment. Other high-resolution MS instruments (e.g. Q-TOF MS) follow the same protocol, although the parameter settings vary depending on the instrument used.
Calibrate the FT-ICR MS instrument and measure samples to obtain accurate masses in both positive and negative ion mode. For initial calibration, directly inject the standard amino acid mixture from Sigma-Aldrich into the FT-ICR MS instrument. Select electrospray ionization (ESI) mode, set the mass range (m/z) to 50–1000, select positive ion mode, and run the polynomial calibration (> 4 calibration points). After tuning and acquisition, select the calibration reference (m/z of protonated amino acids) to compare with the experimental mass spectrum and check that the characteristic peaks are within a mass error of 0.1 ppm.
Collect both mass spectra of the background (solvent only) and metabolite mixture with the 15T FT-ICR MS instrument. Perform all FT-ICR MS experiments with a flow rate of 2.5 μL/min for 1 min and acquire mass spectra over a mass range (m/z) of 50–1000. Set the number of scans to 20. When the concentration of the metabolite mixture is low, the number of scans can be increased to 50 to enhance the sensitivity of mass spectrum.
Follow the same protocol to collect negative ion mode FT-ICR mass spectra.
6. ANALYSIS OF MS SPECTRA
6.1. FT-ICR MS data processing
Calibrate and analyze the FT-ICR mass spectrum based on common compounds in the metabolite mixture that are known (e.g. leucine and methionine) by the Compass data analysis software from Bruker Daltonics. Generate the mass peak list (m/z) from mass range 100–1000 with the signal to noise ratio set to 10.
After generating the accurate mass list (m/z), compare the mass spectrum of the metabolite mixture with the background (solvent) to remove the redundant mass peaks with same intensity as the background mass spectrum.
6.2. Accurate mass determination by MS
Positive ion mode data: for each mass peak (m/z), [M+H]+, [M+Na]+, [M+K]+, [M+ACN+H]+, [M+ACN+Na]+ and [M+2Na-H]+ (in which M is the metabolite or its derivative) are considered as possible adducts.
Negative ion mode data: for each mass peak (m/z), [M-H]−, [M+Na-2H]−, [M+Cl]− and [M-H2O-H]− are considered as possible adducts.
Convert all the mass peaks (m/z) to accurate masses (M) of all possible compounds.
6.3. Elemental compositions and chemical structures
Convert the accurate masses to molecular formulas CcHhNnOoSsPp (with mass error cutoff set to 0.2–0.5 ppm) using the freely accessible program Molecular Formula Generator (Kind & Fiehn, 2007).
Convert the given molecular formulas to molecular structures using a chemical database such as ChemSpider (Pence & Williams, 2010). Download all molecular structures for further analysis. Other (public) chemical databases, such as PubChem (Kim, Thiessen, Bolton, Chen, Fu, Gindulyte et al., 2016) can be used in lieu of or in addition to ChemSpider.
7. NMR CHEMICAL SHIFT PREDICTION OF LIBRARY COMPOUNDS
For all molecular structures downloaded in Section 6, predict the 13C and 1H chemical shifts using the empirical chemical shift predictor developed by Modgraph (http://www.modgraph.co.uk/index.htm). Each prediction takes about 3–10 seconds.
Based on compound topology and site-specific 13C and 1H chemical shift predictions, construct 2D HSQC spectra of all individual spin systems for all compound candidates and save them for subsequent comparison with experimentally determined spin systems.
8. SPIN SYSTEM SCORING AND MOLECULAR STRUCTURAL MOTIF IDENTIFICATION OF CHEMICAL COMPOUNDS (MSMIC)
Compare all predicted 2D 13C-1H HSQC NMR spectra of the library compounds to each experimental spin system with the same number of spins. Apply a weighted matching algorithm (e.g. the Hungarian method using the Munkres assignment algorithm) to find the closest matching peak pairs between the experimental and predicted spin systems (Munkres, 1957).
- Calculate and store the corresponding chemical shift root-mean-square deviation (RMSD) (Equation 1) between each experimentally determined spin system and each candidate compound with cutoff < 5 ppm:
Xexp are the experimental chemical shifts, Xpred are the predicted chemical shifts, and N is the number of HSQC cross-peaks of the spin system. (A scaling factor of 10 is used to normalize the effects of 13C and 1H chemical shifts on the overall RMSD by correcting for the different chemical shift ranges of 13C vs. 1H nuclei.)(1) For each experimentally determined spin system, rank-order all compounds that fulfill the cutoff < 5 ppm according to the chemical shift RMSDs with the compounds with the smallest RMSD appearing first.
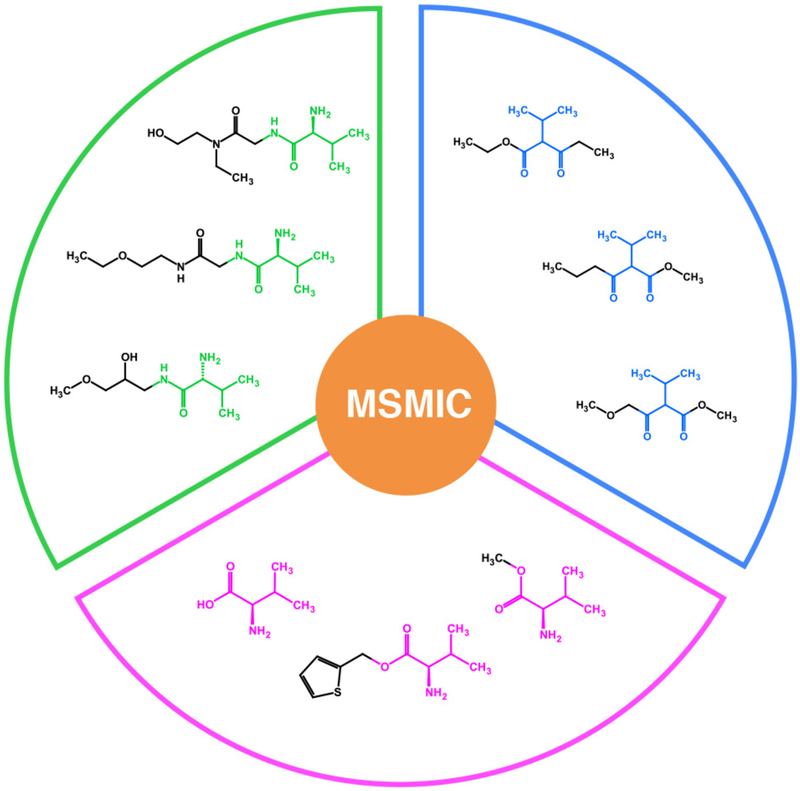
Each experimental spin system yields a number of matched compound candidates ranging from dozens to hundreds or even thousands. Apply the approach “molecular structural motif identification of chemical compounds,” or MSMIC, to find all distinct molecular structural motifs defined by carbons and protons that correspond to the experimental spin system. Sort all compound candidates into groups according to their MSMICs by use of the nearest neighbor heavy atom for discrimination between MSMICs.
If the quantum chemical calculations of NMR chemical shifts are available, select molecular representatives of all high scoring MSMICs for a more accurate ranking of MSMICs.
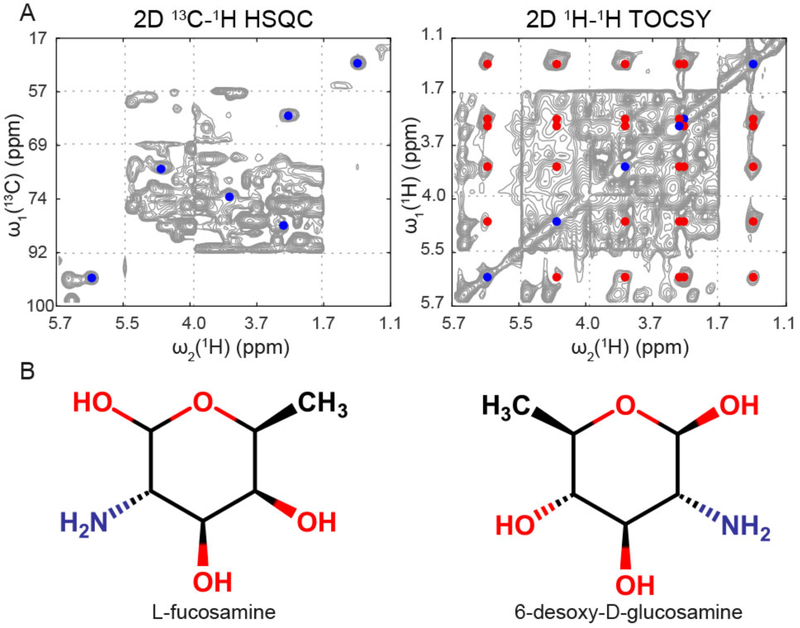
Figure 3 illustrates the MSMIC approach for unknown metabolite characterization. Figure 4 shows an example of unknown spin system determination and some of the top-scoring candidates for an unknown metabolite. Following the above protocol, each unknown spin system yields a limited number of likely candidates for the unknown compound, which will be subject to compound verification as described in Section 9.
Figure 3.
Molecular structural motifs identified by the SUMMIT MS/NMR method. The hits are sorted into different groups according to their common molecular motif that represents the NMR-derived spin system.
Figure 4.
A spin system of an unknown compound from an E. coli cell lysate extracted from the 3D HSQC-TOCSY and verified by 2D TOCSY (and 2D HSQC-TOCSY). (A) Cross-peaks of the unknown compound shown in the 2D HSQC (blue cross-peaks) and 2D TOCSY (blue and red cross-peaks) spectra. (B) Two of the top scoring compounds matching the unknown spin system.
9. COMPOUND VERIFICATION: SPIKING WITH PURCHASED OR SYNTHESIZED CANDIDATE COMPOUNDS
Validate the putatively matched unknown compounds by NMR spiking experiments, which are the “gold standard” for compound verification (Sumner, Amberg, Barrett, Beale, Beger, Daykin et al., 2007).
If available, purchase the top candidate compound(s). In the case that the compound is not commercially available, it needs to be custom synthesized.
Collect the 2D 13C-1H HSQC spectra of the compound candidates using the same experimental conditions used to collect the metabolite mixture, i.e. the same pH and NMR pulse sequence as used in Section 3.1. Compare the spectral peaks of the candidate compounds with the unknown peaks in the metabolite mixture spectrum to identify and narrow down the compounds with the closest chemical shift agreement. Add the standard spectra of all the compounds to a NMR metabolomics database (Bingol et al., 2016; Markley et al., 2008; Wishart et al., 2018).
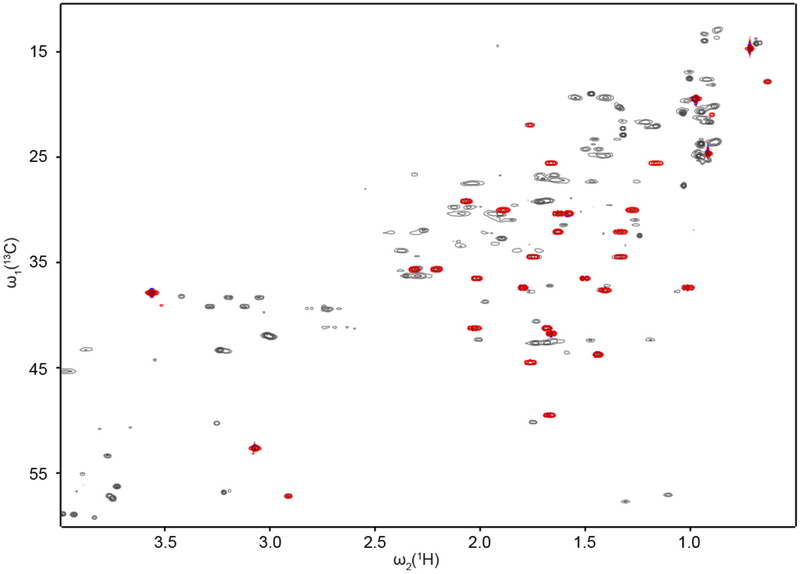
Spike the top candidate compounds one at a time, into the sample and collect the 2D 13C-1H HSQC to validate the identity of the unknown. If the chemical shifts of a spiked compound agree with the chemical shifts of the unknown, the compound is a positive hit. Figure 5 shows an example of the chemical shifts of a spiking compound agreeing with the chemical shifts of an unknown.
Figure 5.
Final verification of a top ranked candidate compound by 2D 13C-1H HSQC NMR experiments by comparison of the spectrum of the pure compound (red peaks) with the peaks of the unknown compound in the complex metabolite mixture (gray peaks). The good chemical shift agreement confirms the identity of the unknown mixture compound.
10. CONCLUSIONS AND OUTLOOK
Structure elucidation of unknown metabolites in complex metabolomics mixtures by traditional methods is time- and labor-intensive. The SUMMIT MS/NMR approach provides a significant speed-up of this task by minimizing sample separation and adopting an integrated platform that uses the high complementarity of high-resolution NMR and MS experiments in combination with cheminformatics. SUMMIT can be largely automated, perhaps with the exception of the customized chemical synthesis step. The general nature of SUMMIT MS/NMR should make it applicable also to the analysis of complex molecular mixtures beyond metabolomics.
ACKNOWLEDGMENTS
This work was supported by the National Institutes of Health (grant R01 GM 066041) and SECIM (Southeast Center for Integrated Metabolomics) grant U24 DK097209-01A1. All NMR and MS experiments were performed at the CCIC facility at OSU.
REFERENCES
- Bingol K, & Brüschweiler R (2015). Two elephants in the room: new hybrid nuclear magnetic resonance and mass spectrometry approaches for metabolomics. Curr Opin Clin Nutr Metab Care 18, 471–477. [DOI] [PMC free article] [PubMed] [Google Scholar]
- Bingol K, Bruschweiler-Li L, Yu C, Somogyi A, Zhang F, & Brüschweiler R (2015). Metabolomics beyond spectroscopic databases: a combined MS/NMR strategy for the rapid identification of new metabolites in complex mixtures. Anal Chem 87, 3864–3870. [DOI] [PMC free article] [PubMed] [Google Scholar]
- Bingol K, Li DW, Zhang B, & Brüschweiler R (2016). Comprehensive Metabolite Identification Strategy Using Multiple Two-Dimensional NMR Spectra of a Complex Mixture Implemented in the COLMARm Web Server. Analytical Chemistry 88, 12411–12418. [DOI] [PMC free article] [PubMed] [Google Scholar]
- Delaglio F, Grzesiek S, Vuister GW, Zhu G, Pfeifer J, & Bax A (1995). Nmrpipe - a Multidimensional Spectral Processing System Based on Unix Pipes. Journal of Biomolecular Nmr 6, 277–293. [DOI] [PubMed] [Google Scholar]
- Goddard TD, & Keller DG SPARKY 3. University of California; San Francisco. [Google Scholar]
- Gowda GA, & Djukovic D (2014). Overview of mass spectrometry-based metabolomics: opportunities and challenges. Methods Mol Biol 1198, 3–12. [DOI] [PMC free article] [PubMed] [Google Scholar]
- Huan T, Tang C, Li R, Shi Y, Lin G, & Li L (2015). MyCompoundID MS/MS Search: Metabolite Identification Using a Library of Predicted Fragment-Ion-Spectra of 383,830 Possible Human Metabolites. Anal Chem 87, 10619–10626. [DOI] [PubMed] [Google Scholar]
- Kazimierczuk K, & Orekhov V (2015). Non-uniform sampling: post-Fourier era of NMR data collection and processing. Magnetic Resonance in Chemistry 53, 921–926. [DOI] [PubMed] [Google Scholar]
- Kim S, Rodgers RP, & Marshall AG (2006). Truly “exact” mass: Elemental composition can be determined uniquely from molecular mass measurement at similar to 0.1 mDa accuracy for molecules up to similar to 500 Da. Int J Mass Spectrom 251, 260–265. [Google Scholar]
- Kim S, Thiessen PA, Bolton EE, Chen J, Fu G, Gindulyte A, Han LY, He JE, He SQ, Shoemaker BA, et al. (2016). PubChem Substance and Compound databases. Nucleic Acids Research 44, D1202–D1213. [DOI] [PMC free article] [PubMed] [Google Scholar]
- Kind T, & Fiehn O (2007). Seven Golden Rules for heuristic filtering of molecular formulas obtained by accurate mass spectrometry. Bmc Bioinformatics 8. [DOI] [PMC free article] [PubMed] [Google Scholar]
- Larive CK, Barding GA Jr., & Dinges MM (2015). NMR spectroscopy for metabolomics and metabolic profiling. Anal Chem 87, 133–146. [DOI] [PubMed] [Google Scholar]
- Li DW, Wang C, & Brüschweiler R (2017). Maximal clique method for the automated analysis of NMR TOCSY spectra of complex mixtures. Journal of Biomolecular Nmr 68, 195–202. [DOI] [PMC free article] [PubMed] [Google Scholar]
- Markley JL, Brüschweiler R, Edison AS, Eghbalnia HR, Powers R, Raftery D, & Wishart DS (2017). The future of NMR-based metabolomics. Curr Opin Biotechnol 43, 34–40. [DOI] [PMC free article] [PubMed] [Google Scholar]
- Markley JL, Ulrich EL, Berman HM, Henrick K, Nakamura H, & Akutsu H (2008). BioMagResBank (BMRB) as a partner in the Worldwide Protein Data Bank (wwPDB): new policies affecting biomolecular NMR depositions. Journal of Biomolecular Nmr 40, 153–155. [DOI] [PMC free article] [PubMed] [Google Scholar]
- Marshall AG, Hendrickson CL, & Jackson GS (1998). Fourier transform ion cyclotron resonance mass spectrometry: A primer. Mass Spectrometry Reviews 17, 1–35. [DOI] [PubMed] [Google Scholar]
- Misiak M, & Kozminski W (2009). Determination of heteronuclear coupling constants from 3D HSQC-TOCSY experiment with optimized random sampling of evolution time space. Magnetic Resonance in Chemistry 47, 205–209. [DOI] [PubMed] [Google Scholar]
- Munkres J (1957). Algorithms for the Assignment and Transportation Problems. J Soc Ind Appl Math 5, 32–38. [Google Scholar]
- Nagana Gowda GA,& Raftery D (2017). Recent Advances in NMR-Based Metabolomics. Anal Chem 89, 490–510. [DOI] [PMC free article] [PubMed] [Google Scholar]
- Nicholson JK, & Wilson ID (2003). Understanding ‘global’ systems biology: Metabonomics and the continuum of metabolism. Nature Reviews Drug Discovery 2, 668–676. [DOI] [PubMed] [Google Scholar]
- Pence HE, & Williams A (2010). ChemSpider: An Online Chemical Information Resource. J Chem Educ 87, 1123–1124. [Google Scholar]
- Rathahao-Paris E, Alves S, Junot C, & Tabet JC (2016). High resolution mass spectrometry for structural identification of metabolites in metabolomics. Metabolomics 12. [Google Scholar]
- Reardon PN, Marean-Reardon CL, Bukovec MA, Coggins BE, & Isern NG (2016). 3D TOCSY-HSQC NMR for Metabolic Flux Analysis Using Non-Uniform Sampling. Analytical Chemistry 88, 2825–2831. [DOI] [PubMed] [Google Scholar]
- Smith CA, O’Maille G, Want EJ, Qin C, Trauger SA, Brandon TR, Custodio DE, Abagyan R, & Siuzdak G (2005). METLIN - A metabolite mass spectral database. Therapeutic Drug Monitoring 27, 747–751. [DOI] [PubMed] [Google Scholar]
- Sumner LW, Amberg A, Barrett D, Beale MH, Beger R, Daykin CA, Fan TWM, Fiehn O, Goodacre R, Griffin JL, et al. (2007). Proposed minimum reporting standards for chemical analysis. Metabolomics 3, 211–221. [DOI] [PMC free article] [PubMed] [Google Scholar]
- Tautenhahn R, Cho K, Uritboonthai W, Zhu ZJ, Patti GJ, & Siuzdak G (2012). An accelerated workflow for untargeted metabolomics using the METLIN database. Nature Biotechnology 30, 826–828. [DOI] [PMC free article] [PubMed] [Google Scholar]
- Wang C, He L, Li DW, Bruschweiler-Li L, Marshall AG, & Brüschweiler R (2017). Accurate Identification of Unknown and Known Metabolic Mixture Components by Combining 3D NMR with Fourier Transform Ion Cyclotron Resonance Tandem Mass Spectrometry. J Proteome Res 16, 3774–3786. [DOI] [PMC free article] [PubMed] [Google Scholar]
- Wishart DS, Feunang YD, Marcu A, Guo AC, Liang K, Vazquez-Fresno R, Sajed T, Johnson D, Li C, Karu N, et al. (2018). HMDB 4.0: the human metabolome database for 2018. Nucleic Acids Res 46, D608–D617. [DOI] [PMC free article] [PubMed] [Google Scholar]
- Zhang F, Bruschweiler-Li L, Robinette SL, & Brüschweiler R (2008). Self-consistent metabolic mixture analysis by heteronuclear NMR. Application to a human cancer cell line. Analytical Chemistry 80, 7549–7553. [DOI] [PMC free article] [PubMed] [Google Scholar]


