Abstract
Normalization of Western blotting data is a critical step that is needed to reduce errors caused by unequal sample loading across lanes in a gel, inconsistent sample preparation, and variations due to experimental errors. Several papers have suggested that total protein normalization may be better than housekeeping protein normalization for Western blotting normalization. Ponceau S is the most commonly used stain for total protein normalization. A review of the literature and commercial websites suggest a multitude of Ponceau S staining protocols for total protein staining of blots. In this study, we explored which Ponceau S staining protocol would result in the highest sensitivity of protein band detection. Unexpectedly, we found that irrespective of the Ponceau S concentration (between 0.001 – 2% (w/v)), acid concentration, and acid type (acetic acid, trichloroacetic acid and/or sulfosalicylic acid), the sensitivity of protein detection remained constant. The most commonly used concentration of Ponceau S is 0.1%, while 0.001% (100-fold less) Ponceau S resulted in the same sensitivity of protein band detection. We suggest the use of the relatively inexpensive 0.01% Ponceau S in 1% acetic acid stain for total protein normalization as it is as effective as all the expensive formulations that are currently used.
Keywords: Ponceau S, Total protein staining, Western blot normalization
1. Introduction
To effectively determine the relative amount of a target protein on a blot, a normalization control is needed. Errors can arise from many sources including sample preparation, unequal sample loading, or uneven transfer, such as when bubbles prevent protein transfer from the gel to the membrane [1; 2; 3]. These errors, which can lead to incorrect interpretation of the data, are reduced by using a normalization control. The most commonly used normalization control is housekeeping protein normalization. For housekeeping protein normalization, housekeeping proteins such as β-actin, glyceraldehyde 3-phosphate dehydrogenase (GAPDH), or α-tubulin, which are expressed constitutively at relatively high levels, are probed together with the target protein using different antibodies [3; 4; 5]. Housekeeping proteins can also be probed after stripping a blot that was previously used to detect the target protein. The ratio of the abundance of the target protein to the housekeeping protein (normalization control) is used to quantify the amount of the target protein in each sample.
In the last decade several publications have suggested that the commonly used housekeeping proteins are not expressed at the same levels across cell types and experimental conditions [2; 4; 5; 6; 7; 8]. There are three major concerns with the use of housekeeping proteins as normalization controls. First, the high expression levels of the housekeeping proteins often result in signal intensities that exceed the linear dynamic range when detecting low abundant proteins on the same blot. Second, the housekeeping gene and protein levels can change during developmental phases and under different experimental conditions. And third, stripping and reprobing is often used to first detect the target protein and then detect the housekeeping protein. Stripping and reprobing, however, are not always quantitative because some of the protein on the membrane may be lost during stripping. For the most accurate normalization, the target protein and the normalization control should be detected on the same blot. These significant problems have led some scientific publishers (such as the Journal of Biological Chemistry) and funding agencies to suggest that validation is needed for each experimental group that uses antibodies and housekeeping proteins as normalization controls. Non-validated antibodies often result in artifactual results [3].
Another less commonly used method for total protein normalization is staining the membrane prior to immunodetection with a total protein stain to determine sample loading in each lane. This is an antibody-independent method that utilizes the collective signal from the many proteins in one sample lane, as opposed to the use of a single protein when a housekeeping protein is utilized. Several total protein stains are available including Ponceau S and Stains Free Stains [8; 9; 10]. Ponceau S, or 3-Hydroxy-4-(2-sulfo-4-[4-sulfophenylazo]phenylazo)-2,7-naphthalenedisulfonic acid sodium salt, is the most commonly used reversible stain put on membranes before Western blotting [11; 12]. Salinovich and Montelaro were the first to report the use of Ponceau S for membrane staining [13]. Following gel electrophoresis and transfer to a nitrocellulose or polyvinylidene difluoride (PVDF) membrane, this diazo dye can be applied to reveal protein bands with its red/pink stain while leaving a clear background [14]. Such binding is achieved by the negatively charged component of the dye attaching to the positively charged amino acids of proteins. It is only used on nitrocellulose and PVDF membranes, which have a neutral charge, as nylon membranes are positively charged, making it extremely difficult to remove the stain. On the neutral membranes, Ponceau S stains are easily removed from proteins by washing either with distilled (DI) water or Tris Buffered Saline (TBS) buffer.
While total protein normalization offers many advantages over housekeeping protein normalization [1; 2; 5; 8], analysis of Western blotting papers published in January 2018 on PubMed showed that > 96% of manuscripts, that included data for normalization of Western blots, use a housekeeping protein for normalization of Western blots (using manual tabulations of all manuscripts containing Western blotting). Ponceau S, a total protein stain, was recently recommended by the Journal of Biological Chemistry and the American Journal of Physiology [9; 15] as the preferred method for normalization of Western blots. Hence, the use of total protein staining for Western blotting normalization is likely to increase significantly over the next decade. Currently, a wide variety of Ponceau S formulations have been used to assess the quality of a transfer, locate proteins, and carry out normalization. The most commonly used formulations utilize between 0.1% and 2% Ponceau S. The solvent for the typical Ponceau S stain is also highly variable, ranging from 1% acetic acid to 30% trichloroacetic acid and 30% sulfosalicylic acid. In this report we investigated the different Ponceau S formulations currently utilized as well as others not currently utilized to determine the optimal Ponceau S stain for Western blot normalization. Our results suggest that a simple and less expensive Ponceau S stain (0.01% (w/v) Ponceau S in 1% acetic acid (v/v)) gives the same sensitivity of protein detection as all the other formulations, suggesting that one Ponceau S stain could be utilized for Western blotting normalization.
2. Materials and Methods
2.1. Materials
Proteomics grade Ponceau S in liquid form was purchased from Amresco (catalog# 97063, VWR, PA). Ponceau S solid was purchased from Alfa Aesar (MA, catalog# J60744), Trichloroacetic acid (TCA, catalog# UN1839, Fisher Scientific, PA), Sulfosalicylic Acid (SA, catalog# LC255201, LabChem, PA), Acetic Acid (catalog # UN2789, Fisher Scientific, PA), Bovine Serum Albumin (BSA, catalog# A7030, Sigma-Aldrich, MO). Rat livers were obtained from Pel-Freez Biologicals (Arkansas), Nitrocellulose (Trans-Blot® Turbo™ Midi Nitrocellulose Transfer Packs #1704159, Bio-Rad).
2.2. Sample Preparation and quantification
Liver from 3-month-old male and female rats were pooled and homogenized in a homogenization buffer containing 50mM Tris, 1mM EDTA, 150mM NaCl, 5mM MgCl2, pH 7.4 using a Dounce homogenizer and centrifuged at 12000 rpm for 15 minutes at 4°C. The supernatant was then removed, transferred in new tubes and quantified. The samples were quantified using the nanodrop 2000C (Thermo Scientific) using BSA as a standard. Homogenization buffer was used as the blank.
2.3. Ponceau S Preparation
Ponceau S powder was dissolved in milli Q water and acid(s) at the appropriate concentrations. The desired acid was measured and added to the Ponceau S solution and vortexed. The Ponceau S acid solutions used included 0.0001, 0.001, 0.01, 0.1, 0.2, 0.5% (w/v) Ponceau S in 1%, 5% (v/v) acetic acid, 3%, 30% (w/v) TCA or 30% (w/v) sulfosalicylic Acid. The following solutions were compared: 0.0001, 0.001, 0.01, 0.02, 0.05, 0.1% (w/v) Ponceau S in 1% (v/v) acetic acid; 0.1% Ponceau S in 1%, 10%, or 20% (v/v) acetic acid; 2% (w/v) Ponceau S in 30% (w/v) sulfosalicylic acid, and 2% (v/v) Ponceau S in 30% (w/v) sulfosalicylic acid and 30% (w/v) TCA.
2.4. Electrophoresis and Ponceau Staining
4μg and 10μg of liver samples were loaded onto Bio-Rad Midi Criterion TGX Precast sodium dodecyl sulfate–polyacrylamide gels (SDS-PAGE, 4-20%, catalog #5671095). Electrophoresis was carried out at 120V for 70 minutes or until dye front reached the bottom of the gel. Using the Trans-blot Turbo Transfer System (Bio-Rad), the proteins on the gel was transferred to nitrocellulose membrane (7 minutes). Membranes were stained with the different 3mL of Ponceau S solutions for 2 - 10 minutes on the shaker (100 rpms) at room temperature and then rinsed with distilled water to remove background stain. Membranes were destained with TBS (50 mM Tris, 150 mM NaCl, pH 7.5) solution containing 0.05% Tween 20 (TBST), rinsed with distilled water and restained with commercial Ponceau S. In other cases, membranes were first stained with commercial Ponceau S, imaged, destained, and then stained with different Ponceau S solutions. In a specific experiment, the effect of staining time was tested in 2-minute, 5-minute, and 10-minute trials. Imaging of the membrane was conducted by the Chemidoc MP (Bio-Rad). To prepare the strips for Western blotting, the strips were once again destained with TBST.
2.5. Western Blotting
The membrane strips were blocked at room temperature using 3% non-fat milk (Bio-Rad) in TBST for 1 hour on a shaker set at 100 rpms. The blocked strips were then incubated with primary antibodies PSMA6 (1:20,000, Abcam, catalog # ab109377, lot # GR60925-6) or PSMA3 (1:3000, clone MCP257, Biomol International, catalog #PW8115, Batch #z05821b) in 1% non-fat milk overnight at 4°C. After incubation, the membrane strips were washed three times in TBST for five minutes. The membrane was incubated for 1 hour at room temperature with goat anti-rabbit IgG peroxidase (HRP) (1:10,000, cat. #A0545, Sigma-Aldrich) or anti-mouse (1:15,000 anti-mouse Cat. # A9044, Sigma-Aldrich,) secondary antibody in TBST containing 1% non-fat milk. Membranes were then washed 3 times for 5 minutes each with TBST. For chemiluminescent imaging, Clarity ECL Substrate (Bio-Rad) was used to detect the HRP-conjugated secondary antibody. Membranes were incubated with Clarity substrate in the dark for 2 minutes. The strips were then imaged using the Chemidoc MP.
2.6. Ponceau Staining and Western Blotting Quantification
Images were quantified using Image Lab software (Version 5.2.1, Bio-Rad). Lanes were manually fit to each lane and all bands including faint bands were detected. Band intensities were totaled for each lane. Normalization using a commercial Ponceau S stain (Amresco) was conducted to minimize any discrepancies in protein amount. The averages and standard deviations were found for each set of experiments. Each result was independently reproduced by at least two different investigators. Using Sigma Plot 11 (Systat Software, Inc. CA), the results were graphed with raw and normalized data. The specified Ponceau S staining solution band intensities were calculated relative to the band intensities generated from a commercial Ponceau S stain (Amresco).
2.7. Statistical Analysis
Significant differences between samples were calculated using one-way analysis of variance (Anova) (P < 0.05, Sigma Plot 11.0). Errors shown are standard deviation of the mean ± (SEM). Each experiment shown was carried out three independent times and repeated by at least two investigators.
3. Results
Commercially available Ponceau S staining solutions are typically 0.1% Ponceau S (w/v) in 5% (v/v) acetic acid but other formulations such as 0.2 % (w/v) Ponceau S in 3 % (w/v) TCA are available (Table 1). Many companies that do not sell Ponceau S solutions recommend different formulations. Cold Springs Harbor recommends 0.5% (w/v) Ponceau S in 1% (v/v) acetic acid [16], EncorBio advises 0.25% (w/v) Ponceau S in 40% methanol and 15% acetic acid [17], while Abcam suggests 0.02% (w/v) Ponceau S in 0.3% (w/v) TCA and 0.3% (w/v) sulfosalicyclic acid [18]. To further complicate the use of Ponceau S, scientists have also used other compositions of Ponceau S stain including 0.6% (w/v) Ponceau S in 3% (w/v) TCA [19]. The methods recommended to stain and destain membranes with Ponceau S stain is also variable (Table 1).
Table 1.
Concentrations of Ponceau S sold by Manufacturers
| Company | Product Number | Composition of Ponceau S solution | Suggested staining method |
|---|---|---|---|
| Advansta | R-03021 -D5 | Not reported | Incubate the membrane in the ready-to-use AdvanStain Ponceau solution for 5 minutes or less to detect protein bands. The membrane can be destained in minutes by incubating in water [20]. |
| Biotium | 22001 | 0.1% Ponceau S (w/v) and 5% (v/v) acetic acid. | The dye rapidly stains proteins on membranes pink or light red for easy visual inspection of protein transfer. The staining is reversible and compatible with subsequent Western blotting [21]. |
| Cell Signaling Technology | 59803 | Not reported | Incubate membrane in Ponceau S solution for 5-10 minutes at room temperature (RT). Wash the membrane in distilled water (DI) for 1-5 minutes until pink protein bands are visible. Image membrane and then wash in 1X TBST multiple times for 5 minutes at RT until protein bands are no longer visible [22]. |
| G Biosciences | 786-575 | Not reported | Transfer membrane to 5ml Ponceau S stain solution on an orbital shaker for 5 minutes at RT. Rinse membrane with DI water to achieve desired staining, approximately 2-3 washes of 5 minutes each. For protein destaining, wash the membrane with 0.1N NaOH solution for 5 minutes and repeat once. Wash the membrane 2-3 times with DI water for 5 minutes each [23]. |
| Novus Biologicals | NB5225 | 0.1% (w/v) Ponceau S and 5% (v/v) acetic acid | Not given [24]. |
| Pan Reac AppliChem | A2935 | 0.1% (w/v) Ponceau S and 5% (v/v) acetic acid | Wash the membrane briefly in TBST and stain the transfer membrane in staining solution for 5-10 min at RT. Destain in water until the background becomes clear [25]. |
| Rockland | MB-072-0500 | Ponceau S in a specially formulated acetate buffer | Ponceau S stain is designed for rapid (5 min) staining on nitrocellulose or PVDF membranes [26]. |
| Santa Cruz Biotechnology | sc-301558 | 0.1 % (w/v) in 5% (v/v) acetic acid | Rapid (5 min) staining of protein bands on PVDF or nitrocellulose membranes. Staining is reversible by washing the membrane with 0.1 M NaOH for 1 min [27]. |
| SERVA | 33427.01 | 0.2 % (w/v) Ponceau S and 3 % (w/v) TCA | A rapid, reversible stain for the detection of proteins in Western blot experiments. It is easily reversed with repetitive washings in water [28]. |
| Sigma-Aldrich | P 7170 | 0.1% (w/v) Ponceau S and 5% (v/v) acetic acid | Immerse membrane in Ponceau S staining solution for 5 minutes. After proteins have been visualized, rinse the membrane with DI and rapidly immerse in an aqueous solution of 0.1 M NaOH. Then, rinse the membrane with running distilled water for 2-3 minutes [29]. |
3.1. Effect of Ponceau S Staining Time on Ponceau S Staining Intensity
Most protocols suggest that 5 minutes of Ponceau S staining is optimal. We investigated the effect of 0.1% (w/v) Ponceau S and 1% (v/v) acetic acid incubation time on the detection of 4μg and 10μg of cytosolic rat liver lysate (Figure 1). To normalize the Ponceau S staining results we utilized a commercial Ponceau S solution from Amresco. After staining the blots with our different Ponceau S solutions we then destained the blots and restained all blots with the same commercial Ponceau S solution. The stained blots obtained using the different Ponceau S compositions were normalized to the blots obtained using the commercial Ponceau S solution. The Amresco Ponceau S composition is not given by the manufacturer. One minute of staining time was found to be as effective as 10 minutes of staining, suggesting that the commonly proposed 5 minutes of staining is not required. All further experiments were carried out using two minutes of staining time to allow the experimenter enough time to adequately stain and image several images at the same time.
Figure 1:
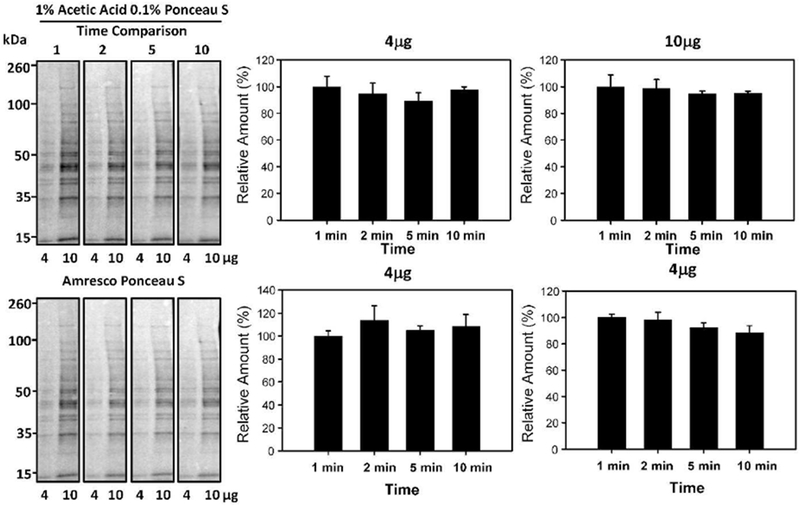
Effect of Ponceau S incubation time on protein staining intensity. Quantification of 4μg and l0μg of proteins stained with 1% (v/v) Acetic Acid and 0.1% (w/v) Ponceau S for 1, 2, 5, or 10 minutes. The lower blots show the same blots destained and then restained with commercial Ponceau S (Amresco). The actual composition of the commercial Ponceau S is not provided by the manufacturer. The lower bar charts show the results obtained (normalized results) when the commercial Ponceau S staining was used to normalize the upper blots containing different Ponceau S compositions.
3.2. Effect of Ponceau S Concentration on Ponceau S Staining Intensity
To determine the effect of Ponceau S concentration on the detection of proteins, nitrocellulose membrane containing different concentrations of cytosolic liver lysates were stained with different Ponceau S concentrations (0.1-0.5% w/v) in 1% acetic acid for 2 minutes each (Figure 2). After 2 minutes of staining, the membranes were briefly washed with ddH2O water for 20 seconds. The rinsed strips were subsequently imaged using the Bio-Rad Chemidoc MP. The images taken were quantified with Image lab 5.1 software. Western blots are usually carried out with total protein loading amounts in the range of 10-20μg. As such, we carried out the Ponceau S staining experiments with total protein concentrations of 4μg and 10μg, which are at the low end of most total protein staining experiments and would require stains that can detect relatively low amounts of total protein. The concentrations of Ponceau S (0.1-0.5% w/v) investigated did not significantly affect the sensitivity of the Ponceau S staining (Figure 2). To determine if concentrations less than 0.1% (w/v) of Ponceau S would also be suitable for staining, experiments using 0.01 and 0.001% (w/v) Ponceau S were carried out (Figure 3). These lower Ponceau S concentrations produced images of statistically similar sensitivity to that of the 0.1% (w/v) Ponceau S. Since most commercial preparations utilize 0.1% (w/v) Ponceau S; these results suggest that commercial stains are at least 100 times more concentrated than necessary for satisfactory results.
Figure 2:
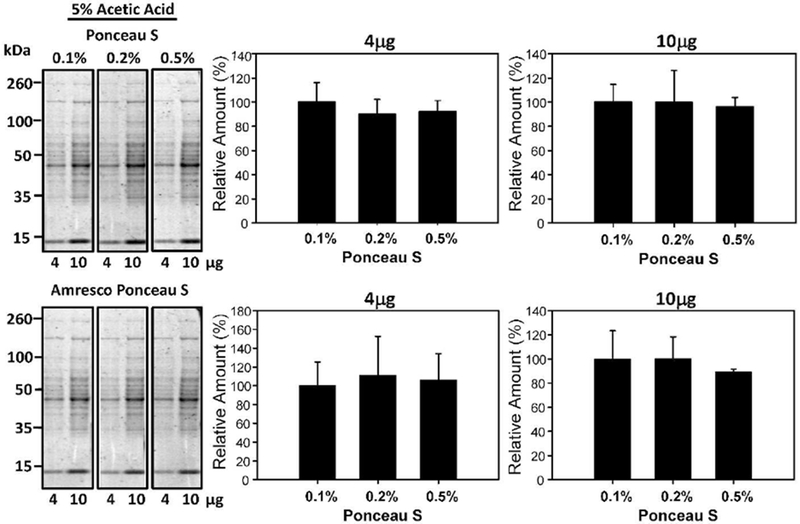
Effect of different Ponceau S concentrations on protein staining intensity. Quantification of 4μg and 10μg of protein stained with 1% (v/v) acetic acid and either 0.1%, 0.2%, or 0.5% (w/v) Ponceau S for 2 minutes. The upper blots show the effect of different Ponceau S concentrations on the relative amount of protein detected, while the lower blots show the same blots destained and then restained with commercial Ponceau S. The lower bar charts show the different Ponceau S concentrations normalized to the commercial Ponceau S stain.
Figure 3:
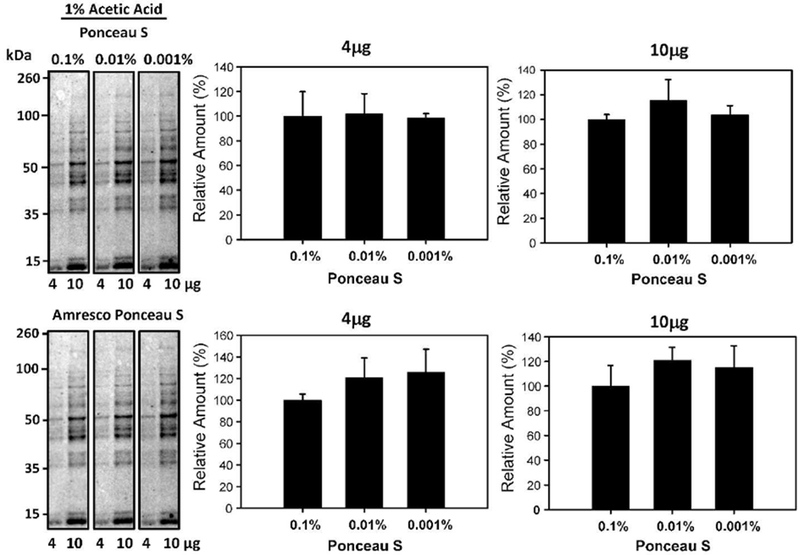
Effect of Ponceau S concentrations on protein staining intensity. Quantification of 4μg and 10μg of protein stained with 1% (v/v) acetic acid and 0.1%, 0.01%, and 0.001% (w/v) Ponceau S for 2 minutes. The lower blots show the same blots destained and then restained with commercial Ponceau S and the lower bar charts show the normalized results.
3.3. Effect of Acetic Acid Concentration on Ponceau S Staining Intensity
Different concentrations of acetic acid have been recommended [16; 17]; therefore, to determine if acetic acid concentrations had any effect on Ponceau S staining intensity, 0.1% (w/v) Ponceau S in 1%, 10%, and 20% (v/v) acetic acid were investigated (Figure 4). The acetic acid concentration did not significantly affect the sensitivity of the Ponceau S staining.
Figure 4:
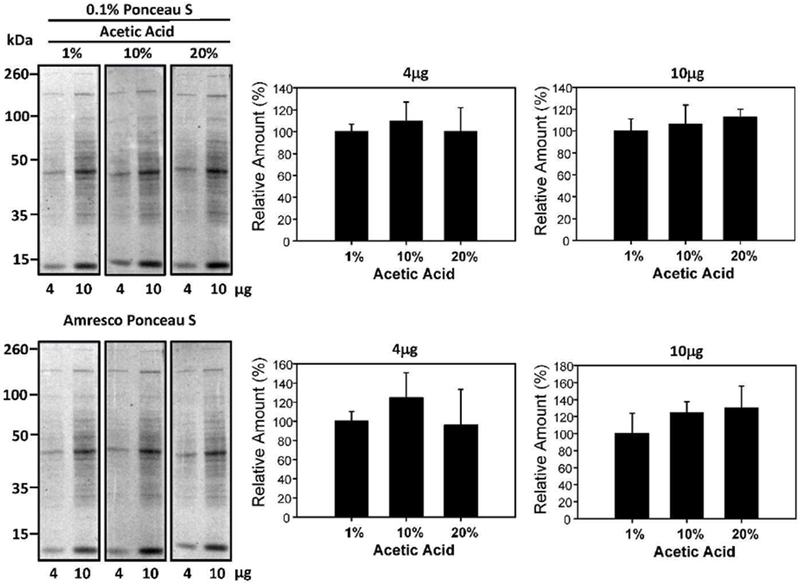
Effect of acetic acid concentrations on protein staining intensity. Quantification of 4μg and 10μg of protein stained with 0.1% (w/v) Ponceau S with 1%, 10%, and 20% (v/v) acetic acid for 2 minutes. The lower blots show the same blots destained and then restained with commercial Ponceau S and the lower bar charts show the normalized results.
3.4. Effect of TCA Concentration on Ponceau S Staining Intensity
Ponceau S solutions with 3% (v/v) TCA have been utilized in the literature [11]. However, it is less common than solutions incorporating acetic acid. To determine if TCA concentration had any effect on Ponceau S staining intensity in relation to the more commonly used acetic acid, 0.1% (w/v) Ponceau S in 1% (v/v) acetic acid, 5% (v/v) acetic acid, and 3% (v/v), TCA were quantified against each other. 4μg and 10μg protein samples were tested through multiple replications and revealed that there was no significant difference in protein band intensity at differing acid types and concentrations. The staining intensity of solutions containing TCA was similar to when acetic acid was used (Figure 5). To determine if the sensitivity of protein detection was affected by changing the concentration of Ponceau S in 3% TCA, 0.1%, 0.2%, and 0.5% (w/v) Ponceau S in 3% TCA was investigated (Figure 6). No differences were detected using different Ponceau S concentrations in 3% TCA.
Figure 5:
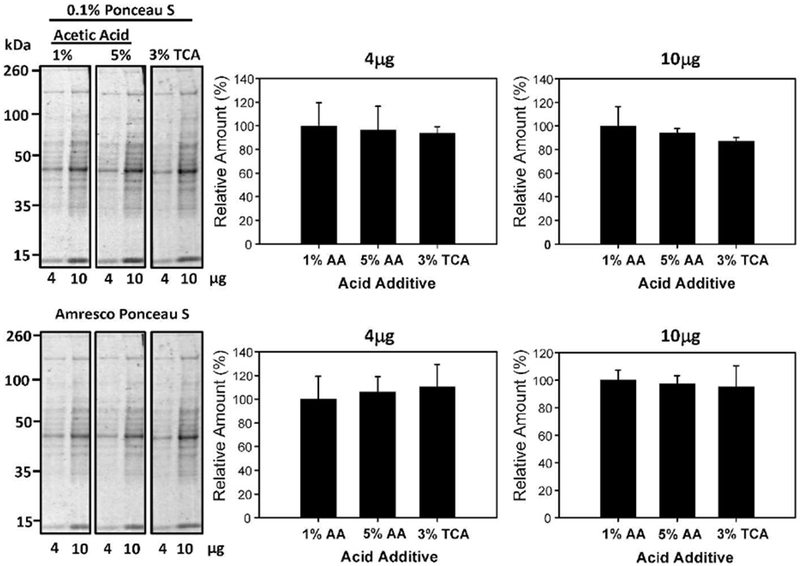
Effect of TCA on Ponceau S protein staining intensity. Quantification of 4μg and 10μg of protein stained with 0.1% (w/v) Ponceau S with either 1% (v/v) acetic acid (AA), 5% (v/v) AA, or 3% (v/v) TCA for 2 minutes. The lower blots show the same blots destained and then restained with commercial Ponceau S and the lower bar charts show the normalized results.
Figure 6:
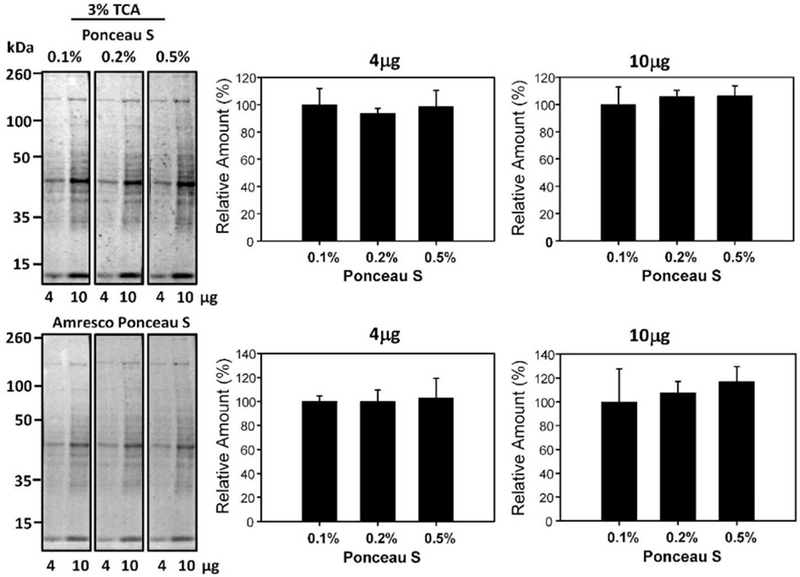
Effect of different Ponceau S concentrations in 3% TCA on protein staining intensity. Quantification of 4μg and 10μg of protein stained with 3% (v/v) TCA with 0.1%, 0.2%, and 0.5% (w/v) Ponceau S for 2 minutes. The lower blots show the same blots destained and then restained with commercial Ponceau S and the lower bar charts show the normalized results.
3.5. Effect of sulfosalicylic acid concentration on Ponceau S staining intensity
A solution 0.02% (w/v) Ponceau S in 0.3% (w/v) TCA and 0.3% (w/v) sulfosalicylic acid was also previously utilized [18]. In experiments to investigate if a combination of TCA and sulfosalicylic acid could enhance the sensitivity of detection of protein bands, staining with 0.1% (w/v) Ponceau S in 1% (v/v) acetic acid was compared to 1% (v/v) acetic acid (AA), 0.02% (w/v) Ponceau S with 0.3% (v/v) TCA and 0.3% (w/v) sulfosalicylic acid, and 0.2% (w/v) Ponceau S with 3% (v/v) TCA and 3% (v/v) sulfosalicylic acid (Figure 7). Our results suggest that the addition of sulfosalicylic acid did not enhance the protein detection. To determine if sulfosalicylic acid in the absence of TCA could enhance sensitivity, 2% (w/v) Ponceau S in 30% (v/v) sulfosalicylic acid was compared against 0.1% (w/v) Ponceau S in 1% (v/v) acetic acid and no difference in sensitivity was observed (Figure 8). A comparison between 0.1% (w/v) Ponceau S in 1% (v/v) acetic acid and 2% (w/v) Ponceau S, 30% (v/v) TCA, and 30% (w/v) sulfosalicylic acid (Figure 8) showed no statistically significant difference for both 4μg and 10μg of sample.
Figure 7:
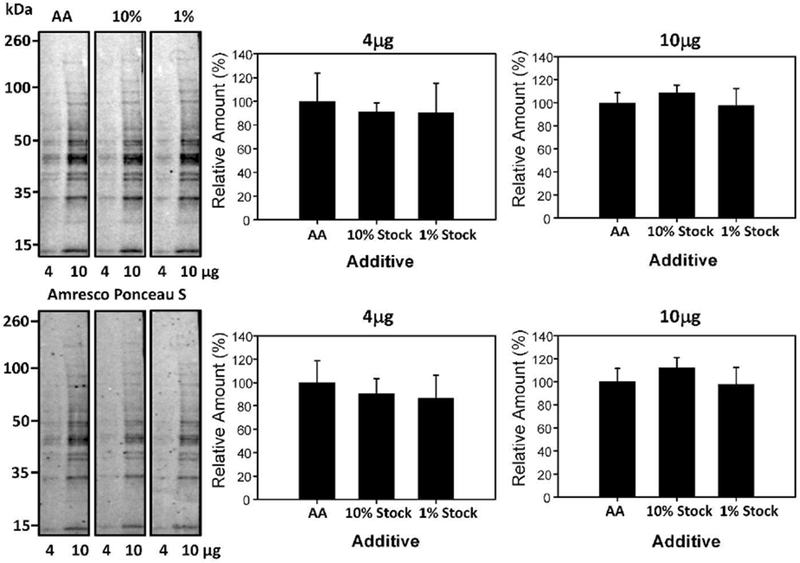
Effect of TCA and sulfosalicylic acid on protein staining intensity. Quantification of 4μg and 10μg of protein stained with 0.1% (w/v) Ponceau S with 1% (v/v) acetic acid (AA), 0.2% (w/v) Ponceau S with 3% (v/v) TCA and 3% (v/v) sulfosalicylic acid (10% stock) and 0.02% (w/v) Ponceau S with 0.3% (v/v) TCA and 0.3% (w/v) sulfosalicylic acid (1% stock) for 2 minutes. The lower blots show the same blots destained and then restained with commercial Ponceau S and the lower bar charts show the normalized results.
Figure 8.
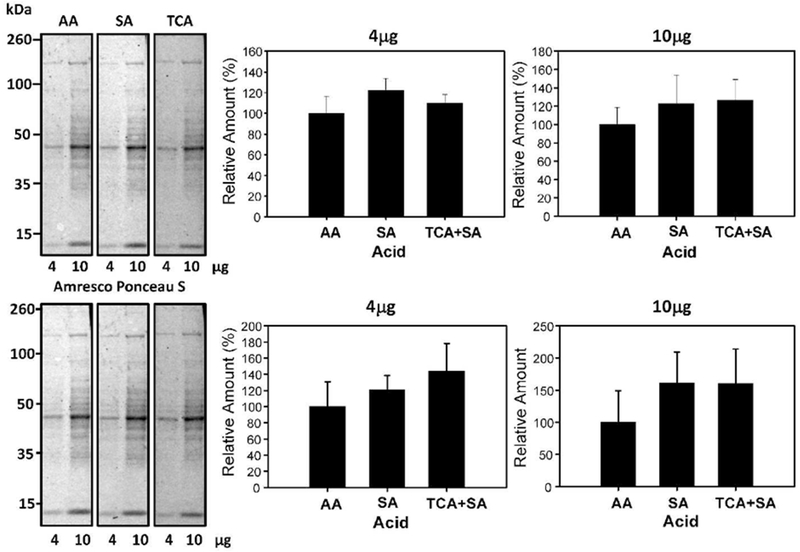
Effect of sulfosalicylic acid on Ponceau S protein staining intensity. Quantification of 4μg and 10μg of protein stained with 0.1% (w/v) Ponceau S with 1% (v/v) acetic acid, 2% (w/v) Ponceau S with 30% (v/v) sulfosalicylic acid, and 2% (w/v) Ponceau S with 30% (v/v) sulfosalicylic acid and 30% (v/v) trichloroacetic acid (TCA) for 2 minutes. The lower blots show the same blots destained and then restained with commercial Ponceau S and the lower bar charts show the normalized results.
To independently validate that 0.1% (w/v) Ponceau S with 1% (v/v) acetic acid was as good as any of the other stains, SDS-PAGE was carried out using 75ng to 2μg of purified bovine serum albumin (BSA) and subsequent protein transfer to nitrocellulose membrane. Staining of these membranes with three different Ponceau S stains showed that the detection sensitivity of Ponceau S for BSA was the same for all stains (Figure 9A). The detection sensitivity for BSA was 125ng which is close to the previously published detection sensitivity of 200ng/protein band for Ponceau S [30]. To determine if Ponceaus S staining affected the sensitivity of detection of the protein of interest, we carried out Western blots on blots which were stained with Ponceau S stain compared to blots that were not stained with Ponceau S (Figure 9B). No difference in Western blotting sensitivity was observed between the blots that were Ponceau S stained and blots that were not stained with Ponceau S. We also performed Western blots to determine if different acids affect the sensitivity of Western blots (Figure 9C). 5% acetic acid and 30% SA did not affect the Western blotting sensitivity when compared to unstained membranes.
Figure 9.
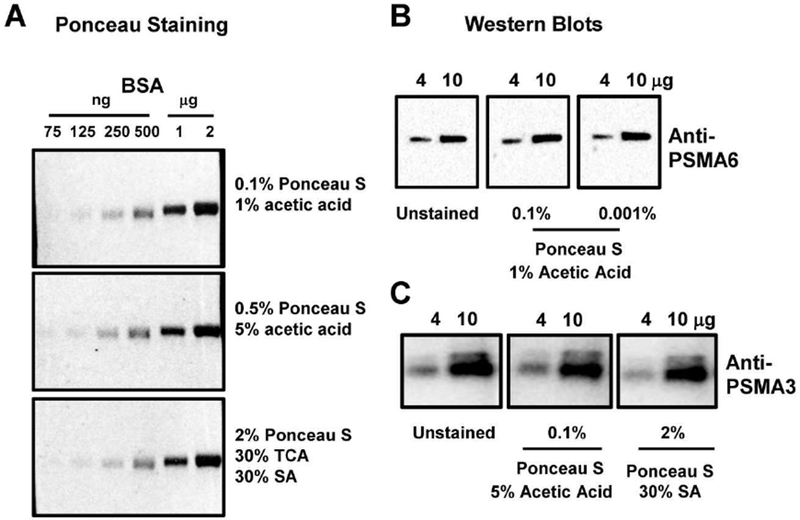
Effect of Ponceau S stain on BSA detection and Western blotting Sensitivity. A) Quantification of 4μg and 10μg of protein stained with 0.1% (w/v) Ponceau S with 1% (v/v) acetic acid, 2% (w/v) Ponceau S with 30% (v/v) sulfosalicylic acid (SA), and 2% (w/v) Ponceau S with 30% (v/v) SA and 30% (v/v) trichloroacetic acid (TCA) for 2 minutes. B) Western blots of membranes stained with Ponceau S (0.01% and 0.001% in 1% acetic acid) and membranes not stained with Ponceau S. Western blots were carried out as described in the methods using anti-PSMA6 antibody. C) Western blots of membranes stained with 0.01% Ponceau S in 5% acetic acid, 2% Ponceau S in 30% SA and membranes not stained with Ponceau S. Western blots were carried out as described in the methods using anti-PSMA3 antibody.
4. Discussion
Ponceau S is likely to be one of the most commonly used stains for normalizing Western Blots in the near future. As such, understanding which Ponceau S stain is optimal for total protein detection is needed. Our initial experiments were carried out to determine if we can increase the sensitivity of the Ponceau S stain. After trying several additives including polyvinylpyrrolidone (PVP) and glycerol, we found no significant increase in the sensitivity of the Ponceau S stains (data not shown). Briefly, PVP (0.1-1% (w/v)) or 1-5% (v/v) glycerol was added to 0.1% Ponceau S in 1% acetic acid and the protein staining intensity was found to be similar to the staining intensity after exposure to 0.1% Ponceau S in 1% acetic acid.
To determine which current Ponceau S stain had the highest sensitivity for detecting proteins, we searched research papers, online recommendations, and company websites for Ponceau S stain recipes. We then systematically investigated the different Ponceau S stains. We were unable to find an optimal Ponceau S stain as all the stains worked equivalently. Hence, our findings suggest that the large variations in Ponceau S stains with different concentrations of Ponceau S and different concentrations of acids as well as different combinations of acids are unnecessary.
Surprisingly, the lowest concentration of Ponceau S commonly used in the literature (0.1% Ponceau S) showed similar protein detection sensitivity as 0.01 and 0.001% (w/v) Ponceau S stains suggesting that Ponceau S is currently being used at significantly higher concentrations than needed. While 0.001% (w/v) Ponceau S was as sensitive as 0.1% (w/v) Ponceau S, we suggest the use of 0.01% (w/v) Ponceau S since many labs reuse Ponceau S stains and accurately preparing small amounts of 0.001% (w/v) Ponceau S stain is sometimes difficult.
The lower percentage of Ponceau S staining solutions are better for the environment and for general safety. Though Ponceau S is considered non-toxic to humans in small concentrations, the effect of being exposed to larger amounts of Ponceau S over time is unknown. Using less of any compound, even non-toxic, is good for the environment. The use of 0.01% (w/v) Ponceau S in 1% (v/v) acetic acid instead of the commonly used Ponceau S stains will also reduce the cost of total protein staining. The Fisher Scientific list price of 10g of Ponceau S is $55.50, and the list price of 500ml of glacial acetic acid is $52.66 for 500ml. Based on these prices (not including the cost of distilled water) it would cost less than 20 cents US to make 100ml of 0.01% (w/v) Ponceau S in 1% (v/v) acetic acid.
5. Conclusions
A standard Ponceau S staining solution containing less Ponceau S than is commonly employed should be utilized by the scientific community. Ponceau S stain did not affect Western blotting sensitivity. Our research suggests a standard concentration of 0.01% (w/v) Ponceau S in 1% (v/v) acetic acid used for 2 mins staining could be adopted by the scientific community to increase the rigor and reproducibility of Western blotting normalization.
Highlights.
Total protein staining offers several advantages for Western blotting normalization
Ponceau S is the most common total protein stain for Western blotting normalization
Most laboratories are using excessive amounts of Ponceau S and different acids
0.01% (w/v) Ponceau S in 1% acetic acid is as effective as all other formulations
Only 1-2 minutes of staining is required for total protein staining with Ponceau S
Acknowledgments
Funding
This work was partly funded by AHA 16GRNT31350040 and NIH 5P42ES004699.
Footnotes
Publisher's Disclaimer: This is a PDF file of an unedited manuscript that has been accepted for publication. As a service to our customers we are providing this early version of the manuscript. The manuscript will undergo copyediting, typesetting, and review of the resulting proof before it is published in its final citable form. Please note that during the production process errors may be discovered which could affect the content, and all legal disclaimers that apply to the journal pertain.
Conflict of interest
The authors disclose no conflict of interest.
References
- [1].Ghosh R, Gilda JE, and Gomes AV, The necessity of and strategies for improving confidence in the accuracy of western blots. Expert Rev Proteomics 11 (2014) 549–60. [DOI] [PMC free article] [PubMed] [Google Scholar]
- [2].Mishra M, Tiwari S, and Gomes AV, Protein purification and analysis: next generation Western blotting techniques. Expert Rev Proteomics 14 (2017) 1037–1053. [DOI] [PMC free article] [PubMed] [Google Scholar]
- [3].Gilda JE, Ghosh R, Cheah JX, West TM, Bodine SC, and Gomes AV, Western Blotting Inaccuracies with Unverified Antibodies: Need for a Western Blotting Minimal Reporting Standard (WBMRS). PLoS One 10 (2015) e0135392. [DOI] [PMC free article] [PubMed] [Google Scholar]
- [4].Thellin O, Zorzi W, Lakaye B, De Borman B, Coumans B, Hennen G, Grisar T, Igout A, and Heinen E, Housekeeping genes as internal standards: use and limits. Journal of biotechnology 75 (1999) 291–5. [DOI] [PubMed] [Google Scholar]
- [5].Moritz CP, Tubulin or Not Tubulin: Heading Toward Total Protein Staining as Loading Control in Western Blots. Proteomics 17 (2017). 17, 1600189. [DOI] [PubMed] [Google Scholar]
- [6].Barber RD, Harmer DW, Coleman RA, and Clark BJ, GAPDH as a housekeeping gene: analysis of GAPDH mRNA expression in a panel of 72 human tissues. Physiol Genomics 21 (2005) 389–95. [DOI] [PubMed] [Google Scholar]
- [7].Zhu J, He F, Song S, Wang J, and Yu J, How many human genes can be defined as housekeeping with current expression data? BMC Genomics 9 (2008) 172. [DOI] [PMC free article] [PubMed] [Google Scholar]
- [8].Gilda JE, and Gomes AV, Stain-Free total protein staining is a superior loading control to beta-actin for Western blots. Anal Biochem 440 (2013) 186–8. [DOI] [PMC free article] [PubMed] [Google Scholar]
- [9].Brooks HL, and Lindsey ML, Guidelines for authors and reviewers on antibody use in physiology studies. American journal of physiology. Heart and circulatory physiology 314 (2018) H724–H732. [DOI] [PMC free article] [PubMed] [Google Scholar]
- [10].Gilda JE, and Gomes AV, Western blotting using in-gel protein labeling as a normalization control: stain-free technology. Methods Mol Biol 1295 (2015) 381–91. [DOI] [PubMed] [Google Scholar]
- [11].Ponceau S solution (CAS 6226-79-5 (solid)) Santa Cruz Biotechnology, 2019. https://www.scbt.com/scbt/product/ponceau-s-solution-6226-79-5-solid
- [12].Stochaj WR, Berkelman T, and Laird N, Staining membrane-bound proteins with ponceau s. CSH Protoc 2006 (2006). doi: 10.1101/pdb.prot4543 [DOI] [PubMed] [Google Scholar]
- [13].Salinovich O, and Montelaro RC, Reversible staining and peptide mapping of proteins transferred to nitrocellulose after separation by sodium dodecylsulfate-polyacrylamide gel electrophoresis. Anal Biochem 156 (1986) 341–7. [DOI] [PubMed] [Google Scholar]
- [14].Al-Amoudi MS, Salman M, Al-Majthoub MM et al. Res Chem Intermed (2015) 41: 3089 10.1007/s11164-013-1417-4. [DOI] [Google Scholar]
- [15].Fosang AJ, and Colbran RJ, Transparency Is the Key to Quality. The Journal of biological chemistry 290 (2015) 29692–4. [DOI] [PMC free article] [PubMed] [Google Scholar]
- [16].Ponceau S staining solution, Cold Springs Harbor Protocols, 2019. http://cshprotocols.cshlp.org/content/2007/4/pdb.rec10772.full?text_only=true.
- [17].Western Blotting, EnCor Biotechnology Inc., 2019. http://www.encorbio.com/protocols/blotting.htm/ Accessed 02/10/2019. [Google Scholar]
- [18].Transfer and staining of proteins in western blot. Abcam, 2019. https://www.abcam.com/protocols/transfer-and-staining-of-proteins-in-western-blot Accessed 02/10/2019. [Google Scholar]
- [19].Siegert M, Schützler G, and Jarofke R, The effect of various stains on quantitative agarose-gel electrophoresis: Evaluation of the results with the aid of an analog computer. Clinica Chimica Acta 73 (1976) 423–430. [DOI] [PubMed] [Google Scholar]
- [20].AdvanStain Ponceau, Advansta, Inc., 2019. https://advansta.com/products/protein-stain-AdvanStain-Ponceau/ Accessed 02/10/2019. [Google Scholar]
- [21].Ponceau S solution, Biotium, 2019. https://biotium.com/product/ponceau-s-solution/ Accessed 02/10/2019.
- [22].Ponceau S solution, Cell Signaling Technology, 2019. https://media.cellsignal.com/pdf/59803.pdf Accessed 02/10/2019.
- [23].Ponceau S Stain, G-BIOSCIENCES, 2019. https://www.gbiosciences.com/image/pdfs/protocol/786-575_protocol.pdf Accessed 02/10/2019.
- [24].Ponceau S Staining solution, Novas Biologicals. 2019. https://www.novusbio.com/products/ponceau-s-staining-solution_nb5225 Accessed 02/10/2019.
- [25].Ponceau S Solution, Pan Reac AppliChem 2019. https://www.itwreagents.com/download_file/product_infos/A2935/en/A2935_en.pdf Accessed 02/10/2019.
- [26].Ponceau S solution, Rockland. 2019. https://rockland-inc.com/Report.aspx?id=50094 Accessed 02/10/2019.
- [27].Ponceau S solution, Santa Cruz Biotechnology. 2019. https://www.scbt.com/scbt/product/ponceau-s-solution-6226-79-5-solid Accessed 02/10/2019.
- [28].Ponceau S solution for electrophoresis (0.2 %), SERVA, 2019. https://www.serva.de/enDE/ProductDetails/787_84_33427_Ponceau_S_Solution_for_Electrophoresis_0_2_percent_212_84.html Accessed 02/10/2019. [Google Scholar]
- [29].Ponceau S solution. Sigma-Aldrich. 2019. https://www.sigmaaldrich.com/catalog/product/sial/p7170?lang=en®ion=US&gclid=EAIaIQobChMI1PaRt6f74AIVix6tBh245Ao5EAAYASAAEgKquPD_BwE Accessed 02/10/2019.
- [30].Goldman A, Harper S, and Speicher DW, Detection of Proteins on Blot Membranes. Curr Protoc Protein Sci 86 (2016) 10 8 1–10 8 11. [DOI] [PMC free article] [PubMed] [Google Scholar]


