Abstract
The interplay between an evolving cancer and the dynamic immune-microenvironment remains unclear. Here, we analyze 258 regions from 88 early-stage untreated non-small cell lung cancers (NSCLCs) using RNAseq and pathology tumor infiltrating lymphocyte estimates. The immune-microenvironment was variable both between and within patients’ tumors. Diverse immune selection pressures were associated with different mechanisms of neoantigen presentation dysfunction restricted to distinct microenvironments. Sparsely infiltrated tumors exhibited evidence for historical immunoediting, with a waning of neoantigen-editing during tumor evolution, or copy number loss of historically clonal neoantigens. Immune-infiltrated tumor regions exhibited ongoing immunoediting, with either HLA LOH or depletion of expressed neoantigens. Promoter hypermethylation of genes harboring neoantigens was identified as an epigenetic mechanism of immunoediting. Our results suggest the immune-microenvironment exerts a strong selection pressure in early stage, untreated NSCLCs, producing multiple routes to immune evasion, which are clinically relevant, forecasting poor disease-free survival in multivariate analysis.
Introduction
Anti-tumor immune responses require the functional presentation of tumor antigens and a microenvironment replete with competent immune effectors 1,2. However, the extent to which an active immune system sculpts tumor genome evolution has not been well characterized. Although associations between immune infiltration and tumor clonal diversity have been observed in certain contexts 3,4, whether the immune system acts as a dominant selective force in early stage untreated cancer is unclear. Furthermore, transcriptomic heterogeneity might confound conclusions drawn from sampling a single tumor sample, leading to inaccurate interpretations of mechanisms of immune evasion.
To determine immune infiltration in untreated NSCLC, assess how it varies between and within tumors, and characterize immune evasion mechanisms and their associations with clinical outcome, we integrated 164 RNAseq samples from 64 tumors and 234 tumor infiltrating lymphocyte (TIL) pathological estimates from 83 tumors for a combined cohort of 258 tumor regions from 88 prospectively acquired tumors within the TRACERx 100 cohort 5. We explore how selection pressures from a diverse tumor microenvironment impact upon neoantigen presentation, as well as the tumor-specific mechanisms leading to immune escape, and their clinical impact.
Results
Heterogeneity of immune infiltration
To estimate immune infiltration in the multi-region NSCLC TRACERx RNAseq cohort, we benchmarked published in silico immune deconvolution tools (Methods). Compared to other transcriptomic approaches 6–11, the Danaher immune signature optimally estimated immune infiltrates in NSCLC (Extended Data Fig. 1).
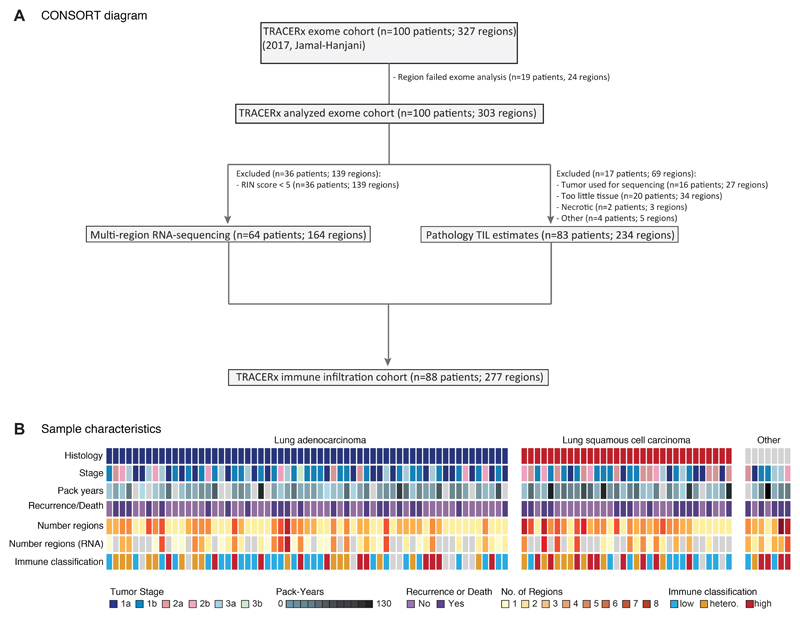
Using this approach, RNAseq-derived infiltrating immune cell populations were estimated for the 164 tumor regions from 64 TRACERx 100 cohort patients 5, for which there was RNA of sufficient quality (Extended Data Fig. 2A-B, Table S1).
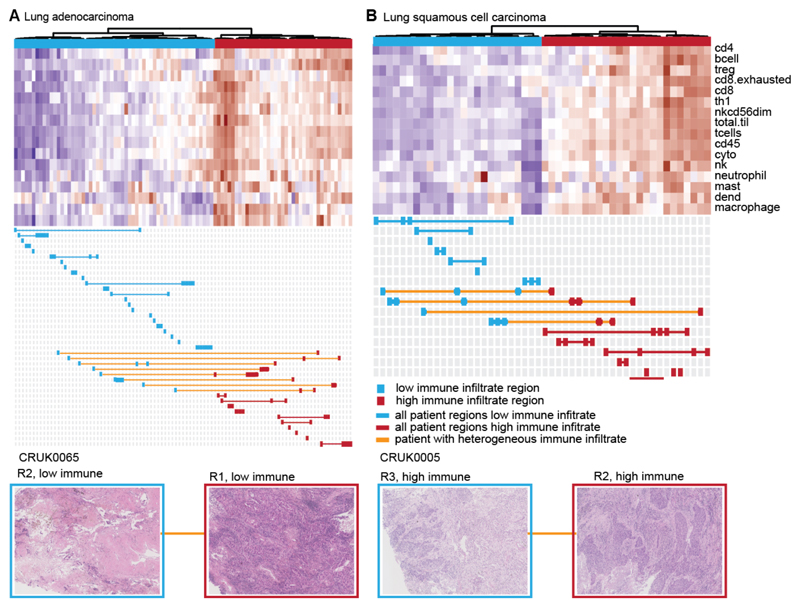
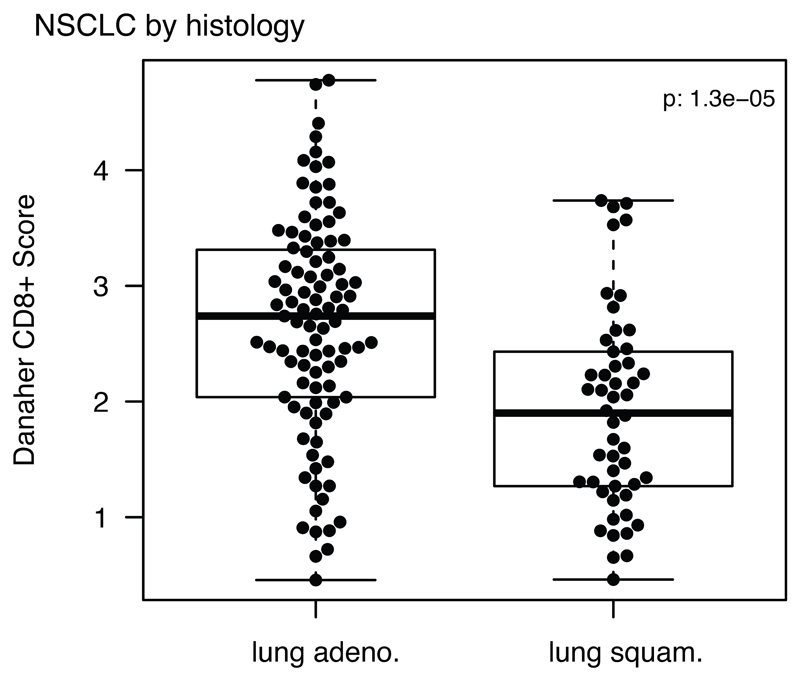
A wide range of immune-infiltration was observed between and within histologies (Extended Data Fig. 3), as well as between separate regions from the same tumor. Unsupervised hierarchical clustering revealed two distinct immune clusters, corresponding to high and low levels of immune infiltration, for each histology. Individual tumor regions were stratified as either having high or low immune infiltrate (Figure 1).
Figure 1. Heterogeneity of immune infiltration in NSCLC.
(A-B) TRACERx regions from lung adenocarcinoma (A) and lung squamous cell carcinoma (B) are shown, clustered by the level of estimated immune infiltrate. Each row represents an immune cell population, as estimated by the Danaher method. Immune populations are: B cells, CD4+ T-cells, CD8+ T-cells, exhausted CD8+ T-cells, helper T-cells, regulatory T-cells, CD45+ cells, NK cells, NK CD56- cells, dendritic cells, mast cells, macrophages, neutrophils, cytotoxic cells, total T-cells, and total TIL score. Each column represents a tumor region. Regions classified as having low immune infiltration are shown in blue, whereas regions classified as having high immune infiltration are shown in red. If all regions from a patient’s tumor are classified as low immune, that patient is indicated in blue. If all regions from a patient’s tumor are classified as high immune, that patient is indicated in red. Patients with tumors containing heterogeneous immune infiltration are indicated in orange. Below each heatmap, example pathology images from heterogeneous tumors are shown to display a region of high immune infiltration and a region of low immune infiltration from the same tumor.
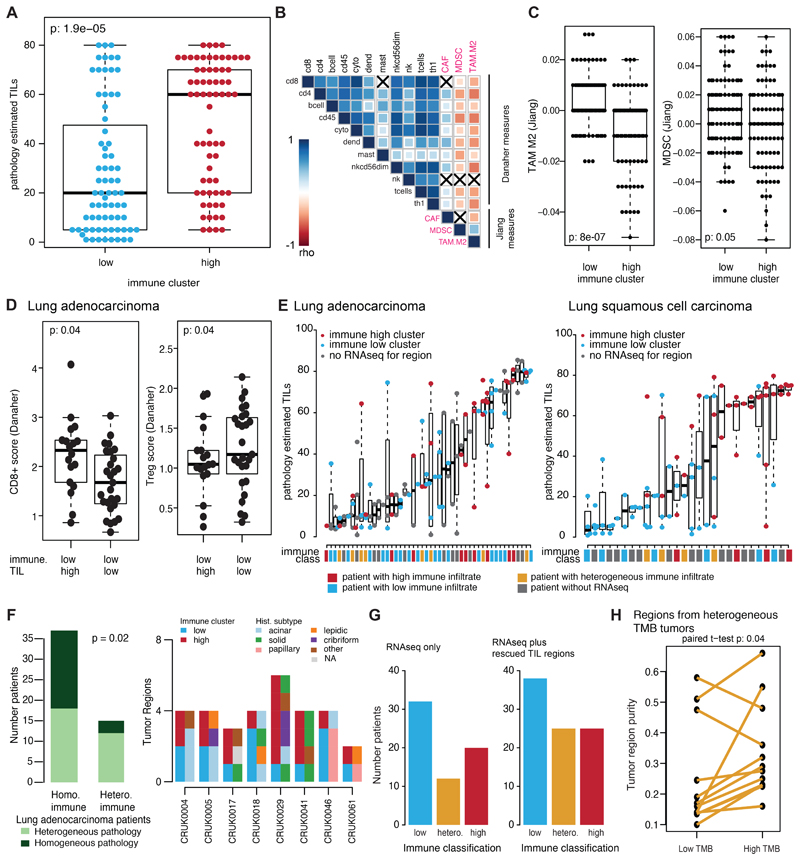
Validating our clustering approach, immune-high tumor regions contained greater pathology estimates of TIL infiltrate compared to immune-low regions (p=3e-05) (Extended Data Fig. 4A). Due to the strong correlation observed with pathology TIL estimates (Extended Data Fig. 1E), we also used pathology estimated TILs to group tumor regions without RNAseq (Extended Data Fig. 4B-C, Methods). The predicted abundance of myeloid-derived suppressor cells and tumor associated M2 macrophages 12 negatively correlated with the immune activating cell subsets (Extended Data Fig. 4D-E), indicating that immunosuppressive cells may influence the immune microenvironment. A small number (11%) of mostly lung adenocarcinoma cases had pathology TIL estimates that were not reflected by the assigned immune cluster potentially reflecting heterogeneity of sampling due to variation from the mirrored tissue samples used to score TILs and extract RNA.
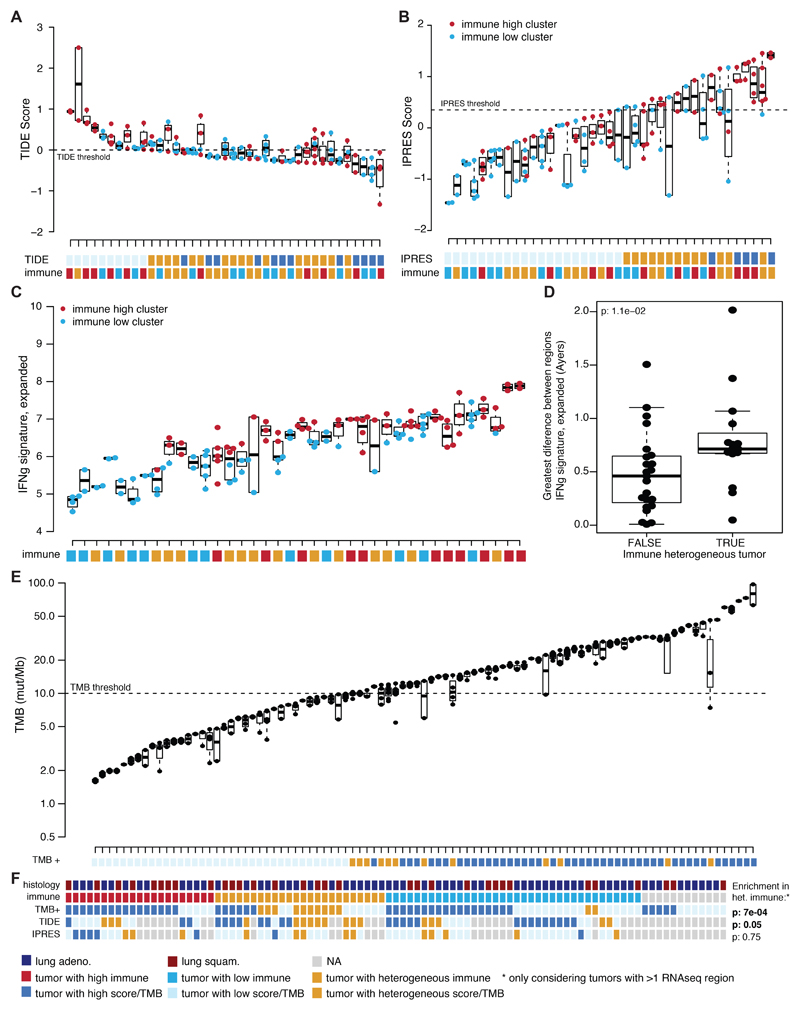
Overall, while 63 patients had tumors with consistently low (38 tumors, 43%) or high (25 tumors, 31%) immune infiltration, 25 patients had tumors with disparate immune infiltration between regions (31%) (Extended Data Fig. 4C). Intratumor heterogeneity was also found to confound genomic and transcriptomic biomarkers for the prediction of response to immune checkpoint blockade. For example, the classifier “TIDE” 12 was heterogeneous in 17/42 tumors (Extended Data Fig. 5A) and heterogeneously infiltrated tumors from our analysis tended to exhibit a heterogeneous TIDE signature (p=0.05) (Extended Data Fig. 5A). Likewise, a transcriptomic signature predicting innate resistance to PD-1 immune checkpoint blockade (IPRES) 13 and an IFN-signaling score 14 were also heterogeneous (Extended Data Fig. 5B-D).
In a recent prospective study, high tumor mutation burden (TMB) (>10 mutations/megabase) associated with improved immunotherapy response 15. 12/57 NSCLC tumors with high TMB had at least one tumor region containing a low TMB (Extended Data Fig. 5E). Heterogeneously infiltrated tumors were also more likely to exhibit heterogeneous TMB (p=7e-04) (Extended Data Fig. 5F). Among tumors with heterogeneous TMB, the regions with low TMB had significantly lower tumor purity than regions with high TMB, indicating the importance of considering tumor stromal content as a confounding factor (paired t-test p=0.04) (Extended Data Fig. 4F).
Interaction between immune infiltration and tumor evolution
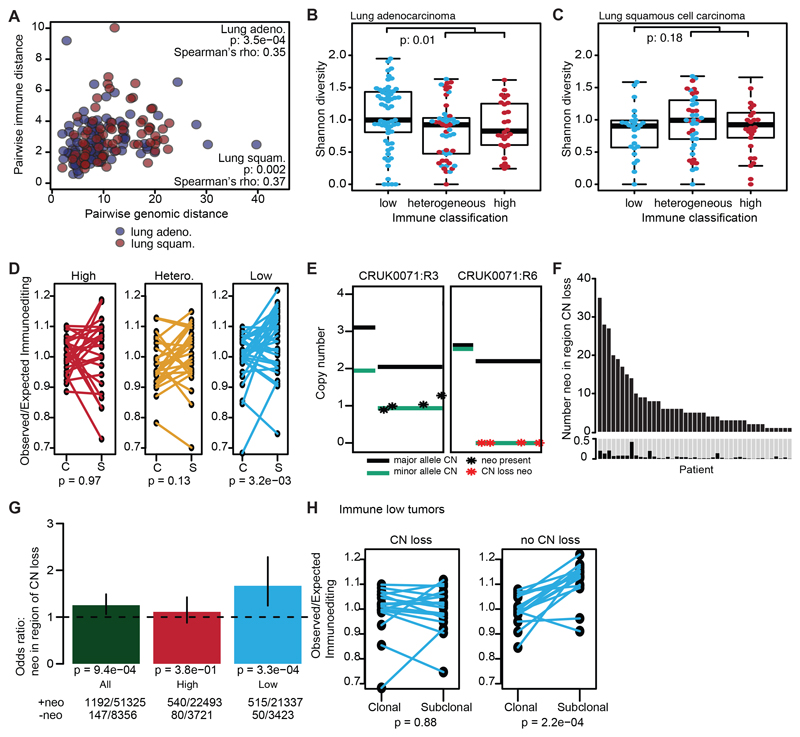
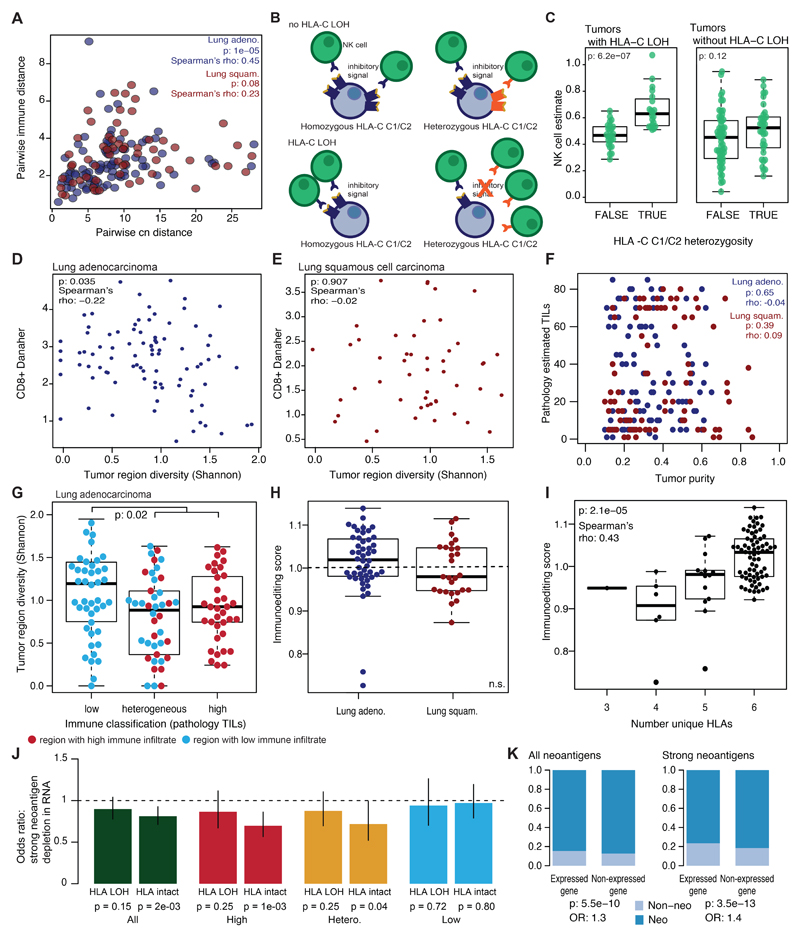
To explore the relationship between tumor genomic features and the immune microenvironment, a distance measure in both genomic and immune space was calculated for all pairwise combinations of tumor regions from the same tumor (Methods). We observed a significant correlation between the two pairwise distance measures (Figure 2A; lung adeno.: p=3.5e-04, lung squam.: p=2e-03). A similar relationship was observed when the pairwise immune and copy number alteration distance was compared, reaching statistical significance among the lung adenocarcinoma cohort (Extended Data Fig. 6A). These results support an interplay between the immune and cancer genomic landscape.
Figure 2. Immune editing at the DNA level.
(A) Pairwise genomic and immune distances between every two tumor regions from the same patient are compared (lung adeno: p=3.5e-04, n=217 lung squam: p=0.002, n=186). (B-C) The Shannon diversity index for each tumor region is shown grouped by immune classification. Lung adenocarcinomas (n=159) (B) and lung squamous cell carcinomas (n=103) (C) are shown. Minima and maxima indicated by extreme points of boxplot. Median indicated by thick horizontal line. First and third quartiles indicated by box edges. A two-sided Wilcoxon rank-sum test is used. (D) The change in the observed/expected immunoediting score from clonal (C) to subclonal (S) is shown for each immune classification (high, n=24; hetero., n=25; low, n=33). A two-sided paired t-test is used. (E) Example of historically clonal neoantigens loss by subclonal copy number event. Neoantigens present in CRUK0071:R3 on one copy are shown in one panel (black). These neoantigens are lost in CRUK0071:R6 (red). (F) The number of historically clonal neoantigens on a region of copy number loss are shown per tumor. Below shows the proportion of clonal neoantigens lost subclonally through a copy number event. (G) The odds ratio and 95% CI of copy number neoantigen depletion is shown, calculated with Fisher’s exact test. Values >1 indicate neoantigens are more likely to be in regions of subclonal copy number loss as compared to non-synonymous mutations that are not neoantigens. Tumor regions are classified by immune cluster. (H) The change in immunoediting score is shown for immune low tumors by whether any neoantigens are subclonally lost through copy number events (CN-loss, n=17; no-CN-loss, n=16). A two-sided paired t-test is used. No corrections were made for multiple comparisons.
To further explore this interplay, we considered the relationship between the clonal structure of each tumor region and its immune infiltrate. RNAseq-estimated CD8+ T-cell infiltration was compared to the within region subclonal diversity (Shannon entropy; Methods). A significant negative correlation was observed in lung adenocarcinoma but not squamous cell carcinoma; regions with high CD8+ T-cell infiltration had lower subclonal diversity (lung adeno.: p=0.035, rho=-0.22; lung squam.: p=0.91, rho=-0.02) (Extended Data Fig. 6B-C). Lung adenocarcinoma regions from tumors with consistently low levels of immune infiltration exhibited greater subclonal diversity compared to those from tumors with high or heterogeneous immune infiltration (Figure 2B-C; lung adeno.: p=0.01). When pathology estimated TILs (which did not correlate with tumor purity; Extended Data Fig. 6D) were used to stratify patients, a reduction in tumor diversity was again observed in regions with high/heterogeneous TIL (Extended Data Fig. 6E; p=0.02).
Immune editing in response to an active immune microenvironment
If T-cell mediated immune surveillance of neoantigens influences cancer genome evolution, one would predict to observe evidence for neoantigen depletion in tumors and/or disruption to antigen presenting machinery 16. Conceivably, neoantigen depletion may occur at the DNA level through events such as copy number loss, at the RNA level through suppression of transcripts harboring neoantigens, at the epigenetic level through silencing of the genomic segments encoding neoantigens, or through post-translational mechanisms. Alternatively, tumor subclones expressing neoantigens may be preferentially eliminated by the immune system resulting in purifying selection of subclones harboring them.
To investigate neoantigen depletion, we predicted neoantigens and their clonal status. Neoantigens were peptides with a predicted binding affinity <500nM or rank percentage score <2% and strong neoantigens had a predicted binding affinity <50nM or rank percentage score <0.5% 17 (Methods). We used a published method to quantify the extent of immunoediting in each tumor sample 16. This method compares the observed to expected number of neoantigens present in a tumor, such that a score <1 suggests immunoediting has occurred. While no significant difference in observed/expected neoantigen occurred between lung adenocarcinomas and lung squamous cell carcinomas (Extended Data Fig. 6F), we noted this score depends on the number of patient germline heterozygous HLA alleles (p=2.1e-05, rho=0.43) (Extended Data Fig. 6G) since fewer unique HLA types will decrease the number of observed neoantigens. To mitigate this, we investigated whether this measure changed during tumor evolution, from clonal to subclonal events within each tumor. Among low infiltrate tumors, a decrease in immunoediting (increase in observed/expected neoantigens) was noted from clonal to subclonal mutations (p=8.8e-03, paired t-test) (Figure 2D), possibly reflecting an ancestral immune-active microenvironment which has subsequently become cold.
Neoantigen depletion may also occur at the DNA level through copy number loss (Figure 2E) 18. Across this cohort, 43/88 tumors showed evidence for >1 historically clonal neoantigen being subclonally lost due to subclonal copy number events (Figure 2F; range 0-42% clonal neoantigens).
To determine if the elimination of historically clonal neoantigens through copy number loss occurred more frequently than expected by chance, we compared neoantigens with non-neoantigenic non-synonymous mutations. In tumor regions with low immune infiltration non-synonymous mutations predicted to be neoantigens, were more likely to occur on genomic segments subject to subclonal copy number loss as compared to their non-neoantigenic counterparts (p=1.2e-04) (Figure 2G). In low infiltration tumors, reduced immunoediting of subclones was observed more frequently in tumors without evidence of neoantigen copy-number loss, supporting its role in subclonal immunoediting (p=0.88 vs. p=2.2e-04) (Figure 2H).
Repression of neoantigenic transcripts
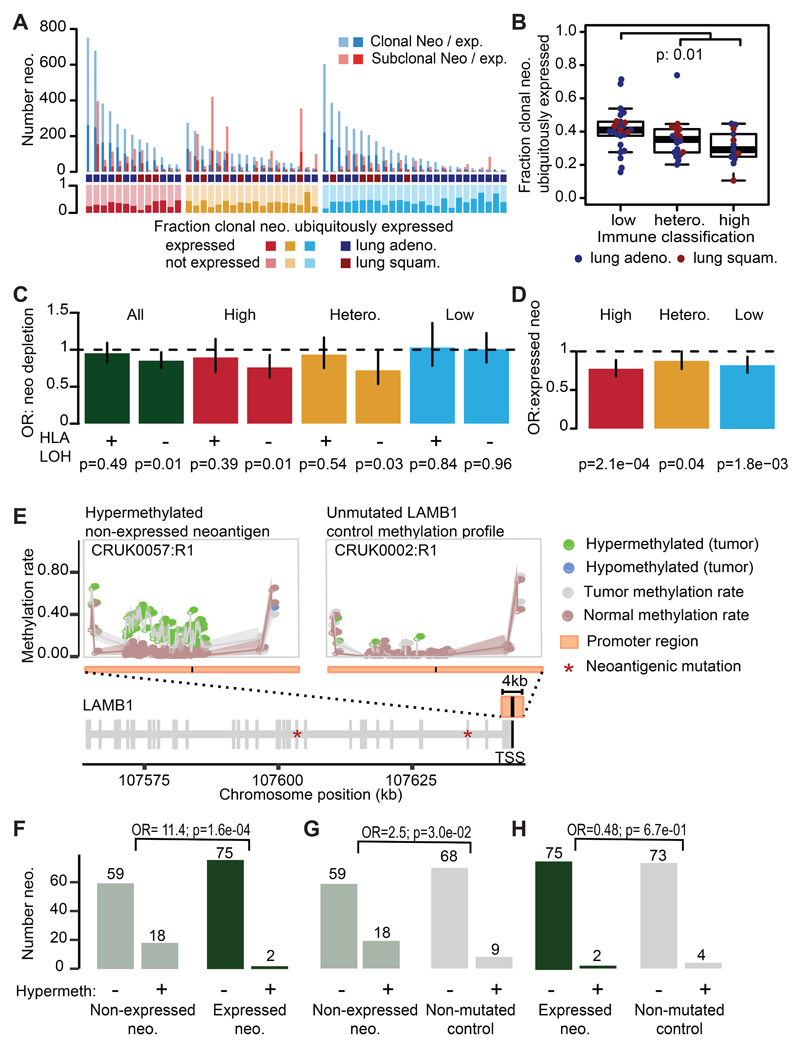
To investigate alternative neoantigen depletion mechanisms, we determined whether each neoantigen was identified at the transcript-level. Overall only 33% of clonal neoantigens were expressed in every tumor region and a significantly lower proportion of ubiquitously expressed clonal neoantigens among immune high (median: 29%) or heterogeneous (median: 35%) tumors as compared to immune low (median: 41%) tumors was observed (Figure 3A-B) (p=1e-02). To further investigate if down-regulation of neoantigenic transcripts reflects selection pressure, we considered whether neoantigens were preferentially subject to reduction in expression compared to non-neoantigens, an approach not confounded by the influence of tumor purity.
Figure 3. Transcriptional neoantigen depletion.
(A) The patient-level number of clonal and subclonal expressed neoantigens is shown. The fraction of clonal neoantigens that are ubiquitously detected is plotted below. The immune class is provided as high (red), low (blue), or heterogeneous (orange). (B) The fraction of clonal neoantigens that are ubiquitously detected in every region is plotted by immune classification of the tumor (n=63). Minima and maxima indicated by extreme points of boxplot. Median indicated by thick horizontal line. First and third quartiles indicated by box edges. A two-sided Wilcoxon rank-sum test is used. (C) The odds ratio and 95% CI of transcriptional neoantigen depletion is shown, calculated with Fisher’s exact test. Values <1 indicate that putative neoantigens are less likely to be expressed as compared to non-synonymous mutations that are not putative neoantigens. Tumors are plotted by HLA LOH status and immune classification. (D) The odds ratio and 95% CI of a neoantigen occurring in a gene that is consistently expressed among TCGA NSCLC tumors is shown, calculated with Fisher’s exact test. (E) CpG-methylation patterns across the LAMB1 promoter in tumor samples CRUK0057:R1 and CRUK0002:R1 and their matched normals. The locus encodes two non-expressed neoantigens and exhibits hypermethylation in CRUK0057:R1. The purity/ploidy-matched unmutated control sample CRUK0002:R1 shows no differential methylation. (F-H) Numbers of (non)-hypermethylated gene promoters for (F) expressed vs. non-expressed neoantigens, (G) non-expressed neoantigens vs. the same genes in purity/ploidy-matched controls and (H) non-expressed neoantigens vs. the same genes in purity/ploidy-matched controls. Odds ratios (OR) and p-values (χ2-test) are shown for each comparison. No corrections were made for multiple comparisons.
Among tumors with intact HLA alleles, significant reduction of expressed neoantigens compared to non-neoantigenic non-synonymous mutations was observed (Figure 3C; p=0.01). Moreover, when tumors were divided by immune classification, only immune high and heterogeneous tumors with intact HLA alleles showed depletion of expressed neoantigens, suggesting that subclones in immune infiltrated tumors may be selected for, by virtue of immune evasion through either HLA LOH or through repression of neoantigen expression (Figure 3C). Diminished neoantigen expression among immune-high tumors without HLA LOH was more pronounced when the more stringent definition of strongly binding neoantigens was used (Extended Data Fig. 6H).
We explored two potential mechanisms for neoantigen expression downregulation: negative selection of clones harboring the expressed neoantigens, and epigenetic downregulation through promoter hypermethylation. We observed an enrichment of neoantigens in genes that were lowly expressed in the tumor sample (<= 1TPM) as compared to non-synonymous non-neoantigens (p=5.5e-10, OR=1.3) (Extended Data Fig. 6I). This enrichment was stronger when we only considered strong neoantigens (p=6.8e-13, OR=1.4) (Extended Data Fig. 6I). Neoantigens identified in TRACERx were also less likely to occur in genes that were consistently expressed across 1019 NSCLC samples from TCGA (Figure 3D) compared to non-synonymous predicted non-neoantigens. While the generation of neoantigenic mutations in genes consistently expressed in TCGA was most reduced among tumors with high immune infiltration (p=2.1e-04, OR=0.77), we also observed this reduction among heterogeneous and low infiltrated tumors (p=1.8e-03, OR=0.82 & p=4.4e-02, OR=0.88, respectively). This is consistent with low-immune tumors once being subject to the selective pressures of an active immune microenvironment (Figure 3D).
To investigate methylation status of neoantigens, we performed multi-region reduced-representation bisulfite sequencing on 79 out of the 164 samples (28/64 patients) in the TRACERx RNAseq cohort in addition to the adjacent normal (Figure 3E, Table S2). Among genes harboring neoantigens, an 11.4-fold increase in promoter hypermethylation was observed for genes that were not expressed compared to those genes that were expressed (χ2-test, p=1.6e-04) (Figure 3F). To determine if the observed down-regulation was neoantigen-specific, promoter hypermethylation was further compared between all neoantigens and the same genes which did not carry the neoantigen in purity/ploidy-matched samples. Overall, non-expressed neoantigens were more likely to exhibit promoter hypermethylation than the same genes without a neoantigen (χ2-test, p=4.5e-02, OR=2.3) (Figure 3G, Table S3). Among expressed neoantigens, no difference in promoter hypermethylation state was observed when compared to purity/ploidy-matched samples (χ2-test, p=6.7e-01, OR=0.48) (Figure 3H, Table S4). These findings suggest that immune pressures may select for promoter hypermethylation and neoantigen silencing in evolving subclones.
Pervasive disruption to antigen presentation
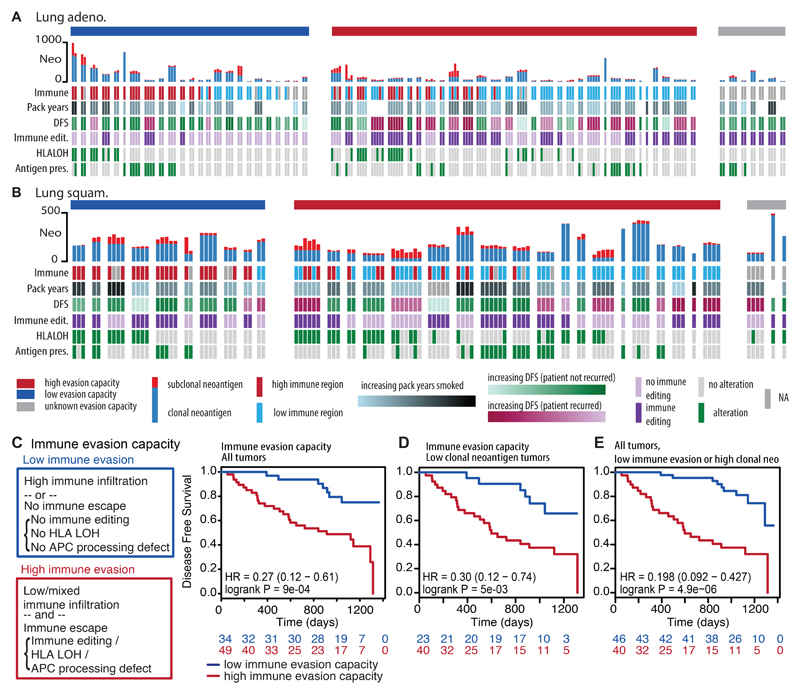
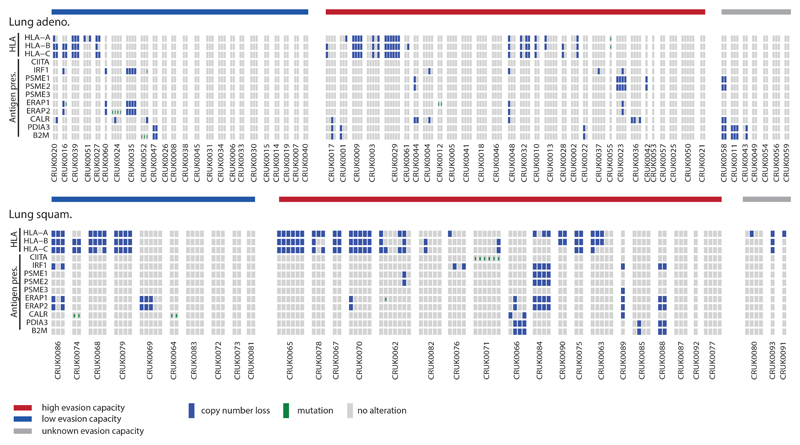
Defects in antigen presentation that interrupt tumor antigen recognition 19,20 may provide another immune evasion mechanism. To understand the importance of these avenues of immune escape in the treatment-naive setting, we mapped their occurrence, region by region (Figure 4A-B, Extended Data Fig. 7A; Methods).
Figure 4. Immune evasion capacity in early-stage non-treated NSCLC.
(A-B) The number of clonal and subclonal neoantigens found in the tumor region, immune cluster, patient prognosis, immunoediting classification, HLA LOH status, and antigen presentation defects are plotted for every tumor region for each tumor. Patients are split according to their immune evasion capacity. (C) Immune evasion capacity is determined by the level of immune infiltration and presence of immune escape mechanisms. Patients whose tumors have low immune evasion capacity have prolonged disease-free survival times. (D) A Kaplan Meier curve is shown for tumors with low clonal neoantigen burden (lowest three quartiles) split by their immune evasion capacity. (E) A Kaplan Meier curve is shown that combines clonal neoantigen load (upper quartile) and immune evasion capacity. For all survival curves, the number of patients in each group for every time point is indicated below the time point and significance is determined using a two-sided log-rank test.
Disruption to antigen presentation, through HLA LOH or through mutations affecting MHC stability, the HLA enhanceosome, and peptide generation were frequently observed in both lung histologies (56% of lung adenocarcinomas and 78% of lung squamous cell carcinomas). HLA LOH and alterations affecting other components of the antigen presentation machinery, including B2M mutations, had a tendency for mutually exclusivity (lung adeno.: p=9.3e-04; lung squam.: p=1.5e-02), supporting antigen presentation dysfunction as a potent immune escape mechanism. Moreover, consistent with prior findings 20, highly infiltrated lung adenocarcinoma tumor regions were prone to exhibit HLA LOH (OR=2.4, p=3e-03).
Loss of HLA-C in particular may result in loss of the killer-cell immunoglobulin-like receptor (KIR) signal that inhibits elimination through NK cell activity 21. There are two groups of HLA-C alleles, HLA-C1 and HLA-C2, each with different KIR specificity 22. Thus, tumor cells from heterozygous patients (HLA-C1 and HLA-C2) would be expected to be targeted for NK cell-mediated elimination following loss of either HLA-C allele (Extended Data Fig. 7B). Conversely, patients with homozygous HLA-C alleles may avoid NK cell-mediated elimination. Consistent with this, NK cell infiltration was increased among heterozygous HLA-C1/C2 tumor regions with HLA-C LOH (p=6.2e-07) (Extended Data Fig. 7C). Increased NK cell infiltration was not observed among tumors without HLA-C LOH (p=0.12), suggesting that this change in the tumor microenvironment results from loss of the HLA-C inhibitory “self” signal.
Immune evasion capacity is prognostic in NSCLC
Finally, we examined whether combining estimates of immune infiltration and tumor immune evasion potential could provide prognostic power. Tumors were classified as exhibiting low evasion capacity (homogeneously high immune infiltration or no evidence of immune evasion [DNA immunoediting score > 1 and no antigen presentation disruption]) or high evasion capacity (at least one region with low immune infiltration as well as defective antigen presentation or DNA immunoediting score < 1). Patients whose tumors had a low immune evasion capacity, had significantly longer disease-free survival times (p=9.0e-04) (Figure 4C).
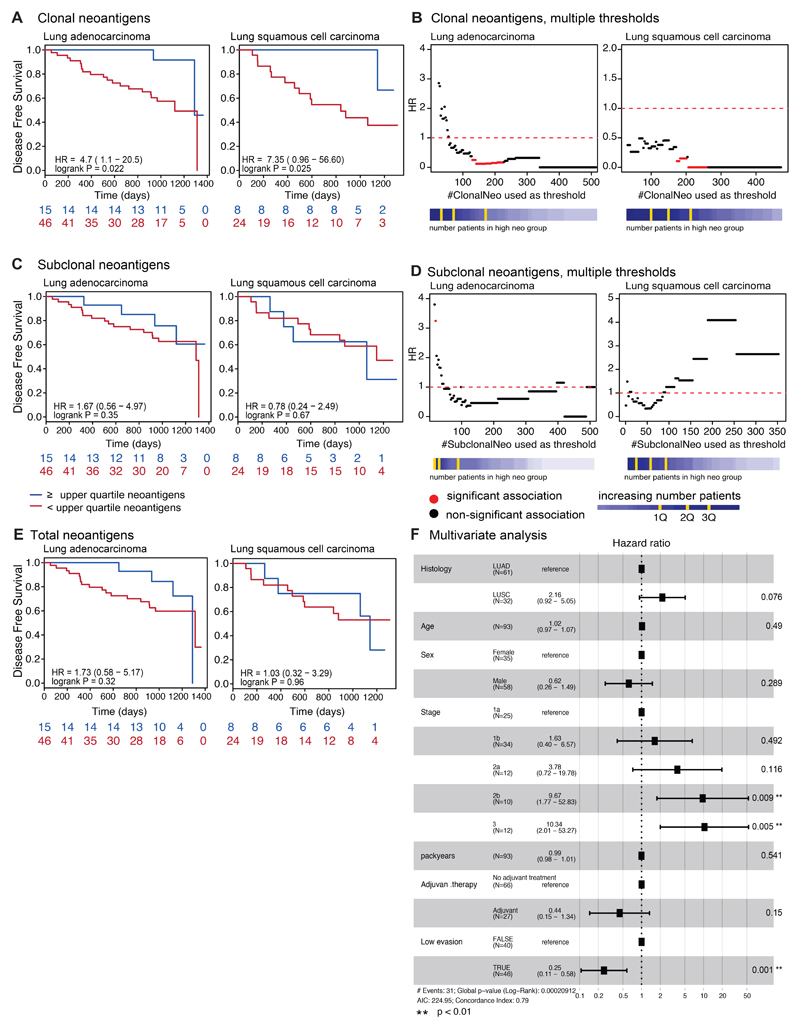
To explore these results in the context of our prior findings relating to the importance of clonal neoantigens 23, we also grouped patients into those harboring high or low clonal neoantigen burden using the previously defined threshold (upper quartile of the cohort) 23. Validating previous results, high clonal neoantigen burden was associated with improved disease-free survival among both lung adenocarcinoma and lung squamous cell carcinoma (lung adeno.: p=2.2e-02; lung squam.: p=2.5e-02) (Extended Data Fig. 8A). The association observed between clonal neoantigens and disease-free survival was not dependent on the specific threshold used (Extended Data Fig. 8B) and clonal neoantigen burden remained significant in a multivariate model with stage, histology, age, gender, pack years, and adjuvant therapy (p=0.02). Conversely, no significant relationship between subclonal neoantigen burden, nor total neoantigen burden, and disease-free survival was observed (Extended Data Fig. 8C-E).
However, intriguingly, when we focused on tumors with a low clonal neoantigen load, the immune evasion capacity of a tumor was still prognostic (p=5.3e-03), indicating that in the absence of immune evasion, even a low clonal neoantigen burden may be sufficient to elicit an effective immune response (Figure 4D).
Furthermore, we observed that tumors with either a high clonal neoantigen load or low immune evasion capacity exhibited significantly improved disease-free survival times (p=4.9e-06) (Figure 4E). This association remained significant in a multivariate model with stage, histology, age, gender, pack years, and adjuvant therapy (p<0.001) (Extended Data Fig. 8F). These data suggest that considering the many facets of the interaction between the tumor and immune microenvironment is important for predicting clinical outcome.
Discussion
To capture the complex interplay between cancer genomic evolution and anti-tumor immunity in lung cancer, we integrated genomic, transcriptomic, epigenomic, and pathologic data to define how tumors are sculpted by the immune microenvironment, what mechanisms of immune escape influence tumor evolution, and the clinical impact of active tumor-immune interaction. Our results suggest the immune microenvironment is highly variable between patients but also markedly different between distinct regions of the same tumor, with nearly a third of tumors exhibiting diverse immune infiltration.
Our results show evidence of tumor evolution shaped through different immunoediting mechanisms, either affecting antigen presentation or neoantigenic mutations themselves at both the DNA and RNA-level.
Consistent with disruption to antigen presentation machinery being subject to strong positive selection 24, we found HLA LOH tended towards mutually exclusivity with other forms of antigen presentation disruption, such as mutations affecting MHC stability, the HLA enhanceosome, or peptide generation. At the DNA level, sparsely infiltrated tumors showed enrichment for the elimination of clonal neoantigens, indicating the importance of chromosomal instability driving neoantigen loss.
As a whole, tumors exhibited fewer neoantigens in expressed genes than expected, potentially reflecting historical purifying selection of neoantigens. High-immune tumors with intact HLA alleles also displayed transcriptomic neoantigen depletion, suggesting that these tumors may evade immune predation either through HLA LOH or by suppressing neoantigen expression, but seldom both. Promoter hypermethylation was identified as a potential mechanism of transcriptomic neoantigen depletion, leading to the preferential repression of genes harboring neoantigenic mutations. Promoter hypermethylation affected neoantigen expression level in ~23% of the neoantigens studied, indicating that additional mechanisms of neoantigen transcription repression require elucidation.
Through the combination of immune microenvironment and tumor immune escape factors we defined an estimate of each tumor’s immune evasion capacity, which associated with poorer outcome. As TRACERx is a prospective study of early stage untreated NSCLC, it will be important to validate these findings in the extended longitudinal cohort as the study matures.
The observation that clonal neoantigens can be subject to copy number loss and transcript repression, even in untreated early stage disease, may have important implications for predicting response and resistance to immune checkpoint blockade. Relapse samples following checkpoint blockade therapy have been shown to eliminate clonal neoantigens, reshaping the TCR repertoire of those samples 18. Clonal neoantigens occurring in expressed genes which are required for lung cancer cell fitness may make ideal targets for vaccine or adoptive cell therapies.
The extent to which neoantigen transcript depletion is dynamic in response to therapy and tumor dissemination and whether such phenomena may be harnessed to improve immunotherapy response is unknown. Epigenetic immune evasion supports the potential for epigenetic modulatory agents, in combination with immunotherapy, to restore or improve tumor immunogenicity 25. One possibility is that epigenetic repression of a neoantigen in a lung cancer expressed gene may result at a fitness cost. This may shed light on recent phenomenon observed in some patients with acquired resistance to checkpoint inhibitor therapy, who are subsequently re-challenged with the same drug and respond a second time 26.
Taken together, our results suggest early stage, untreated NSCLCs are frequently characterized by multiple independent mechanisms of immune evasion within individual tumors, emphasizing the strong selection pressures that the immune system imposes upon tumor evolution. Our results suggest that the beneficial role of successful immune surveillance, and the diversity of immune evasion mechanisms should be considered and harnessed in therapeutic interventions.
Methods
Patients and samples
The cohort evaluated within this study comes from the first 100 patients prospectively analyzed by the lung TRACERx study (https://clinicaltrials.gov/ct2/show/NCT01888601, approved by an independent Research Ethics Committee, 13/LO/1546) and mirrors the prospective 100 patient cohort described in 5.
Informed consent for entry into the TRACERx study was mandatory and obtained from every patient. There were 68 male and 32 female non-small cell lung cancer patients in the TRACERx study, with a median age of 68. The cohort is predominantly early-stage: Ia(26), Ib(36), IIa(13), IIb(11), IIIa(13), IIIb(1). Seventy-two had no adjuvant treatment and 28 had adjuvant therapy. All patients were assigned a study ID that was known to the patient. These were subsequently converted to linked study Ids such that the patients could not identify themselves in study publications. All human samples, tissue and blood, were linked to the study ID and barcoded such that they were anonymized and tracked on a centralized database overseen by the study sponsor only.
TRACERx 100 RNA-sequencing
RNA was extracted from the TRACERx 100 cohort using a modification of the AllPrep kit (Qiagen) as described in Jamal-Hanjani et al. 5. RNA integrity was assessed by TapeStation (Agilent Technologies). Samples that had a RIN score >=5 were sent to the Oxford Genomics Centre for whole RNA (RiboZero depleted) paired end sequencing. The ribodepleted fraction was selected from the total RNA provided before conversion to cDNA. Second strand cDNA synthesis incorporated dUTP. The cDNA was end-repaired, A-tailed and adapter-ligated. Prior to amplification samples underwent uridine digestion. The prepared libraries were size selected, multiplexed and QC’ed before paired end sequencing. Reads were 75 base pairs in length. FASTQ data was quality controlled and aligned to the hg19 genome using STAR 27. Transcript quantification was performed using RSEM with default parameters 28.
TRACERx 100 RRBS
Reduced representation bisulfite sequencing (RRBS) was obtained for roughly half of the NSCLC cohort with RNA-Seq data (79/164 tumor regions from 28/64 patients, each with matched normal). The NuGEN Ovation RRBS Methyl-Seq System, adapted by the manufacturer for automation on an Agilent Bravo liquid handling robot, was used to generate sequencing libraries by enzymatically digesting 100 ng of gDNA using MspI, followed by adaptor ligation and the final repair step. Generated libraries were bisulfite converted using Qiagen’s EpiTect Fast DNA Bisulfte Kit purchased separately from the kit, PCR amplified for 12 cycles and purified using Agencourt® RNAClean® XP magnetic beads. Purified libraries were quantified by Qubit dsDNA HS Assay (Invitrogen) and quality controlled using Agilent Bioanalyzer HighSensitivity DNA Assay (Agilent Technologies). Eight samples were multiplexed per flow cell and sequenced on an Illumina HiSeq2500 system using HiSeq SBS Kit v4 in paired-end 100bp runs for CRUK0062 and single end 100bp runs for the others yielding on average 150M raw sequencing reads per sample. Sequencing results were checked with FastQC v0.11.2 (Babraham Institute, https://www.babraham.ac.uk/), adapter sequences were trimmed with Trim Galore! v0.3.7, which is a wrapper around Cutadapt (doi:10.14806/ej.17.1.200), and NuGEN v1.0 diversity trimming script (https://github.com/nugentechnologies/NuMetRRBS) and reads aligned to the UCSC hg19 reference assembly using Bismark v0.14.430. Read deduplication was carried out using NuDup (pre-release version dated March 2015, https://github.com/nugentechnologies/nudup/), leveraging NuGEN’s molecular tagging technology producing on average 100M unique reads per sample.
Statistical information
All statistical tests were performed in R. No statistical methods were used to predetermine sample size. Tests involving correlations were done using “cor.test” with the Spearman’s method. Tests involving comparisons of distributions were done using “wilcox.test” or “t.test” using the unpaired option, unless otherwise stated. Hazard ratios and p-values were calculated with the “survival” package. For all statistical tests, the number of data points included are plotted or annotated in the corresponding figure.
Selection of immune infiltration approach
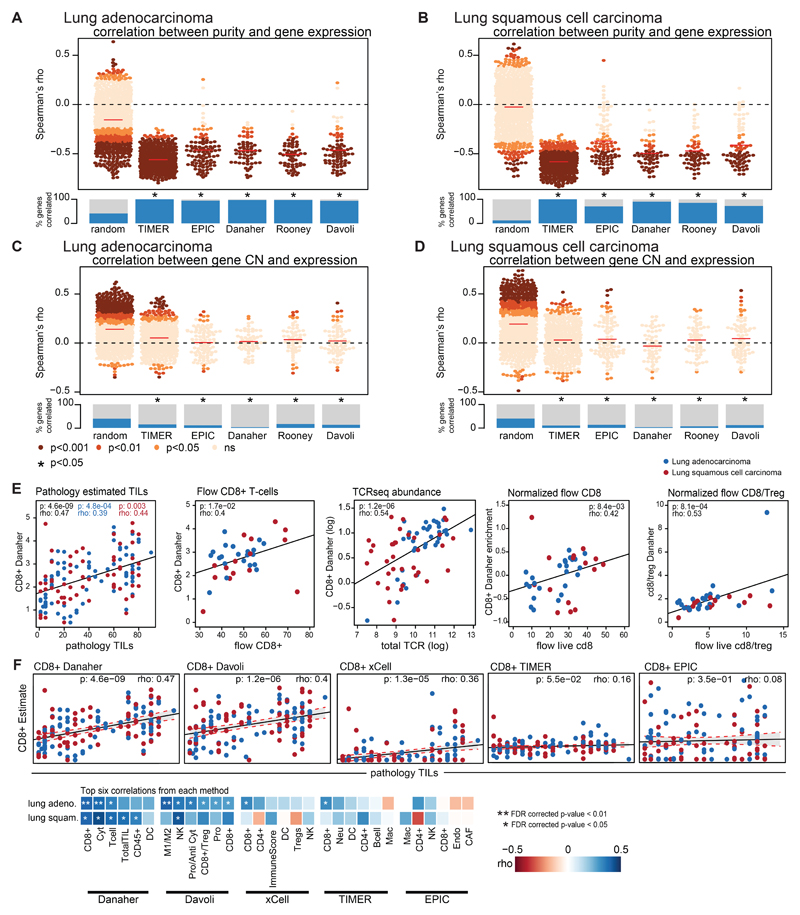
Previously defined measures of immune infiltration and activity were used to classify the immune microenvironment of all tumors (and tumor regions) with RNAseq data available 6–8,11,29. The genes used in each one of the immune estimation approaches were tested to see if they fit two criteria: 1) have a negative relationship with tumor purity, as genes defining immune subtypes are expressed in infiltrating immune cells 8 and 2) not show a positive correlation with tumor copy number at the gene locus, a positive correlation may indicate that the gene is expressed by the tumor cell, thereby confounding immune estimates. The proportion of genes in each immune estimation method that passed these two criteria was compared. Finally, for each method, the immune estimates themselves were compared against independent ground truth measures (pathology TIL estimation, flow cytometry quantification, and TCR abundance). The immune estimation that performed best in the TRACERx cohort was chosen.
Estimating immune cell populations
RNAseq-based estimations
The Danaher method 29 was used to estimate immune cell populations for every tumor region with RNAseq data available. The immune cell populations were: CD8+ T-cells (cd8), exhausted CD8+ T-cells (cd8.exhausted), CD4+ T-cells (cd4), regulatory T-cells (treg), helper T-cells (th1), dendritic cells (dend), B cells (bcell), mast cells (mast), NK cells (nk), NK CD56dim cells (nkcd56dim), neutrophils, macrophages, CD45+ cells (cd45), and measures for total T-cells (tcells), total TILs (total.til), and cytotoxic cells (cyto). Because the original Danaher paper did not identify any suitable genes for CD4+ T-cell population estimation and a poor relationship with ground truth measures was observed in the TRACERx cohort using the Danaher CD4+ T-cell estimates, the Davoli CD4+ T-cell estimates were used instead. The Davoli estimate was chosen as overall, they matched the Danaher estimates closely and performed nearly as well for the selection criteria.
The Jiang immune measures were calculated using the TIDE web interface (http://tide.dfci.harvard.edu/)
Pathology TIL estimation
TILs were estimated from pathology slides using international established guidelines developed by the International Immuno-Oncology Biomarker Working Group the Salgado method 10. Briefly, from the pathology slide of a given tumor region, the relative proportion stromal area to tumor area was determined. TILs were reported for the stromal compartment (=% stromal TILs). The denominator used to determine the % stromal TILs is the area of stromal tissue (i.e. area occupied by mononuclear inflammatory cells over total intratumoral stromal area), not the number of stromal cells (i.e. fraction of total stromal nuclei that represent mononuclear inflammatory cell nuclei). This method has been demonstrated to be reproducible among trained pathologists 30. An intra-personal concordance was performed and this demonstrates high reproducibility. The International Immuno-Oncology Biomarker Working Group has developed a freely available training tool to train pathologists for optimal TIL-assessment on hematoxylin eosin slides (www.tilsincancer.org).
Flow measurements
Tissue samples were collected and transported in RPMI-1640 (Sigma, cat# R0883-500ML). Single cell suspensions were produced by enzymatic digestion using liberase with subsequent cellular disaggregation using a Miltenyi gentleMACS Octo Dissociator. Lymphocytes were isolated from single cell suspension by gradient centrifugation on Ficoll Paque Plus (GE Healthcare, cat# 17-1440-03) and stored in liquid nitrogen. Blood samples were collected in BD Vacutainer EDTA blood collection tubes (BD cat# 367525), PBMC’s were then isolated by gradient centrifugation on Ficoll Paque (GE Healthcare, cat# 17-1440-03) and stored in liquid nitrogen.
FC receptors were blocked with Human Fc Receptor Binding Inhibitor (Thermo) before staining. Non-viable cells were stained using the eBioscience Fixable Viability Dye eFluor 780 (Thermo). Cells were stained in BD Brilliant stain buffer (BD cat# 563794) with the following monoclonal antibodies: anti-human CD3 (clone SK7, BD cat# 565511), anti-human CD4 (clone SK3, BD cat# 566003), anti-human CD8 (clone RPA-T8, BD cat# 564804). Data was acquired on a BD Symphony flow cytometer and analyzed in FlowJo. Cells were gated for size, single cells, live cells, CD3+CD8+ T cells.
TCR abundance
A previously developed quantitative experimental and computational TCR sequencing pipeline 31 was used for the high throughput sequencing of α and β TCR chains. TCR sequencing was performed on whole RNA extracted from multi-region tumor specimens. A distinct feature of this TCR sequencing protocol is the utilization of a unique molecular identifier (UMI) that enables correction for PCR and sequencing errors, thereby providing a quantitative and reproducible method of library preparation 31,32.
Classifying tumor regions as immune high/low
Tumors were split into either lung adenocarcinoma or lung squamous cell carcinoma. The Danaher estimates for all tumor regions from each histological type were clustered together using “ward.D2”. The dendrogram was cut into two, and the samples which fell in the portion with higher levels of immune infiltrate estimation were considered immune high tumor regions. Conversely, the samples which portion with lower levels of immune infiltrate estimation were considered immune low tumor regions. If all tumor regions from a given sample were classified as immune low, that tumor was designated as consistently immune low; if all tumor regions from a given sample were classified as immune high, that tumor was designated as consistently immune high. If some tumor regions from the same tumor were immune high and others were immune low, the tumor overall was classified as heterogeneous.
If a tumor region had no RNAseq available, it could be rescued using the pathology TIL estimations. A tumor region was classified based on pathology TILs by determining if the pathology TIL estimate for the tumor region in question was closer to the median of the pathology TILs from the immune high or immune low tumor regions with RNAseq that had been clustered. The RNAseq cohort (164 tumor regions from 64 TRACERx patients) was expanded by rescuing tumor regions without RNAseq data (Extended Data Fig. 2A) with pathology estimated TILs (234 tumor regions from 83 TRACERx patients) (Extended Data Fig. 4E).
Calculation of IPRES score
The calculation of the IPRES score was done according to Hugo et al. 13.
Distance measures
Immune distance
The immune distance was determined by taking the Euclidean distance of immune infiltrate estimates between tumor regions.
Genomic distance
The genomic distance was calculated by taking the Euclidean distance of the mutations present between tumor regions. All mutations present in any region from a tumor were turned into a binary matrix, where the rows were mutations and columns tumor regions. This matrix was clustered and the pairwise distance between any two tumor regions was determined.
Calculation of Shannon entropy
For each tumor region, the Shannon entropy was estimated using the command “entropy.empirical” from the “entropy” R package. This was calculated based on the number and prevalence of different tumor subclones found in that region, such that a tumor region containing only one subclone was assigned a value of 0.
The Shannon entropy score, H, followed the formula: H = -Σpi log (pi), where pi is the probability of the ith clone appearing in the tumor cell population.
Predicted neoantigen binders
Novel 9-11mer peptides that could arise from identified non-silent mutations present in the sample 5 were determined. The predicted IC50 binding affinities and rank percentage scores, representing the rank of the predicted affinity compared to a set of 400,000 random natural peptides, were calculated for all peptides binding to each of the patient’s HLA alleles using netMHCpan-2.8 17,33 and netMHC-4.0 33. Using established thresholds, predicted binders were considered those peptides that had a predicted binding affinity <500nM or rank percentage score <2% by either tool. Strong predicted binders were those peptides that had a predicted binding affinity <50nM or rank percentage score <0.5%. Of the 28,489 non-synonymous mutations in this cohort, 24,494 were predicted to encode peptides capable of binding to at least one of the patient’s HLA class I alleles (binding affinity < 500nM or rank% < 2) and 13,884 were predicted to strongly bind (binding affinity < 50nM or rank% < 0.5) 17.
When RNAseq data was available, a neoantigen was considered to be expressed if at least five RNAseq reads mapped to the mutation position, and at least three contained the mutated base.
Neoantigen depletion
Transcriptional
Transcriptional neoantigen depletion was identified by first dividing tumors into immune classifications and HLA LOH categories (loss/no loss). All non-synonymous mutations were annotated as expressed in the RNAseq or not using the definitions above. Then a test for enrichment was performed to determine if non-synonymous mutations that were neoantigens were less likely to be expressed as compared to the non-synonymous mutations which were not predicted to be neoantigens.
Copy number
Copy number neoantigen depletion was identified by first dividing tumors into immune classifications. All non-synonymous mutations were annotated as either in a region of subclonal copy number loss or not as identified in Jamal-Hanjani et al. 5. Then a test for enrichment was performed to determine if non-synonymous mutations that were neoantigens were more likely to be in regions of subclonal copy number loss as compared to the non-synonymous mutations which were not predicted to be neoantigens.
Methylation
Neoantigens in genes that are consistently expressed across the TCGA NSCLC cohort were classified in two groups: expressed, where the mutant is detected in at least 30 reads, and non-expressed, where no mutant transcript is observed. Of the 375 non-expressed and 883 expressed neoantigens with matched RRBS data, 77 and 406 were unique, respectively (others were duplicates from different regions of the same patient). We down-sampled the expressed neoantigens list to match as closely as possible the gene expression and the variant allele frequency distributions observed for the non-expressed neoantigens. We then assessed differential methylation as follows: bulk and normal per-CpG methylation rates in promoters (2kb up- and downstream of TSS) modelled as beta distributions, B(α+1,β+1), where α represents the observed methylated read counts and β the unmethylated read counts, and we compute P(B(α, β)tum > B(α, β)norm) exactly via:
Hochberg family-wise error rate (FWER) correction is then applied and promoters are flagged as hypermethylated when ≥3 CpGs are significantly hypermethylated (q<0.05). Promoter counts are tested in a 2x2 contingency table (methylation status vs expression status or mutation status) using a χ^2-test.
Identifying tumor regions with HLA LOH
Tumor regions harboring an HLA LOH event were identified using the LOHHLA method, described in 20.
Immune evasion alterations
Antigen presentation pathway genes were compiled from 34 and affected the HLA enhanceosome, peptide generation, chaperones, or the MHC complex itself. They included disruptive events (non-synonymous mutations or copy number loss defined relative to ploidy 5) of the following genes: CIITA, IRF1, PSME1, PSME2, PSME3, ERAP1, ERAP2, HSPA, HSPC, TAP1, TAP2, TAPBP, CALR, CNX, PDIA3, B2M.
TCGA data
RNA-sequencing data was downloaded from the TCGA data portal. For each LUAD and LUSC sample, all available ‘Level_3’ gene-level data was obtained. TCGA genes were considered consistently expressed if they were expressed at >= 1TPM in 95% of the samples for each histology.
Extended Data
Extended Data Fig. 1. Determination of robust immune infiltration approach.
(A-D) The expression of the genes used in the each of the immune signature definitions is correlated against tumor purity (A-B) and tumor copy number (C-D). Plotted are random genes (n=1000), TIMER genes (n=575), EPIC genes (n=98), Danaher genes (n=60), Rooney genes (n=100), and Davoli genes (n=75). The Spearman’s rho value of the correlation is plotted for the immune genes comprising each signature definition, colored by the p-value of the association. The comparisons are performed separately for lung adenocarcinoma and lung squamous cell carcinoma. The median rho value for the immune signature set is indicated by the red line. The fraction of genes whose expression value is significantly correlated with purity or tumor copy number is shown and compared to a set of random genes. For every immune signature considered, there was significant enrichment of genes whose expression negatively correlated with tumor purity as compared to the random selection of genes and a significant enrichment of genes whose expression positively correlated with tumor copy number as compared to the random selection of genes. (E) Scatterplots show the Spearman correlation between TIL scores and CD8+ T-cells as measured by the Danaher approach (n=140), between flow CD8+ T-cell estimates and Danaher CD8+ T-cells (n=36), TCRseq abundance and Danaher CD8+ T-cells (n=72), normalized live flow CD8+ T-cell estimates and Danaher CD8+ T-cells (n=39), and normalized live flow CD8+ T-cell/Treg and Danaher CD8+/Treg estimates (n=38). Blue dots indicate regions from a lung adenocarcinoma tumor, red dots indicate regions from a lung squamous cell carcinoma tumor. Spearman rho values, p-values, and 95% CI (shaded area) are given for all tumor regions (black), lung adenocarcinoma tumor regions (blue), and lung squamous cell carcinoma tumor regions (red). (F) A scatterplot showing the correlation between pathology TIL estimates and CD8+ estimates from each of the immune infiltration methods is shown (n=140). Lung adenocarcinoma tumor regions are shown in blue; lung squamous cell carcinoma tumor regions are shown in red. Below, the top six correlations between pathology TIL estimates and an immune cell subset is shown for each method. Blue boxes indicate positive correlation, whereas red boxes indicate negative correlation. P-values were FDR corrected. (G) Example of CD8 T-cell quantification in a representative TRACERx TIL sample. TILs were isolated from tumor regions of surgical resections as previously described and cryopreserved. Thawed samples were stained with a custom-designed 20-marker antibody panel to measure T cell activation, dysfunction and differentiation by flow cytometry.
Extended Data Fig. 2. TRACERx 100 sample selection and patient characteristics.
(A) CONSORT diagram showing the selection of TRACERx 100 patients for RNAseq and/or pathology TIL analysis. (B) Patient characteristics for the TRACERx 100 cohort are shown. Patient characteristics can be found in tabular form in Table S1.
Extended Data Fig. 3. Difference in immune infiltration by histology.
The distribution of Danaher estimated CD8+ T-cell infiltrate is displayed for lung adenocarcinomas (adeno.) and lung squamous cell carcinomas (squam.) (n=145). Minima and maxima indicated by extreme points of boxplot. Median indicated by thick horizontal line. First and third quartiles indicated by box edges. A two-sided Wilcoxon rank-sum test is used.
Extended Data Fig. 4. Rescuing regions without RNAseq using pathology TILs.
(A) The difference in pathology TIL estimates is shown by RNAseq-derived immune cluster (n=139). (B) All regional pathology estimated TILs are plotted for each tumor sample (lung adenocarcinoma n=121; lung squamous cell carcinoma n=90). If a region also had RNAseq information available, the immune cluster that region belonged to is also shown as immune high (red) or immune low (blue). Immune clusters for tumor regions without RNAseq are annotated as grey. The immune class for the patients is also provided as high (red), low (blue), heterogeneous (orange), or unknown (grey). For all boxplots, minima and maxima indicated by extreme points of the plot. Medians are indicated by thick horizontal line. First and third quartiles are indicated by box edges. A two-sided Wilcoxon rank-sum test is used for comparisons. (C) The number of patients in each immune classification is plotted as inferred from using RNAseq data alone or by also incorporating pathology TIL estimates. (D) A correlation matrix of the Danaher immune cell estimates with the Jiang immunosuppressive cell subsets is shown (Spearman’s test). Positive correlations are indicated in blue and negative correlations are indicated in red. Correlations are significant unless marked with a black X. (E) The Jiang immune infiltration estimates are shown for TAM M2 (tumor associated macrophage M2) and MDSC (myeloid-derived suppressor cells) cells split by immune cluster (n=163). (F) The tumor purity is shown for the low tumor mutational burden (TMB) and high TMB regions of every tumor with heterogeneous TMB (n=12) Two-sided paired t-test is used for comparison. No corrections were made for multiple comparisons.
Extended Data Fig. 5. Heterogeneity of biomarkers predicting checkpoint blockade response.
(A) The TIDE gene signature score of each tumor region is shown per patient for patients with >1 region available (n=39). Using threshold defined by (dashed line), patients are classified as having low TIDE (light blue), high TIDE (dark blue), or heterogeneous TIDE (orange). (B) The IPRES gene signature score of each tumor region is shown per patient for patients with >1 region available (n=39). Using threshold defined by Hugo et al. 13 (dashed line), patients are classified as having low IPRES (light blue), high IPRES (dark blue), or heterogeneous IPRES (orange). (C) The expanded Ayers IFN signature is shown for each tumor region per patient for patients with >1 region available (n=38). For (A-C) the immune classification of the patient is also given. (D) The greatest difference in expanded Ayers IFN signature between tumor regions from the same tumor is plotted according to whether the tumor has heterogeneous immune infiltration or not (n=38). A two-sided Wilcoxon rank-sum test is used for comparison. (E) Tumor mutational burden (TMB) of each tumor region is shown per patient (n=93). Using a 10 mutations/mB threshold (dashed line), patients are classified as having low TMB (light blue), high TMB (dark blue), or heterogeneous TMB (orange). For all boxplots, minima and maxima indicated by extreme points of the plot. Medians are indicated by thick horizontal line. First and third quartiles are indicated by box edges. (F) A summary of the tumor histology, immune classification, TMB status, TIDE category, and IPRES category is shown for each tumor (n=93). There is an enrichment for heterogeneously immune infiltrated tumors to have heterogeneous TMB status and heterogeneous TIDE scores (Fisher’s exact test). No corrections were made for multiple comparisons.
Extended Data Fig. 6. Relationship between immune infiltration and tumor region diversity.
(A) The pairwise copy number (cn) and immune distances between every two tumor regions from the same patient are compared for lung adenocarcinoma (n=91) and lung squamous cell carcinoma (n=60). (B-C) For each tumor region, the CD8+ T-cell score is plotted against the Shannon diversity score. Lung adenocarcinomas (n=89) (B) and lung squamous cell carcinomas (n=50) (C) are shown. (D) The correlation between pathology TIL estimates and tumor purity is shown for lung adenocarcinoma (n=120) (blue) and lung squamous cell carcinoma (n=90) (red) regions. No relationship for either histology is observed. Spearman’s test is used to determine relationship. (E) The Shannon diversity score per lung adenocarcinoma tumor region (n=137) is plotted by immune classification as determined solely by pathology TIL estimates. A two-sided Wilcoxon rank-sum test is used for comparison. (F) A comparison of observed/expected immunoediting score between lung adenocarcinoma and lung squamous cell carcinoma tumors (n=92) is shown. A two-sided Wilcoxon rank-sum test is used for comparison. (G) The observed/expected immunoediting score is shown by number of unique HLAs present in the tumor (patients heterozygous at HLA-A, -B, and -C will have six unique HLA alleles) (n=90). For all boxplots, minima and maxima indicated by extreme points of the plot. Medians are indicated by thick horizontal line. First and third quartiles are indicated by box edges. (H) The odds ratio and 95% CI of transcriptional neoantigen depletion is shown for strongly binding neoantigens, calculated with Fisher’s exact test. Values <1 indicate that putative neoantigens are less likely to be expressed as compared to non-synonymous mutations that are not putative neoantigens. Tumors are broken down by HLA LOH status and their immune classification. (I) The enrichment for neoantigens and strongly binding neoantigens to occur in non-expressed genes as compared to non-synonymous non-neoantigens is shown, calculated with Fisher’s exact test. No corrections were made for multiple comparisons.
Extended Data Fig. 7. Components of immune evasion mechanisms in NSCLC.
(A) Each of the potential immune evasion mechanisms explored in Figure 4 are shown broken down by their component genes. Patients are split according to their immune evasion capacity status. Copy number losses are shown in blue and mutations are shown in green. (B) A schematic of how LOH of the HLA-C locus in HLA-C1/C2 heterozygous tumors may lead to NK cell-mediated destruction is shown. (C) The level of Danaher estimated NK cell infiltration / Total TIL estimate is shown for tumor regions with (n=45) and without (n=90) HLA-C LOH according to their HLA-C1/C2 heterozygosity status. A two-sided Wilcoxon rank-sum test is used for comparison.
Extended Data Fig. 8. Relationship between clonal neoantigen burden, immune infiltration, and patient prognosis.
(A, C, E) Kaplan-Meier curves are shown for lung adenocarcinoma and lung squamous cell carcinoma. The curves are split based on the upper quartile of clonal neoantigen burden (A), on the upper quartile of subclonal neoantigen burden (C), and on the upper quartile of total neoantigen burden (E). For all survival curves, the number of patients in each group for every time point is indicated below the time point and significance is determined using a log-rank test. (B, D) The hazard ratio is shown for each threshold value of clonal neoantigen (B) and subclonal neoantigen (D) load, indicating that a high clonal neoantigen burden remains significantly prognostic across a wide range of thresholds. Significant associations are indicated in red, whereas non-significant associations are plotted in black. (F) Both clonal neoantigen load and immune infiltration classification are incorporated in a multivariate analysis, becoming more significant when the variables are combined as compared to either metric individually. Other tumor and clinical characteristics are also controlled for in the multivariate analysis. Hazard ratios of each variable with a 95% CI are shown on the horizontal axis. Significance is calculated using a Cox proportional hazards model. All statistical tests were two-sided.
Supplementary Material
Acknowledgments
We thank the members of the TRACERx consortium for participating in this study. C.S is Royal Society Napier Research Professor. C.S is supported by the Francis Crick Institute (FC001169), the Medical Research Council (FC001169), and the Wellcome Trust (FC001169); by the UK Medical Research Council (grant reference MR/FC001169/1); C.S. is funded by Cancer Research UK (TRACERx and CRUK Cancer Immunotherapy Catalyst Network), the CRUK Lung Cancer Centre of Excellence, Stand Up 2 Cancer (SU2C), the Rosetrees and Stoneygate Trusts, NovoNordisk Foundation (ID 16584), the Breast Cancer Research Foundation (BCRF), the European Research Council Consolidator Grant (FP7-THESEUS-617844), European Commission ITN (FP7-PloidyNet-607722), Chromavision – this project has received funding from the European Union’s Horizon 2020 research and innovation programme under grant agreement No 665233, National Institute for Health Research, the University College London Hospitals Biomedical Research Centre, and the Cancer Research UK University College London Experimental Cancer Medicine Centre. N.M is a Sir Henry Dale Fellow, jointly funded by the Wellcome Trust and the Royal Society (Grant Number 211179/Z/18/Z), and also receives funding from CRUK Lung Cancer Centre of Excellence, Rosetrees, and the NIHR BRC at University College London Hospitals. P.V.L. is a Winton Group Leader in recognition of the Winton Charitable Foundation’s support towards the establishment of The Francis Crick Institute. J.D. is a postdoctoral fellow of the Research Foundation - Flanders (FWO). S.A.Q is funded by a CRUK Senior Cancer Research Fellowship (C36463/A22246), a CRUK Biotherapeutic Program Grant (C36463/A20764), and Rosetrees. The TRACERx study (Clinicaltrials.gov no: NCT01888601) is sponsored by University College London (UCL/12/0279) and has been approved by an independent Research Ethics Committee (13/LO/1546). TRACERx is funded by Cancer Research UK (C11496/A17786) and coordinated through the Cancer Research UK and UCL Cancer Trials Centre. For the RRBS methylation data, we acknowledge technical support from the CRUK-UCL Centre-funded Genomics and Genome Engineering Core Facility of the UCL Cancer Institute and grant support from the NIHR-BRC (BRC275/CN/SB/101330). The results published here are in part based upon data generated by The Cancer Genome Atlas pilot project established by the NCI and the National Human Genome Research Institute. The data were retrieved through database of Genotypes and Phenotypes (dbGaP) authorization (Accession No. phs000178.v9.p8). Information about TCGA and the investigators and institutions who constitute the TCGA research network can be found at http://cancergenome.nih.gov/.
Footnotes
Data Availability
Sequence data used during the study will be deposited at the European Genome-phenome Archive (EGA), which is hosted by The European Bioinformatics Institute (EBI) and the Centre for Genomic Regulation (CRG) under the accession code: EGAS00001003458. Further information about EGA can be found at https://ega-archive.org.
Code Availability
All code used for analyses was written in R version 3.3.1 and is available at: https://bitbucket.org/snippets/raerose01/EeLrLB
Author Contributions
R.R. created the bioinformatics analysis pipeline and wrote the manuscript. R.S., M.A.B, D.A.M, C.T.H, and T.L jointly analyzed pathology TIL estimates. J.L.R., J.Y.H., and E.G. performed flow cytometry experiments for validating immune signatures. K.J. performed TCRseq experiments for validating immune signatures. S.V. performed sample preparation and RNA extraction. E.L-C., J.D, A.F, G.A.W, and M.T generated and analyzed RRBS data. E.L.C and J.D performed DNA methylation analyses and neoantigen methylation analyses, under supervision of S.B. and P.V.L. N.J.B. gave immune signatures advice, conducted analyses of multiregion sequencing exome data, and reviewed the manuscript. M.J-H. designed study protocols and advised the clinical understanding of patients. Z.S., S.L, and M.D.H. helped direct avenues of bioinformatics and pathology TIL analysis. B.C, J.H., and S.A.Q. provided data analysis support and supervision. N.M. and C.S. jointly supervised the study and helped write the manuscript.
Author Information
Reprints and permissions information is available at www.nature.com/reprints.
The authors declare competing financial interests: C.S. receives grant support from Pfizer, AstraZeneca, BMS, and Ventana. C.S. has consulted for Boehringer Ingelheim, Eli Lily, Servier, Novartis, Roche-Genentech, GlaxoSmithKline, Pfizer, BMS, Celgene, AstraZeneca, Illumina, and Sarah Cannon Research Institute. C.S. is a shareholder of Apogen Biotechnologies, Epic Bioscience, GRAIL, and has stock options and is co-founder of Achilles Therapeutics. S.A.Q. is a co-founder of Achilles Therapeutics. R.R., N.M., and G.A.W. have stock options and have consulted for Achilles Therapeutics.
References
- 1.Galon J, et al. Type, density, and location of immune cells within human colorectal tumors predict clinical outcome. Science (New York, N.Y. 2006;313:1960–1964. doi: 10.1126/science.1129139. [DOI] [PubMed] [Google Scholar]
- 2.Charoentong P, et al. Pan-cancer Immunogenomic Analyses Reveal Genotype-Immunophenotype Relationships and Predictors of Response to Checkpoint Blockade. Cell reports. 2017;18:248–262. doi: 10.1016/j.celrep.2016.12.019. [DOI] [PubMed] [Google Scholar]
- 3.Zhang AW, et al. Interfaces of Malignant and Immunologic Clonal Dynamics in Ovarian Cancer. Cell. 2018;173:1755–1769.e1722. doi: 10.1016/j.cell.2018.03.073. [DOI] [PubMed] [Google Scholar]
- 4.Milo I, et al. The immune system profoundly restricts intratumor genetic heterogeneity. Sci Immunol. 2018;3 doi: 10.1126/sciimmunol.aat1435. [DOI] [PubMed] [Google Scholar]
- 5.Jamal-Hanjani M, et al. Tracking the Evolution of Non-Small-Cell Lung Cancer. The New England journal of medicine. 2017;376:2109–2121. doi: 10.1056/NEJMoa1616288. [DOI] [PubMed] [Google Scholar]
- 6.Davoli T, Uno H, Wooten EC, Elledge SJ. Tumor aneuploidy correlates with markers of immune evasion and with reduced response to immunotherapy. Science (New York, N.Y. 2017;355 doi: 10.1126/science.aaf8399. [DOI] [PMC free article] [PubMed] [Google Scholar]
- 7.Racle J, de Jonge K, Baumgaertner P, Speiser DE, Gfeller D. Simultaneous enumeration of cancer and immune cell types from bulk tumor gene expression data. eLife. 2017;6 doi: 10.7554/eLife.26476. [DOI] [PMC free article] [PubMed] [Google Scholar]
- 8.Li B, et al. Comprehensive analyses of tumor immunity: implications for cancer immunotherapy. Genome biology. 2016;17:174. doi: 10.1186/s13059-016-1028-7. [DOI] [PMC free article] [PubMed] [Google Scholar]
- 9.Newman AM, et al. Robust enumeration of cell subsets from tissue expression profiles. Nat Methods. 2015;12:453–457. doi: 10.1038/nmeth.3337. [DOI] [PMC free article] [PubMed] [Google Scholar]
- 10.Hendry S, et al. Assessing Tumor-Infiltrating Lymphocytes in Solid Tumors: A Practical Review for Pathologists and Proposal for a Standardized Method from the International Immuno-Oncology Biomarkers Working Group: Part 2: TILs in Melanoma, Gastrointestinal Tract Carcinomas, Non-Small Cell Lung Carcinoma and Mesothelioma, Endometrial and Ovarian Carcinomas, Squamous Cell Carcinoma of the Head and Neck, Genitourinary Carcinomas, and Primary Brain Tumors. Adv Anat Pathol. 2017;24:311–335. doi: 10.1097/PAP.0000000000000161. [DOI] [PMC free article] [PubMed] [Google Scholar]
- 11.Aran D, Hu Z, Butte AJ. xCell: digitally portraying the tissue cellular heterogeneity landscape. Genome biology. 2017;18:220. doi: 10.1186/s13059-017-1349-1. [DOI] [PMC free article] [PubMed] [Google Scholar]
- 12.Jiang P, et al. Signatures of T cell dysfunction and exclusion predict cancer immunotherapy response. Nature medicine. 2018;24:1550–1558. doi: 10.1038/s41591-018-0136-1. [DOI] [PMC free article] [PubMed] [Google Scholar]
- 13.Hugo W, et al. Genomic and Transcriptomic Features of Response to Anti-PD-1 Therapy in Metastatic Melanoma. Cell. 2016;165:35–44. doi: 10.1016/j.cell.2016.02.065. [DOI] [PMC free article] [PubMed] [Google Scholar]
- 14.Ayers M, et al. IFN-gamma-related mRNA profile predicts clinical response to PD-1 blockade. The Journal of clinical investigation. 2017;127:2930–2940. doi: 10.1172/JCI91190. [DOI] [PMC free article] [PubMed] [Google Scholar]
- 15.Hellmann MD, et al. Tumor Mutational Burden and Efficacy of Nivolumab Monotherapy and in Combination with Ipilimumab in Small-Cell Lung Cancer. Cancer cell. 2018;33:853–861 e854. doi: 10.1016/j.ccell.2018.04.001. [DOI] [PMC free article] [PubMed] [Google Scholar]
- 16.Rooney MS, Shukla SA, Wu CJ, Getz G, Hacohen N. Molecular and genetic properties of tumors associated with local immune cytolytic activity. Cell. 2015;160:48–61. doi: 10.1016/j.cell.2014.12.033. [DOI] [PMC free article] [PubMed] [Google Scholar]
- 17.Hoof I, et al. NetMHCpan, a method for MHC class I binding prediction beyond humans. Immunogenetics. 2009;61:1–13. doi: 10.1007/s00251-008-0341-z. [DOI] [PMC free article] [PubMed] [Google Scholar]
- 18.Anagnostou V, et al. Evolution of Neoantigen Landscape during Immune Checkpoint Blockade in Non-Small Cell Lung Cancer. Cancer discovery. 2017;7:264–276. doi: 10.1158/2159-8290.CD-16-0828. [DOI] [PMC free article] [PubMed] [Google Scholar]
- 19.Tran E, et al. T-Cell Transfer Therapy Targeting Mutant KRAS in Cancer. The New England journal of medicine. 2016;375:2255–2262. doi: 10.1056/NEJMoa1609279. [DOI] [PMC free article] [PubMed] [Google Scholar]
- 20.McGranahan N, et al. Allele-Specific HLA Loss and Immune Escape in Lung Cancer Evolution. Cell. 2017;171:1259–1271.e1211. doi: 10.1016/j.cell.2017.10.001. [DOI] [PMC free article] [PubMed] [Google Scholar]
- 21.Thielens A, Vivier E, Romagne F. NK cell MHC class I specific receptors (KIR): from biology to clinical intervention. Curr Opin Immunol. 2012;24:239–245. doi: 10.1016/j.coi.2012.01.001. [DOI] [PubMed] [Google Scholar]
- 22.Fischer JC, et al. Relevance of C1 and C2 epitopes for hemopoietic stem cell transplantation: role for sequential acquisition of HLA-C-specific inhibitory killer Ig-like receptor. J Immunol. 2007;178:3918–3923. doi: 10.4049/jimmunol.178.6.3918. [DOI] [PubMed] [Google Scholar]
- 23.McGranahan N, et al. Clonal neoantigens elicit T cell immunoreactivity and sensitivity to immune checkpoint blockade. Science (New York, N.Y. 2016;351:1463–1469. doi: 10.1126/science.aaf1490. [DOI] [PMC free article] [PubMed] [Google Scholar]
- 24.Garrido F, Ruiz-Cabello F, Aptsiauri N. Rejection versus escape: the tumor MHC dilemma. Cancer Immunol Immunother. 2017;66:259–271. doi: 10.1007/s00262-016-1947-x. [DOI] [PMC free article] [PubMed] [Google Scholar]
- 25.Dunn J, Rao S. Epigenetics and immunotherapy: The current state of play. Mol Immunol. 2017;87:227–239. doi: 10.1016/j.molimm.2017.04.012. [DOI] [PubMed] [Google Scholar]
- 26.Bernard-Tessier A, et al. Outcomes of long-term responders to anti-programmed death 1 and anti-programmed death ligand 1 when being rechallenged with the same anti-programmed death 1 and anti-programmed death ligand 1 at progression. Eur J Cancer. 2018;101:160–164. doi: 10.1016/j.ejca.2018.06.005. [DOI] [PubMed] [Google Scholar]
- 27.Dobin A, et al. STAR: ultrafast universal RNA-seq aligner. Bioinformatics. 2013;29:15–21. doi: 10.1093/bioinformatics/bts635. [DOI] [PMC free article] [PubMed] [Google Scholar]
- 28.Li B, Dewey CN. RSEM: accurate transcript quantification from RNA-Seq data with or without a reference genome. BMC bioinformatics. 2011;12:323. doi: 10.1186/1471-2105-12-323. [DOI] [PMC free article] [PubMed] [Google Scholar]
- 29.Danaher P, et al. Gene expression markers of Tumor Infiltrating Leukocytes. J Immunother Cancer. 2017;5:18. doi: 10.1186/s40425-017-0215-8. [DOI] [PMC free article] [PubMed] [Google Scholar]
- 30.Denkert C, et al. Standardized evaluation of tumor-infiltrating lymphocytes in breast cancer: results of the ring studies of the international immuno-oncology biomarker working group. Mod Pathol. 2016;29:1155–1164. doi: 10.1038/modpathol.2016.109. [DOI] [PubMed] [Google Scholar]
- 31.Oakes T, et al. Quantitative Characterization of the T Cell Receptor Repertoire of Naive and Memory Subsets Using an Integrated Experimental and Computational Pipeline Which Is Robust, Economical, and Versatile. Front Immunol. 2017;8:1267. doi: 10.3389/fimmu.2017.01267. [DOI] [PMC free article] [PubMed] [Google Scholar]
- 32.Best K, Oakes T, Heather JM, Shawe-Taylor J, Chain B. Computational analysis of stochastic heterogeneity in PCR amplification efficiency revealed by single molecule barcoding. Scientific reports. 2015;5 doi: 10.1038/srep14629. 14629. [DOI] [PMC free article] [PubMed] [Google Scholar]
- 33.Andreatta M, Nielsen M. Gapped sequence alignment using artificial neural networks: application to the MHC class I system. Bioinformatics. 2016;32:511–517. doi: 10.1093/bioinformatics/btv639. [DOI] [PMC free article] [PubMed] [Google Scholar]
- 34.Arrieta VA, et al. The possibility of cancer immune editing in gliomas. A critical review. Oncoimmunology. 2018;7:e1445458. doi: 10.1080/2162402X.2018.1445458. [DOI] [PMC free article] [PubMed] [Google Scholar]
Associated Data
This section collects any data citations, data availability statements, or supplementary materials included in this article.


