Abstract
Purpose:
The aim of the study is to explore the patient's and scan's parameters that affect the iodine concentration in the abdomen using dual energy computed tomography (DECT) in an oncologic population.
Method:
This is a retrospective study with consecutive patients with different cancers who underwent a single-source DECT (ssDECT) examinations at our institution between years 2015 and 2017. On axial IODINE images, the radiologist manually drew a circular ROI along the inner contour of the aorta. Mean iodine concentration and ROI areas were recorded. Body mass index for every patient was recorded. Descriptive statistics were summarized for iodine concentration and patient/scan characteristics. Linear regression was used to examine associations between iodine concentration in aorta and studied characteristics. Statistical significance was set at a p value < 0.05.
Results:
The univariate analysis, showed a statistically significant association between iodine concentration within the aorta and the area of ROI (Estimated Coefficient β: −0.013), the rate of injection (Estimated Coefficient β: 2.09), the acquisition time (Estimated Coefficient β: −0.195). In multivariable analysis iodine concentration in the aorta increased with higher rate of injection (4 ml/sec), smaller ROI area and lower BMI.
Conclusion:
Our results showed how iodine concentration is highly dependent on some intrinsic and extrinsic parameters of the examination. These parameters should be taken into account since lower concentration of iodine decrease contrast-to-noise ratio, and in longitudinal follow up studies, they would affect iodine quantitive assessments in cancer patients with frequent chemotherapy-induced variations in BMI and cardiac function.
Keywords: DECT, Iodine, Oncologic patients, Follow-up
1. Introduction
Tissue iodine concentration significantly influences X-rays attenuation spectrum, and thus, contrast-to-noise ratio in every examination performed after the injection of iodinated contrast media (CM) [1]. In an oncologic population, this concept is particularly important for images acquisition during the arterial phase, which is often used for the assessment of hypervascular tumors within the abdomen [2]. Many parameters can potentially influence the delivery of the contrast medium, and therefore the iodine, to different parts of the body, some of them related to patients' physiology and others to the specific technology being used [3].
An important variable that affects the iodine concentration within vessels and the arterial enhancement is the iodine delivery rate (IDR) [4]. IDR is operator-dependent, expressed in g I/sec and determined by modifying the injection flow rate (FR) and the iodine concentration of a given CM. The required value can be obtained virtually at any given concentration of CM according to the formula:
IDR= (I/1000) x FR, with I being the CM concentration in iodine (expressed in mg I/mL) [5].
Iodine concentration is also influenced by patient-specific variables such as cardiovascular status (i.e. distribution volume, cardiac output) and individual body mass index (BMI). These factors contribute to the magnitude of vascular and parenchymal enhancement [6-8].
Dual-Energy computed tomography (DECT) scanners can differentiate different materials according to their specific composition at different energies (material decomposition). The last generation of scanners allows to obtain an accurate iodine quantification [9]. The aim of DECT is to obtain two attenuation data sets at high and low energy, in order to better differentiate materials and tissues, according to their attenuation at different energies [10]. These scanners provide images similar to those obtained with single-energy CT, and produce processed images that increase iodine conspicuity (enhancement) in parenchymal tissue or vascular structures. The most important oncological applications of these scanners are currently the detection and characterization of hypervascular lesions in liver, pancreas, kidney and adrenal glands [11].
The aim of the study is to explore the patient’s and scan’s parameters that affect the iodine concentration in specific portions of the body using DECT in an oncologic population.
2. Materials and methods
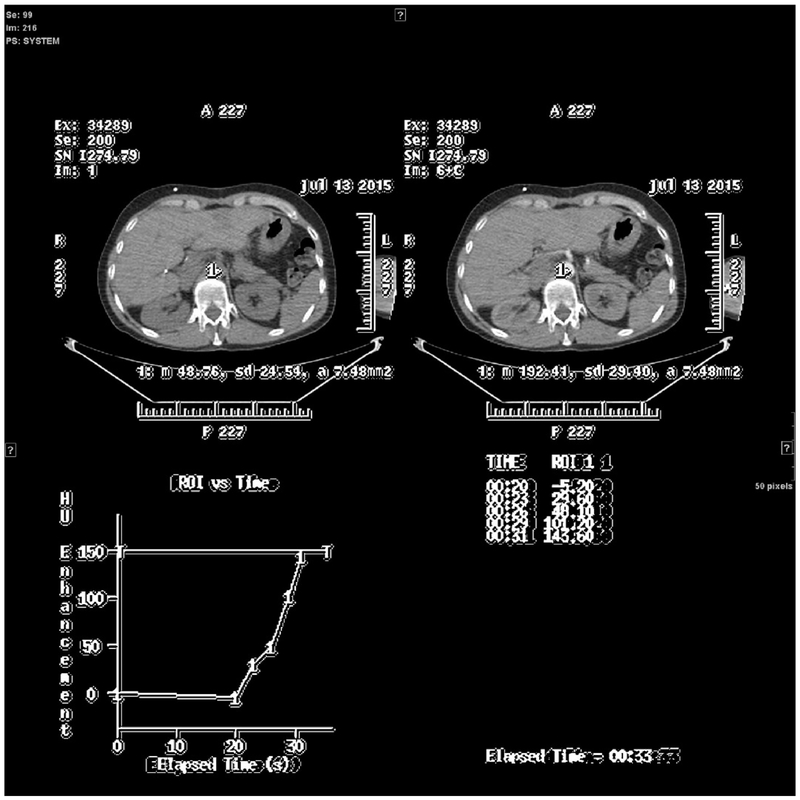
This retrospective study was approved by the local IRB, and patient consent was waived. We selected consecutive patients with different cancers who underwent a single source DECT (ssDECT) examination at our institution between years 2015 and 2017. Exclusion criteria were (1) lack of arterial phase and (2) the presence of metallic material in the upper abdomen in order to avoid artifacts [19,26] and potential confounding factors for iodine quantification [14,19]. CT abdominal examinations were performed with a ssDECT (GE Discovery CT750HD, GE Medical Systems, Milwaukee, Wisconsin) using a triphasic protocol after intravenous administration of 150 mL of iodinated contrast material (Iohexol 300 mg/mL, Omnipaque 300, GE Healthcare, Cork, Ireland). Following an unenhanced phase, an arterial phase was obtained by using bolus tracking technique (smart prep) with placement of a circular region of interest (ROI) in the abdominal aorta at the level of the celiac axis. A venous phase scan was finally acquired at about 90 s. Different injection flow rates were used, ranging from 3 mL/s to 4 mL/s. The same bolus tracking technique has been used in all patients. After the contrast reaches the threshold of 150 HU in the designated ROI, the CT scanner is activated, and it needs 15 s to start the images acquisition (Fig. 1.)
Fig. 1.
Bolus tracking technique, example of a threshold reached in a particular patient.
The threshold was reached at 33 s. The images acquisition started 15 s after the threshold was reached. The total pre-acquisition time would be 48 s after the start of injection in this particular patient.
The arterial phase was acquired by using the Gemstone Spectral imaging (GSI, GE Medical systems, Milwaukee, Wisconsin) modality: fast switching voltage 80/140 kVp, fixed mA, 0.7 s rotation time, pitch 0.984. Images were reconstructed with a matrix of 512 × 512, standard deconvolution kernel, and a thickness of 2.5 mm spaced by 2.5 mm.
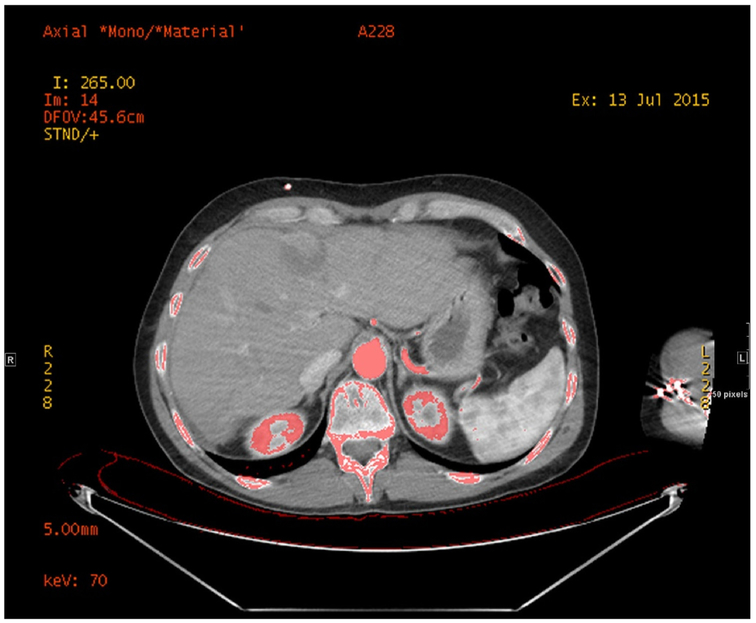
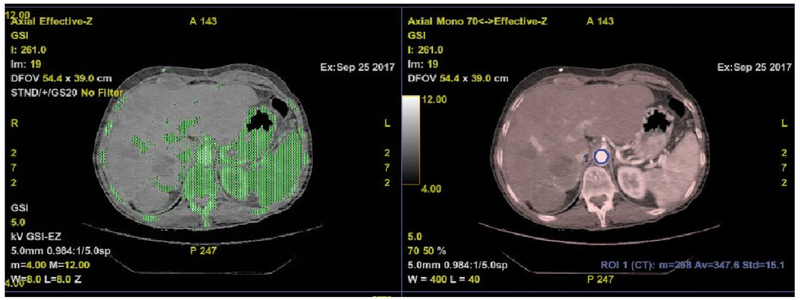
One radiologist (blinded for peer review) reconstructed the ssDECT arterial datasets with GSI Volume Viewer on Advantage volume share 7 (GE Medical systems, Milwaukee, Wisconsin) to obtain monochromatic images at 70 keV and material density (IODINE) images (Fig. 2), using iodine and water as basis materials [14, 27]. On axial IODINE images (window/level: 400/40 HU), the radiologist manually drew a circular ROI along the inner contour of the aorta (Fig. 3), just above the celiac artery takeoff, while sparing the aortic wall and any intimal calcifications.
Fig. 2.
Overlay Material density (Iodine)\70 keV images.
Iodine and water as basis materials were reconstructed by a radiologist and used as reference for iodine quantification.
Fig. 3.
Aorta segmentation and iodine quantification.
One radiologist manually drew a circular ROI along the inner contour of the aorta, just above the level of the celiac artery takeoff, while sparing the aortic wall and any intimal calcifications.
Another ROI of the same surface area was drawn within the paraspinal muscle, to be used as a reference.
Mean iodine concentration and ROI areas were recorded. Body mass index for every patient was recorded at the same time of the CT examination + /− 1 week.
Descriptive statistics were summarized for iodine concentration and patient/scan characteristics. Linear regression was used to examine associations between iodine concentration in aorta and studied characteristics. Statistical significance was set at a p value < 0.05.
3. Results
A total of 100 consecutive patients were included in the study. Descriptive statistics are summarized in Table 1 for iodine concentration and patient/scan characteristics.
Table 1.
Iodine concentration and patient characteristics.
| Median (Range) | Mean ± SD | |
|---|---|---|
| ROI area (mm2) | 275.25 (103.3, 453.4) | 275.57 ± 74.06 |
| Mean iodine concentration in aorta (mg/mL) | 11.57 (5.62, 19.06) | 11.76 ± 2.84 |
| SD of iodine concentration in aorta (mg/mL) | 0.5 (0.29, 0.86) | 0.52 ± 0.13 |
| Mean iodine concentration in muscle (mg/mL) | 0.41 (0.03, 2.37) | 0.45 ± 0.29 |
| SD of iodine concentration in muscle (mg/mL) | 0.32 (0.21, 0.66) | 0.33 ± 0.07 |
| Acquisition time (sec) | 35 (35, 46) | 37.41 ± 3.18 |
| BMI | 27.4 (18.5, 49.1) N (%) | 27.9 ± 5.37 |
| Rate of injection (mL/sec) | ||
| 3 | 1 (1%) | |
| 3.5 | 11 (11%) | |
| 4 | 88 (88%) | |
The univariate analysis (Table 2), showed a statistically significant association between iodine concentration within the aorta and:
Table 2.
Associations with aorta iodine concentration.
| Univariate Analysis | |||
|---|---|---|---|
| Estimated Coefficient (β) |
SD | p Value | |
| ROI area (mm2) | −0.013 | 0.004 | 0.001 |
| Rate of injection (mL/sec) = 4 vs less | 2.09 | 0.852 | 0.016 |
| Mean iodine concentration in muscle (mg/mL) | −0.521 | 0.985 | 0.598 |
| SD of iodine concentration in muscle (mg/mL) | −2.625 | 4.167 | 0.53 |
| Acquisition time (sec) | −0.195 | 0.088 | 0.029 |
| BMI | −0.209 | 0.049 | < 0.001 |
| Multivariable Analysis | |||
| Estimated Coefficient (β) |
SD | p Value | |
| Rate of injection (mL/sec) = 4 vs less | 2.050 | 0.759 | 0.008 |
| ROI area (mm2) | −0.011 | 0.003 | 0.001 |
| BMI | −0.166 | 0.047 | 0.001 |
The estimated β was the average change in aorta iodine concentration with every 1 unit increase in the variable.
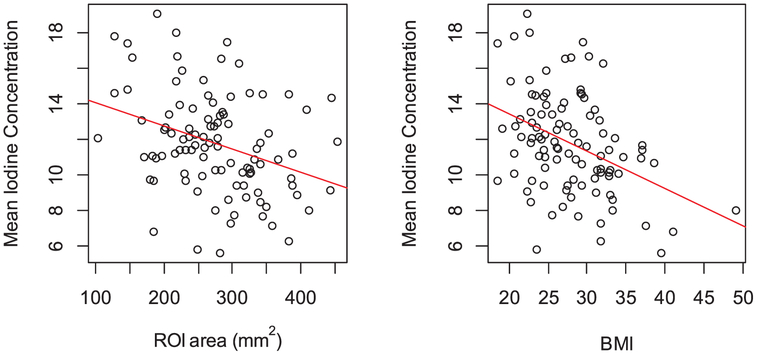
the area of ROI (Estimated Coefficient β: −0.013, SD: 0.004 and p value: 0.001) also visible in Fig. 4.
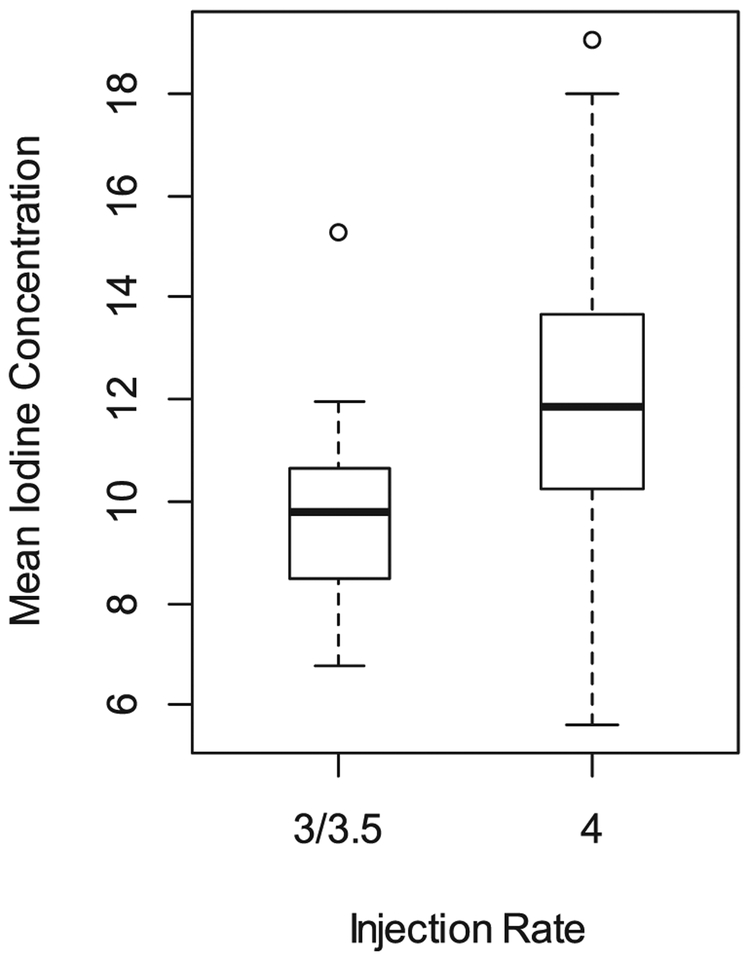
the rate of injection (Estimated Coefficient β: 2.09, SD: 0.852 and p value: 0.016) also visible in Fig. 5.
the acquisition time (Estimated Coefficient β: −0.195, SD: 0.088 and p value: 0.029).
the BMI (Estimated Coefficient β: −0.209, SD: 0.049 and p value < 0.001), also visible in Fig. 4.
Fig. 4.
Scatter plot of mean iodine concentration in aorta (in mg/mL) with (a) ROI area (in mm2) and (b) BMI.
Fig. 5.
Boxplot of mean iodine concentration in aorta (in mg/mL) by injection rate (in mL/sec).
No association was found with iodine concentration within the aorta and the reference paraspinal muscles (Table 2 and Table 3).
In multivariable analysis (Table 2), iodine concentration in the aorta increased with higher rate of injection (4 ml/sec), smaller ROI area and lower BMI. On average, the mean aorta iodine concentration (in mg/mL) in ROI was:
2.05 ± 0.76 unit higher in patients receiving contrast with an injection rate of 4 ml/sec compared to patients who had lower injection rate (p = 0.008)
0.11 ± 0.03 unit lower with every 1 mm2 increase in ROI area (p = 0.001)
0.17 ± 0.05 unit lower with every 1 unit of BMI increase (p = 0.001).
No association was found between iodine concentration within the muscles and the studied injection parameters.
4. Discussion
Our results showed how iodine concentration within the aorta, during the arterial phase, is highly dependent on some intrinsic and extrinsic parameters of the examination, whereas concentration within muscles is not affected by these parameters. This is of a particular importance in oncological patients with hypervascular tumors in specific.
Patients undergoing chemotherapy might have rapid changes in BMI [12-14]. Schvartsman et al. showed how patients with early breast cancer undergoing chemotherapy can gain or lose weight according to their age [12]. Similarly, Kang et al. showed that patients with cancers of the biliary tracts have also sudden BMI changes during the initial period of chemotherapy [15]. Another study from Cong et al. demonstrated how BMI changes are frequent during chemotherapy in colon cancer patients and how these fluctuations correlate with survival [14].
Weight changes may lead to an underestimation of the arterial hypervascularity of a given lesion [16]. The reasons reside in the pharmacokinetics of iodinated CM: CM is injected in the vascular space and then distributes rapidly into the plasma and the extracellular space of parenchymal organs, without permeating into the intracellular space. Consequently, the concentration of CM in parenchymal organs is closely related to the volume of the extracellular space and plasma. Chemotherapy can cause changes in lean body weight (LBW) [17], thus affecting interstitial and extracellular space of parenchymal organs and muscles. Another way in which chemotherapy can cause weight changes is fluid retention [18] thus increasing the interstitial and vascular space. Finally, chemotherapy can induce weight changes by increasing fatty tissue: some chemotherapy regimens contain steroids, which can cause fat deposition [19]. The negative association that we found between BMI and iodine concentration in the aorta, meaning that the lower the BMI the higher the iodine concentration, might be due to different distribution of extracellular fluids in high BMI patients [17-21].
BMI is the most relevant factor affecting the timing of post-contrast enhancement and cardiovascular circulation. Many studies have investigated the effect of body weight on contrast delivery [6,7]. This influence is due to the association of the body weight with the blood volume: since patients with higher BMI have larger blood volumes than patients with smaller BMI [8], contrast medium administered into the blood compartment dilutes more in large patients than in small patients, therefore giving a lower iodine concentration in blood.
On the other hand, a reduction of cardiac output results in delayed CM arrival, higher peak arterial enhancement and prolonged parenchymal enhancement. The slower CM circulates in the vessels and extracellular space, the slower its clearance and the higher its concentration [22]. The factors with the greatest effects on cardiac output are sex and age. It has been demonstrated that the CM bolus arrives slightly earlier in female than in male patients because of a smaller distribution volume in the former.
These parameters should be taken into consideration while obtaining post treatment follow-up DECT scans on cancer patients, to avoid over or under estimation of enhancement and iodine concentration within tumors.
In addition, we proved that there is a negative association between the aortic area and the iodine concentration in the aorta, meaning that smaller ROIs are associated with higher iodine concentration. This might be due to a more turbulent flow, due to an ectatic aorta and atherosclerosis [23], which reduces the iodine concentration. Using four-dimensional flow magnetic resonance imaging, Ha et al exhibited the association of turbulent kinetic energy in old subjects and age-related dilation of the ascending aorta which increases the volume available for turbulence development. [23]. A dilated aorta could also be correlated with a reduced cardiac output and decreased parenchymal delivery of iodine [24]. However, Kidoh et. al showed that cardiac output reduction does not simply result in a paradoxical increase of aortic peak enhancement, but also the magnitude of the effect of cardiac output on aortic peak enhancement depends on the CM injection duration [25].
The third important association we found is a positive association between injection flow rates and iodine concentration, which was expected according to the formula IDR = (I/1000) x FR, since increasing the injection flow rate will increase the delivery contrast in the unit of time [26]. However, on the other hand, Kidoh et. al also showed that using a shorter injection protocol could help not to increase aortic peak enhancement in patient with reduced cardiac outputs, on the expense of decreasing the delivery of contrast [25]
These three associations were strongly supported by the multivariate statistical analysis, with the rate of injection and the BMI overpowering the ROI surface area and time of acquisition.
No association was found between iodine concentration within the muscles and analyzed parameters. This is due to the fact that muscles are not hypervascular structures, and do not act in a fashion similar to hypervascular tumors such as hepatocellular carcinoma (HCC), neuroendocrine tumors (NET), etc.
One limitation of the study is that we did not included direct cardiac function parameters of the patients, such as ejection fraction or echocardiography, due to the difficulty to retrospectively retrieve such parameters in a timeframe close to that of the examination. However, we believe we might have addressed this issue indirectly by studying the BMI effect [6,7] and the aorta surface area which directly correlate with cardiovascular diseases, mainly atherosclerosis [17] and ultimately the ejection fraction. A second limitation might be the fact that we did not use a standardized, predefined and reproducible aorta ROI to every patient (i.e. 100 mm2 ROIs as on smart prep). Instead, ROIs have been drawn tangential to the internal aortic wall. By doing so however, we managed to study the aortic surface parameter, and show its effect on the aorta iodine concentration.
Another limitation is the fact that ROIs measures were not standardized but adapted to patients’ aorta diameters, thus adding a confounding variable.
In conclusion, a number of parameters related to the patient and to the used DECT technique alter the iodine delivery during a post-contrast arterial phase CT scan. These parameters should be taken into account since lower concentration of iodine decreases contrast-to-noise ratio, and in longitudinal follow up studies, this would affect iodine quantitive assessments in cancer patients with frequent chemotherapy-induced variations in BMI and cardiac function.
Acknowledgments
Funding
The authors were equally involved in acquisition of data, analysis and interpretation of data, drafting of the manuscript, critical revision of the manuscript for important intellectual content, statistical analysis, technical, or material support of this study.
Grant support was provided by MSK Cancer Center Support Grant/Core GrantP30 CA008748
Work by GC was partially supported by a scholarship awarded by ISSNAF Imaging Science Chapter.
Footnotes
Declaration of Competing Interest
The authors disclose no conflict of interest. Our institutional review board approved the study with a waiver for informed consents.
References
- [1].Verburg FA, et al. , Body surface area adapted iopromide 300 mg/ml versus 370 mg/ml contrast medium injection protocol: influence on quantitative and clinical assessment in combined PET/CT, Eur. J. Radiol 82 (12) (2013) 2348–2352. [DOI] [PubMed] [Google Scholar]
- [2].Tsai SD, et al. , Duodenal neuroendocrine tumors: retrospective evaluation of CT imaging features and pattern of metastatic disease on dual-phase MDCT with pathologic correlation, Abdom. Imaging 40 (5) (2015) 1121–1130. [DOI] [PMC free article] [PubMed] [Google Scholar]
- [3].Hendriks BM, et al. , Individually tailored contrast enhancement in CT pulmonary angiography, Br. J. Radiol 89 (1061) (2016) 20150850. [DOI] [PMC free article] [PubMed] [Google Scholar]
- [4].Heusch P, et al. , Evaluation of a high iodine delivery rate in combination with low tube current for dose reduction in pulmonary computed tomography angiography, J. Thorac. Imaging 29 (5) (2014) 293–297. [DOI] [PubMed] [Google Scholar]
- [5].Lell MM, et al. , Relationship between low tube voltage (70 kV) and the iodine delivery rate (IDR) in CT angiography: an experimental in-vivo study, PLoS One 12 (3) (2017) e0173592. [DOI] [PMC free article] [PubMed] [Google Scholar]
- [6].Bae KT, Intravenous contrast medium administration and scan timing at CT: considerations and approaches, Radiology 256 (1) (2010) 32–61. [DOI] [PubMed] [Google Scholar]
- [7].Bae KT, Heiken JP, Brink JA, Aortic and hepatic contrast medium enhancement at CT. Part I. Prediction with a computer model, Radiology 207 (3) (1998) 647–655. [DOI] [PubMed] [Google Scholar]
- [8].Wiig H, Luft FC, Titze JM, The interstitium conducts extrarenal storage of sodium and represents a third compartment essential for extracellular volume and blood pressure homeostasis, Acta Physiol. (Oxf) 222 (3) (2018). [DOI] [PubMed] [Google Scholar]
- [9].Johnson TR, Dual-energy CT, General principles, AJR Am. J. Roentgenol 199 (5 Suppl) (2012) S3–8. [DOI] [PubMed] [Google Scholar]
- [10].Agrawal MD, et al. , Oncologic applications of dual-energy CT in the abdomen, Radiographics 34 (3) (2014) 589–612. [DOI] [PubMed] [Google Scholar]
- [11].Song KD, et al. , Utility of iodine overlay technique and virtual unenhanced images for the characterization of renal masses by dual-energy CT, AJR Am. J. Roentgenol 197 (6) (2011) W1076–82. [DOI] [PubMed] [Google Scholar]
- [12].Schvartsman G, et al. , Association between weight gain during adjuvant chemotherapy for early-stage breast cancer and survival outcomes, Cancer Med. 6 (11) (2017) 2515–2522. [DOI] [PMC free article] [PubMed] [Google Scholar]
- [13].Grabowski JP, et al. , Impact of body mass index (BMI) on chemotherapy-associated toxicity in ovarian Cancer patients. a pooled analysis of the north-eastern german society of gynecological oncology (NOGGO) databank on 1,213 patients, Anticancer Res. 38 (10) (2018) 5853–5858. [DOI] [PubMed] [Google Scholar]
- [14].Cong Z, Wang D, Cao Y, The relationship between body mass index changes during chemotherapy and prognosis of patients with advanced colorectal cancer: a retrospective cohort study, Medicine (Baltimore) 97 (22) (2018) e10843. [DOI] [PMC free article] [PubMed] [Google Scholar]
- [15].Kang J, et al. , Body mass index and weight change during initial period of chemotherapy affect survival outcome in advanced biliary tract cancer patients, PLoS One 13 (4) (2018) e0195118. [DOI] [PMC free article] [PubMed] [Google Scholar]
- [16].Awai K, et al. , The optimal body size index with which to determine iodine dose for hepatic dynamic CT: a prospective multicenter study, Radiology 278 (3) (2016) 773–781. [DOI] [PubMed] [Google Scholar]
- [17].Horowitz NS, Wright AA, Impact of obesity on chemotherapy management and outcomes in women with gynecologic malignancies, Gynecol. Oncol 138 (1) (2015) 201–206. [DOI] [PMC free article] [PubMed] [Google Scholar]
- [18].Ho MY, Mackey JR, Presentation and management of docetaxel-related adverse effects in patients with breast cancer, Cancer Manag. Res 6 (2014) 253–259. [DOI] [PMC free article] [PubMed] [Google Scholar]
- [19].Tchernof A, et al. , Androgens and the regulation of adiposity and body fat distribution in humans, Compr. Physiol 8 (4) (2018) 1253–1290. [DOI] [PubMed] [Google Scholar]
- [20].Deepika C, Murugesan M, Shastry S, Effect of pre-donation fluid intake on fluid shift from interstitial to intravascular compartment in blood donors, Transfus. Apher. Sci 57 (1) (2018) 54–57. [DOI] [PubMed] [Google Scholar]
- [21].Seo HS, et al. , Extracellular fluid adjusted for body size is contracted in hypertension, Hypertens. Res 36 (10) (2013) 916–921. [DOI] [PubMed] [Google Scholar]
- [22].Rist C, et al. , Contrast bolus optimization for cardiac 16-slice computed tomography: comparison of contrast medium formulations containing 300 and 400 milligrams of iodine per milliliter, Invest. Radiol 41 (5) (2006) 460–467. [DOI] [PubMed] [Google Scholar]
- [23].Ha H, et al. , Age-related vascular changes affect turbulence in aortic blood flow, Front. Physiol 9 (2018) 36. [DOI] [PMC free article] [PubMed] [Google Scholar]
- [24].Numata S, et al. , Blood flow analysis of the aortic arch using computational fluid dynamics, Eur. J. Cardiothorac. Surg 49 (6) (2016) 1578–1585. [DOI] [PubMed] [Google Scholar]
- [25].Kidoh M, et al. , Paradoxical Effect of Cardiac Output on Arterial Enhancement at Computed Tomography: Does Cardiac Output Reduction Simply Result in an Increase in Aortic Peak Enhancement? J. Comput. Assist. Tomogr 41 (3) (2017) 349–353. [DOI] [PubMed] [Google Scholar]
- [26].Buijs SB, et al. , Systematic review of the safety and efficacy of contrast injection via venous catheters for contrast-enhanced computed tomography, Eur. J. Radiol. Open 4 (2017) 118–122. [DOI] [PMC free article] [PubMed] [Google Scholar]


