

Abstract
Summary
As large-scale metabolic phenotyping studies become increasingly common, the need for systemic methods for pre-processing and quality control (QC) of analytical data prior to statistical analysis has become increasingly important, both within a study, and to allow meaningful inter-study comparisons. The nPYc-Toolbox provides software for the import, pre-processing, QC and visualization of metabolic phenotyping datasets, either interactively, or in automated pipelines.
Availability and implementation
The nPYc-Toolbox is implemented in Python, and is freely available from the Python package index https://pypi.org/project/nPYc/, source is available at https://github.com/phenomecentre/nPYc-Toolbox. Full documentation can be found at http://npyc-toolbox.readthedocs.io/ and exemplar datasets and tutorials at https://github.com/phenomecentre/nPYc-toolbox-tutorials.
1 Introduction
Metabolic phenotyping offers a powerful window into gene-environment interactions (Nicholson et al., 2012). Inter-study comparison in the field is complicated by the diversity of analytical platforms used to generate data, and the lack of standard quality criteria. Standards are emerging around the most common platforms: Nuclear Magnetic Resonance spectroscopy (NMR), and hyphenated-Mass Spectrometry (MS), and procedures for the acquisition of profiles from human biofluid samples in particular are well established (Dona et al., 2014; Lewis et al., 2016). However, QC in profiling studies has typically been conducted on an ad-hoc basis in individual studies, although there is an increasing push towards the systematization and automation of pre-processing procedures (Giacomoni et al., 2015; van Rijswijk et al., 2017).
The toolbox presented here provides software for pre-processing, QC and visualization of metabolic profiling datasets, embodying the MRC-NIHR National Phenome Centre (NPC) practices and focusing on the interpretability of the output to both data generators and analysts (Fig. 1).
Fig. 1.
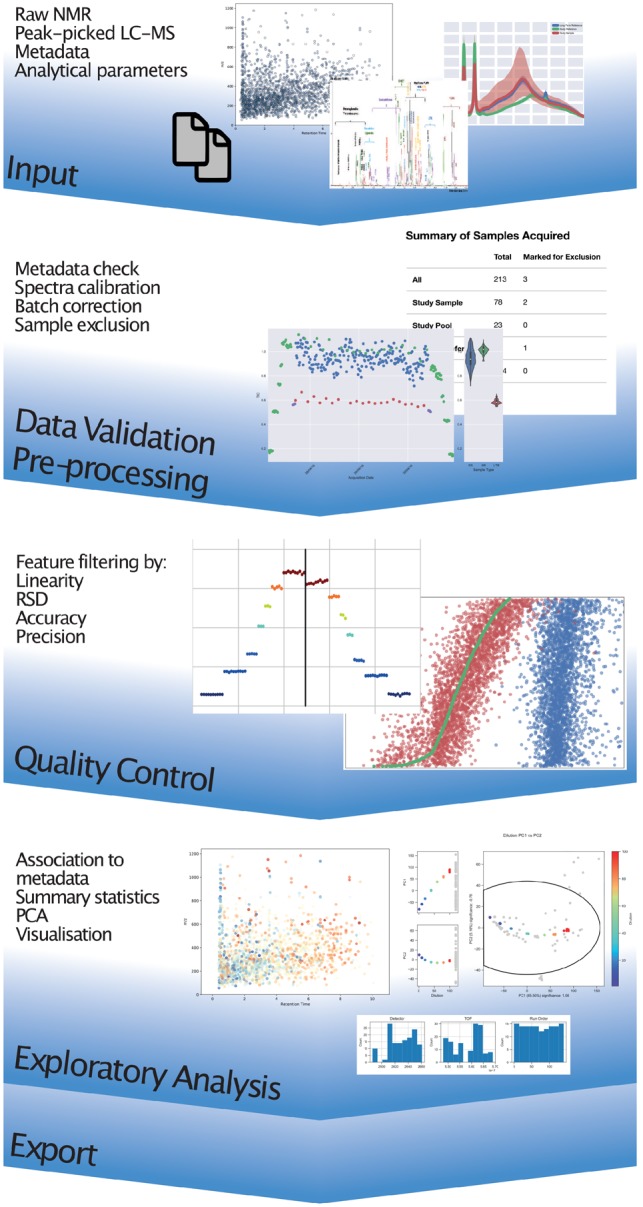
Conceptual diagram outlining the workflow embodied by the toolbox, from import of raw or feature-extracted datasets, preprocessing and filtering, QC, visualization and export
2 The nPYc-Toolbox
2.1 Implementation
The toolbox is designed to allow reproducible processing of datasets with minimal reliance on human judgement during the process. It may be used interactively (e.g. in a Jupyter notebook, for which tutorials are provided), or as an API in automated workflows. It is coded in Python 3.6. To account for the differing processing workflows expected of the common analytical datasets outlined above, the toolbox subclasses its Dataset object; the NMRDataset encapsulates methods for handling spectral NMR data; MSDataset for discretely measured (peak-picked) hyphenated-MS profiling datasets; and TargetedDataset for targeted, quantified datasets, derived from MS, NMR or any other analytical platform.
2.2 Features
Dataset objects are initialized from raw (Bruker NMR) or feature-extracted data [outputs of software such as XCMS (Tautenhahn et al., 2008), Progenesis QITM, TargetLynxTM, &c], and associated with study design parameters or metadata read directly from the raw data or from csv files. The csv template is structured so that each row corresponds to a sample, and columns contain a set of mandatory fields, and any other user required metadata. The role that each sample plays in the assay and its pre-processing is delineated using a standardized nomenclature.
Routines for pre-processing 1D NMR spectra by the automated calculation of QC metrics assessing line-width, water suppression and baseline stability are implemented (as described by Dona et al., 2014). Current best-practices in QC of profiling LC-MS (Broadhurst et al., 2018; Dunn et al., 2011; Lewis et al., 2016; Want et al., 2010) include repeated injections of pooled quality control samples, and a serial dilution of the reference sample to calculate per feature analytical precision and linearity of response. Correction of run-order effects follows an adapted version of the LOWESS approach proposed by Dunn et al. (2011). The targeted pre-processing module contains a set of reports and data consistency checks, to assist analysts in assessing the presence of batch effects, standardizing the linearity range over multiple batches, and visualizing the distribution ranges of samples assayed and relationships within the limits of quantification.
Exploratory data analysis with PCA is used to assess the impact of the QC choices on the final dataset, and screen for associations between acquisition parameters and study factors.
Parameter sets can be specified as JSON dictionaries, allowing simple automation and generation of standardized workflows with basic auditing of all manipulations in a dataset. This toolbox can therefore be used to ensure reproducible pre-processing and quality control. Processed datasets can be exported as csv files in a number of different formats.
3 Conclusion
The nPYc-Toolbox supports both profiling and targeted metabolic phenotyping datasets, and provides tools for pre-processing, quality control and visualization.
Funding
This work was supported by the Medical Research Council and National Institute for Health Research [grant number MC_PC_12025] through funding for the MRC-NIHR National Phenome Centre, infrastructure support was provided by the NIHR Imperial Biomedical Research Centre and PhenoMeNal, European Commission Horizon2020 programme, grant agreement number 654241.
Conflict of Interest: none declared.
References
- Broadhurst D. et al. (2018) Guidelines and considerations for the use of system suitability and quality control samples in mass spectrometry assays applied in untargeted clinical metabolomic studies. Metabolomics, 14, 72.. [DOI] [PMC free article] [PubMed] [Google Scholar]
- Dona A.C. et al. (2014) Precision high-throughput proton NMR spectroscopy of human urine, serum, and plasma for large-scale metabolic phenotyping. Anal. Chem., 86, 9887–9894. [DOI] [PubMed] [Google Scholar]
- Dunn W.B. et al. (2011) Procedures for large-scale metabolic profiling of serum and plasma using gas chromatography and liquid chromatography coupled to mass spectrometry. Nat. Protoc., 6, 1060–1083. [DOI] [PubMed] [Google Scholar]
- Giacomoni F. et al. (2015) Workflow4metabolomics: a collaborative research infrastructure for computational metabolomics. Bioinformatics, 31, 1493–1495. [DOI] [PMC free article] [PubMed] [Google Scholar]
- Lewis M.R. et al. (2016) Development and application of ultra-performance liquid chromatography–TOF MS for precision large scale urinary metabolic phenotyping. Anal. Chem., 88, 9004–9013. PMID: 27479709. [DOI] [PubMed] [Google Scholar]
- Nicholson J. et al. (2012) Metabolic phenotyping in clinical and surgical environments. Nature, 491, 384–392. [DOI] [PubMed] [Google Scholar]
- Tautenhahn R. et al. (2008) Highly sensitive feature detection for high resolution LC/MS. BMC Bioinformatics, 9, 504.. [DOI] [PMC free article] [PubMed] [Google Scholar]
- van Rijswijk M. et al. (2017) The future of metabolomics in elixir. F1000Research, 6, 1649.. [DOI] [PMC free article] [PubMed] [Google Scholar]
- Want E.J. et al. (2010) Global metabolic profiling procedures for urine using UPLC–MS. Nat. Protoc., 5, 1005–1018. [DOI] [PubMed] [Google Scholar]