

Summary
Regulatory T (Treg) cells induce immunologic tolerance by suppressing effector functions of conventional lymphocytes in the periphery. On the other hand, immune silencing is mediated by recognition of phosphatidylserine (PS) on apoptotic cells by phagocytes. Here we describe expression of the PS‐binding protein Annexin V (ANXA5) in CD4+ CD25hi Treg cells at the mRNA and protein levels. CD4+ ANXA5+ T cells constitute about 0·1%–0·6% of peripheral blood CD3+ T cells, exhibit co‐expression of several Treg markers, such as Forkhead box P3, programmed cell death protein‐1, cytotoxic T‐lymphocyte antigen‐4 and CD38. In vitro, ANXA5+ Treg cells showed enhanced adhesion to PS+ endothelial cells. Stimulated by anti‐CD3 and PS+ syngeneic antigen‐presenting cells CD4+ ANXA5+ T cells expanded in the absence of exogenous interleukin‐2. CD4+ ANXA5+ T cells suppressed CD4+ ANXA5− T‐cell proliferation and mammalian target of rapamycin phosphorylation, partially dependent on cell contact. CD4+ ANXA5+ T‐cell‐mediated suppression was allo‐specific and accompanied by an increased production of anti‐inflammatory mediators. In vivo, using a model of delayed type hypersensitivity, murine CD4+ ANXA5+ T cells inhibited T helper type 1 responses. In conclusion, we report for the first time expression of ANXA5 on a subset of Treg cells that might bridge classical regulatory Treg function with immune silencing.
Keywords: regulation, suppression, T cells
We report the expression of Annexin V (ANXA5) on 0.1%–0.6% of human peripheral blood T cells. These CD4+ ANXA5+ T cells expand in the presence of anti‐CD3 stimulation and syngeneic phosphatidylserinepositive antigen‐presenting cells but in the absence of exogenous interleukin‐2; and efficiently suppress the proliferation of CD4+ ANXA5− T cells by mechanisms involving mTOR major histocompatibility complex. In vivo, murine CD4+ ANXA5+ T cells inhibit the T helper type 1 responses in a model of delayed‐type hypersensitivity.
Abbreviations
- ANXA5
Annexin V
- ANXA5−
CD4+ ANXA5− T cells
- ANXA5+
CD4+ ANXA5+ T cells
- APC
antigen‐presenting cells
- Conv
conventional
- CTLA‐4
cytotoxic T‐lymphocyte antigen‐4
- DPBS
Dulbecco’s phosphate‐buffered saline free of calcium and magnesium
- DTH
delayed type hypersensitivity
- FACS
fluorescence‐activated cell sorting
- FITC
fluorescein isothiocyanate
- Foxp3
forkhead box P3
- GZ‐B
granzyme B
- HAEC
human aortic endothelial cells
- HPF
high‐power field
- IL‐2
interleukin‐2
- LN
lymph node
- mAb
monoclonal antibody
- mTOR
mammalian target of rapamycin
- PBMC
peripheral blood mononuclear cells
- PD‐1
programmed cell death protein‐1
- PE
phycoerythrin
- PFA
paraformaldehyde
- pmTOR
phosphorylated mammalian target of rapamycin
- PS
phosphatidylserine
- Teff cells
fffector T cells
- Th1
T helper type 1
- TGF‐β1
transforming growth factor β1
- Treg cells
regulatory T cells
Introduction
Annexins (ANXA) are a conserved family of Ca2+‐binding proteins well known to associate with membranes in order to regulate membrane‐related events, such as trafficking in endocytosis and exocytosis and membrane microdomain organization.1, 2 ANXA5 (synonyms: lipocortin V, endonexin II, calphobindin I, placental anticoagulant protein I, thromboplastin inhibitor, vascular anticoagulant α, anchorin CII, placental protein 4) is a highly conserved protein which binds to acidic phospholipids, such as phosphatidylserine (PS), in a Ca2+‐dependent manner.3, 4, 5 The molecular structure of ANXA5 is characterized by folding into four repeats each consisting of five α ‐helices wound into a right handed superhelix.6 ANXA5 is expressed intracellularly in many different tissues7 but was also found extracellularly.8 Among leukocytes, protein expression of ANXA5 was shown in lymphocytes and monocytes,9 whereas mRNA was also detected in other immune cells (http://biogps.org/#goto=genereport&xml:id=308). It is not clear yet whether ANXA5 is expressed on the cell membrane or, for example, secreted and then bound by other membrane components such as PS. Nevertheless, ANXA5 has been detected on the surface of cells fulfilling a barrier function such as trophoblast or placental endothelial cells,7, 10 or bound to membrane patches expressing PS.11 Both pro‐inflammatory12, 13, 14, 15 and anticoagulant16, 17 activities of ANXA5 were postulated. Supporting the latter notion, anti‐ANXA5 antibodies seem to play a role in the antiphospholipid antibody syndrome, which is associated with recurrent thrombosis and pregnancy loss.18 In contrast, anti‐inflammatory activities of ANXA5 have been reported, such as inhibition of protein kinase C,19 neutrophil accumulation in inflamed tissue,20 and dendritic cells when expressed on the cell membrane of early apoptotic cells.21 However, the exact immunologic role of ANXA5 remains elusive.
Recognition of PS on apoptotic cells by phagocytes is a well‐described immune silencing process characterized by the release of anti‐inflammatory mediators.22, 23 A similar silencing process is exploited by PS‐expressing pathogens during the course of infection.24 Recognition of PS is mediated via different PS receptors, including brain‐specific angiogenesis inhibitor 1,25 T‐cell immunoglobulin and mucin‐domain‐containing molecule 4,26, 27 stabilin‐228, 29 or the receptor for advanced glycation end products.30 In addition, secreted proteins such as milk fat globulin E8,31 growth arrest specific 6 and protein S serve as bridging molecules by binding PS on the apoptotic cell and their specific receptor on the phagocyte, thereby inducing engulfment.32, 33, 34, 35 In contrast, soluble ANXA5 does not act as a bridging molecule but inhibits efferocytosis by masking PS expressed on apoptotic cells.12, 36 To the best of our knowledge, membrane‐associated ANXA5 has never been studied as a PS receptor on T cells.
Treg cells play a key role in maintaining immune tolerance and homeostasis by controlling the development and expansion of T helper cells.37, 38 Treg cells are basically categorized into two major subgroups.39 First, naturally occurring Foxp3+ CD25+ Treg cells (referred to here as Treg), which develop in the thymus and are present in naive individuals upon birth; second, inducible Treg cells, which are generated in the periphery under various tolerogenic conditions.14 Treg cell induction depends on both cell‐contact‐independent40, 41 and antigen‐specific molecular interactions.42 In vivo, apoptotic cells indirectly induce antigen‐specific Treg cells via the release of transforming growth factor‐β1 (TGF‐β 1) by phagocytes.43 However, cell contact‐dependent mechanisms of Treg cell induction involving apoptotic cells have not been described. The therapeutic use of Treg cells to induce tolerance is still limited by questions about safety, dosing, specificity and adjunct immune suppression,44, 45 but also by a certain Treg cell plasticity.46, 47 Moreover, the most reliable Treg marker, Foxp3, is only expressed intracellularly, so is not suitable for Treg cell isolation. The identification of novel Treg cell surface markers for purification and expansion is therefore of great interest.
In the current study, we characterize CD4+ T cells with membrane‐associated ANXA5 (CD4+ ANXA5+ T cells) as a novel immune suppressive cell population. The aim of our study was to investigate membrane‐associated ANXA5 on CD4 T cells and its role in T‐cell activation and proliferation. To avoid any confusion, this work deals with cell‐membrane‐associated ANXA5 on T cells and not with the detection of PS on apoptotic T cells by staining with fluorochrome‐conjugated recombinant ANXA5, as this is often synonymously used in the literature. The phenotype and function of this subset showed a certain overlap with conventional Treg cells (CD4+ CD25high), but also had particular features, e.g. expansion in vitro independent of exogenous interleukin‐2 (IL‐2). CD4+ ANXA5+ T cells down‐regulated CD4+ ANXA5− T‐cell proliferation, and produced IL‐10, granzyme B (GZ‐B) and TGF‐β 1, partially dependent on ANXA5/PS interactions. Furthermore, CD4+ ANXA5+ T cells effectively inhibited T helper type 1 (Th1) ‐mediated immune responses in vivo using a murine model of delayed type hypersensitivity (DTH). Our results suggest a novel regulatory interaction between a subset of apoptotic cells and ANXA5+ CD4+ T cells, possibly mediated by PS.
Materials and methods
Mice
C57BL/6 mice between 6 and 10 weeks of age were purchased (Janvier Labs, Le Genest‐Saint‐Isle, France). Animals were maintained in the animal facility of the University of Geneva and experiments were performed in compliance with all regulations according to the Geneva veterinary authorities (approval by the ethics committee of the Geneva University Medical School, #1081/3928/3).
Cell isolation and expansion
Human peripheral blood mononuclear cells (PBMC) were isolated from buffy coats from healthy volunteers obtained at the Blood Transfusion Center of the University Hospitals Geneva according to a convention for the supply of buffy coats for scientific research. PBMC were separated by density gradient centrifugation (20 min, 20°, 900 g without break) over Ficoll‐Paque™ PLUS (density 1·077 ± 0·001 g/ml; GE Healthcare, Glattbrugg, Switzerland) and unless indicated, cells were washed in Dulbecco’s phosphate‐buffered saline free of calcium and magnesium (DPBS). Platelets were removed by washing twice with DPBS at 200 g, thereafter the cells were resuspended in RPMI‐1640 medium (Gibco, Basel, Switzerland) supplemented with 10% fetal calf serum (Sigma Aldrich, Buchs, Switzerland), 100 µg/ml penicillin and 100 µg/ml streptomycin, 10 mm HEPES (Gibco), and 2 mm l‐alanine and 2 mm l‐glutamine (Biochrome, Schaffhausen, Switzerland). For flow assays and expansion cultures, Treg cells and CD4+ CD25− effector T (Teff) cells were purified from PBMC using a CD4+ CD25+ Treg Isolation Kit® (Miltenyi Biotec, Bergisch Gladbach, Germany) according to the manufacturer’s instructions. For microarray mRNA analysis PBMC were separated into CD4+ and CD4− T cells by applying the autoMacs® Separator (Miltenyi Biotec) using the CD4+ CD25+ Treg Isolation Kit® (Miltenyi Biotec) following the manufacturer’s instructions. In a second step CD4+ CD25hi Treg cells and CD4+ CD25− Teff cells were separated by fluorescence‐activated cell sorting (FACS) using the MoFlo Cell Sorter (Dako‐Cytomation, Hamburg, Germany) obtaining a purity of ≥ 97%.
Both human and murine CD4+ ANXA5+ and CD4+ ANXA5− T cells were isolated using fluorochrome‐coupled anti‐CD4 and anti‐ANXA5 monoclonal antibody (mAb) (clone VAA‐33). CD4+ T cells were first negatively isolated using a magnetic‐activated cell sorting CD4+ T‐cell Isolation Kit (Miltenyi Biotec). Subsequently, CD4+ T cells were sorted for CD4+ ANXA5− or CD4+ ANXA5+ cells using the MoFlo Astrios Cell Sorter (Beckman Coulter, Nyon, Switzerland). The purity obtained was ≥ 96%. For expansion cultures, 1 × 10⁶/ml CD4+ ANXA5− and CD4+ ANXA5+ cells were co‐incubated with 60 Gy γ‐irradiated (Gammacell Elite 3000 Elan) syngeneic or allogeneic PS+ PBMC [from now on referred to as antigen presenting cells (APC) and/or stimulators] and 1 µg/ml anti‐CD3 mAb in 96‐well round‐bottom culture plates (Nunc, Roskilde, Denmark), at a ratio of 1 : 10 and cultured for 14 days. The number of viable cells was determined microscopically in a Neubauer chamber (Omnilab AG, Bremen, Germany).
Microarray analysis
Microarray analysis was performed using sorted human Teff (CD4+ CD25−) and Treg (CD4+ CD25hi) cells that were highly purified as described above (purity ≥ 97%). Cells were cultured for 4 hr at 37° after sorting to let them rest. T cells were centrifuged and the cell pellet was shock frozen in liquid nitrogen. Total RNA was isolated using TRIzol reagent (Invitrogen, Carlsbad, CA), biotin‐labeled and hybridized to Affimetrix Human 1.0 ST Arrays (Affimetrix, San Diego, CA) using standard protocols.48 All microarray data are ‘minimum information about a microarray experiment’ compliant and have been deposited at GEO (GEO number: GPL16239): https://www.ncbi.nlm.nih.gov/geo/query/acc.cgi?acc=GSE41999. Microarray data were analyzed with Affimetrix GeneChip Command Console Software (Affimetrix). The advanced analysis was performed with R (version 2.9) with package limma. Data pre‐processing steps included RMA via usage of the R packages affy and probe summarization via the brainarray‐cdf file version 12.1.0.
SDS‐PAGE and Western blot
CD4+ CD25− and CD4+ CD25hi cells were sorted (105 cells) from two different donors, lyzed by a buffer consisting of 125 mm Tris–HCl pH 7·8, 4% sodium dodecyl sulfate (SDS), 0·1 m dithiothreitol, 20% glycerol and 5% Bromophenol Blue, and analyzed by Western blot using SDS–10% polyacrylamide gel (Bio‐Rad, Hercules, CA). Gels were blotted to nitrocellulose membranes and blocked with 5% skimmed‐milk (Sigma‐Aldrich), followed by a 20‐hr incubation at 4° with monoclonal antibody against human ANXA5 (AbCam, Cambridge, UK; cat# ab54775), and rabbit monoclonal anti‐GAPDH (clone 14C10; Cell signaling Technology Europe B.V., Frankfurt, Germany, cat# 2118), diluted 1 : 500 and 1 : 1000, respectively. As secondary horseradish peroxidase‐conjugated antibodies were used: horse anti‐mouse IgG (H + L chain; Cell Signaling, cat# 7076) and goat anti‐rabbit IgG (H + L chain; Cell Signaling, cat# 7074), both at 1 : 1000. Enhanced chemiluminescence (ECL) reagent (Millipore Corporation, Billerica, MA, and Thermo Fisher Scientific, Waltham, MA) was used as detection substrate and images captured by Fusion FX7 (Vilber Lourmat, Eberhardzell, Germany). The density of each band was measured by bio‐1D software (Vilber Lourmat).
Flow cytometry
Cell surface staining was performed using fluorescein isothiocyanate (FITC), phycoerythrin (PE) or allophycocyanin‐conjugated antibodies. Anti‐ANXA5 (VAA‐33, AbCam), CD3 (UCHT1, BD Biosciences, Allschwill, Switzerland), CD4 (RPA‐T4, BioLegend, Luzern, Switzerland; or RM4‐5, BD Biosciences), CD25 (4E3, BD Biosciences), CD36 (CB38, BD Biosciences), CD38 (HIT2, BioLegend), CD117 (104D2, BioLegend), CD152 (cytotoxic T‐lymphocyte antigen 4; CTLA‐4) (L3D10, BioLegend), CD278 (DX29, BD Biosciences), CD279 (PD‐1) (EH12.2H7, BioLegend), CD314 (BAT221, Miltenyi Biotec), CD328 (6‐434, BioLegend) mAb were used. Before FACS analysis of murine cells, antibody mixtures against CD16/CD32 (2.4G2, NA/LE, BD Biosciences) were used to block unspecific binding by Fc‐receptors. To exclude dead cells, samples were co‐stained with propidium iodide. Isotype control antibodies were all purchased from BD Biosciences (mouse IgG1 FITC and PE; mouse IgG2b PE; rat IgG1 allophycocyanin, rat IgG2b allophycocyanin, rat IgG2a FITC, rat IgG2a PE). All surface staining was performed in FACS buffer (DPBS free of calcium and magnesium, 0·5% bovine serum albumin).
Intracellular staining was performed according to the manufacturer’s recommendations (eBioscience, San Diego, CA). For the detection of intracellular cytokines, cells were cultured for the final 6 hr with the protein transport inhibitor monensin (Golgi Stop, BD Biosciences) together with ionomycin (500 ng/ml, Calbiochem, Beeston, UK) and phorbol 12‐myristate 13‐acetate (25 ng/ml, Sigma). For all intracellular staining, cells were fixed and permeabilized with eBioscience Cytofix/Cytoperm buffer according to the manufacturer’s instructions followed by staining with antibodies against IL‐10 (JES3‐19F1, PE, BioLegend), GZ‐B (GB11, PE, eBioscience), interferon‐γ (IFN‐γ) (XMG1.2, allophycocyanin, BD Biosciences), CD40L (CD154) (MR1, PE, BD Biosciences), phosphorylated mammalian target of rapamycin (pmTOR) primary mAb (Ser2448, Cell Signaling) followed by goat anti‐rabbit secondary antibody (allophycocyanin, Molecular Probes, Eugene, OR) or forkhead box P3 (Foxp3) (236A/E7, PE, eBioscience) in Perm/Wash buffer (eBioscience) for 30 min at 4°. Stained samples were acquired using FACSCalibur (Becton Dickinson) and analyzed with flowjo software (version 8.7.3; TreeStar Inc., Ashland, OR).
Dynamic adhesion assay of human Treg cells to human endothelium
The adhesion of human Treg cells versus Teff cells to primary human aortic endothelial cells (HAEC) was investigated using a dynamic flow assay as described previously.49 Briefly, confluent HAEC monolayers were cultured on a fibronectin‐coated flow chamber slide (0·2 luer) using a shear stress of 0·7 dyne/cm2 (Ibidi, München, Germany). HAEC were kept either untreated or treated with 0·5% paraformaldehyde (PFA) in DPBS for 6 min at room temperature to induce PS expression. PFA‐treated HAEC or PBMC were controlled for PS expression in comparison to γ‐irradiation (60 Gy) using recombinant ANXA5 conjugated to FITC (eBioscience) and propidium iodide by FACS. Blocking of PS was achieved by treatment of HAEC with 20 µg/ml of human recombinant ANXA5 (recANXA5, BioVision, Milpitas, CA) for 30 min at 4°. Under an inverted phase‐contrast microscope (Zeiss, Axiophot) Treg or Teff cells were perfused at a velocity of 0·14 ml/min across the HAEC monolayer for 5 min followed by a 10 min wash with flow buffer to remove non‐adherent T cells. Thereafter, pictures of 10 random fields were taken with a camera (Nikon, Axiovision). The total number of adherent Treg and Teff cells was evaluated by counting the white dots on light microscopic pictures (Adobe Photoshop CS4 Extended).
In vitro T‐cell proliferation assays
Proliferation assays were performed using human responder CD4+ ANXA5− or CD4+ CD25− T cells labeled with 5 µm of CFSE according to the manufacturer’s recommendations (CellTrace™ CFSE Cell Proliferation Kit; Molecular Probes). Cells were cultured at 2 × 10⁵ cells/200 µl for 5 days at 37° in a humidified atmosphere in 96‐well round‐bottom plates (Nunc) with 60 Gy γ‐irradiated syngeneic or allogeneic APC and 1 µg/ml anti‐CD3 mAb to stimulate proliferation. Suppression of proliferation was analyzed either in the presence of CD4+ ANXA5−/CD4+ ANXA5+ or CD4+ CD25−/CD4+ CD25+ T cells (ratio of responder : APC : potential suppressor cells = 1 : 2 :1). Where indicated, APC were pre‐treated before co‐culturing with 20 µg/1 × 106 cells of recANXA5 (BioVision) for 1 hr at 4° to block PS. Transwell experiments were performed in adapted volumes in flat‐bottom plates (Costar, Buchs, Switzerland) by putting only the suppressive cells or controls into 0·4 µm transwell inserts (Becton Dickinson). Suppression was calculated as the difference of proliferation of each condition compared with the corresponding control proliferation taken as 100%.
TGF‐β1 ELISA
Culture supernatants were analyzed by enzyme‐linked immunosorbent assay (ELISA) to measure human TGF‐β 1 (DuoSet® ELISA Development Systems; R&D Systems, Zug, Switzerland) according to the manufacturer’s instructions.
DTH mouse model
According to a protocol used by Kunzendorf et al.,50 6‐ to 10‐week‐old male C57BL/6 mice (Janvier) were sensitized by intravenous injection of 2 × 10⁵ sheep red blood cells (SRBC) from healthy farm sheep (France) in 50 µl of DPBS. To assess the DTH reaction, mice were challenged 4 days after immunization by injection of 2 × 10⁸ SRBC in 50 µl of DPBS intracutaneously into the left‐hind footpad (specific swelling). Non‐immunized mice were challenged with the same dose of SRBC to determine unspecific swelling. Treatment with sorted murine CD4+ ANXA5+ or CD4+ ANXA5− T cells (5 × 10⁵/50 µl DPBS) was combined with the SRBC challenge. Swelling of the footpad was measured 24 and 48 hr after challenge with a dial gauge caliper (Oditest OD 100 T 50; H.C. Kroeplin, Schüchtern, Germany). Results were calculated by subtracting the non‐specific swelling from the specific increment. Six days after primary immunization, mice were killed, blood was collected, and the left‐hind foot as well as the draining inguinal lymph node (LN) were removed. The latter were weighed and minced through a 70‐µm cell strainer (Becton Dickinson) to obtain single‐cell suspensions. The total cell number of each LN was then counted microscopically (Zeiss). SRBC‐specific production of IFN‐γ by CD4 T cells was measured by in vitro re‐stimulation of inguinal LN‐derived lymphocytes with SRBC and subsequent labeling for CD4 and intracellular CD40L and IFN‐γ using fluorochrome‐conjugated anti‐CD4, anti‐CD40L and anti‐IFN‐γ antibodies (BD Biosciences). Cells were analyzed by a FACSCalibur (Becton Dickinson). For histology, left hind feet were fixed in 10% formaldehyde solution (Sigma), embedded in paraffin and cut into 5‐µm sections for subsequent haematoxylin & eosin staining (core facility for histology, CMU, University of Geneva, Switzerland).
Statistical analysis and calculation of the suppressive activity
Statistical analysis was performed using the two‐sided, paired t‐test. Because of donor‐dependent variations, the P‐values were calculated according to the ‘% of mean’ of the corresponding data. To present the suppressive activity of CD4+ ANXA5+ T cells and conventional Treg cells on T‐cell proliferation the data were transformed by calculating the percentage of inhibition, as reported previously,51 according to the following formula: % suppression = 100 − (% of proliferated cells in the suppression assay/% of proliferated cells in the proliferation assay) × 100. Error bars represent SEM.
Results
Characterization of CD4+ ANXA5+ T cells
At the outset of our study, we searched for a novel cell surface marker on human Treg cells that could be used for purification. A comparison of the gene expression pattern of highly purified FACS‐sorted human CD4+ CD25− Teff versus CD4+ CD25hi Treg cells using microarray analysis (Affimetrix) demonstrated significantly higher expression of ANXA5 mRNA by Treg cells (Fig. 1a). ANXA5 mRNA differential expression was confirmed at protein level in sorted CD4+ CD25− Teff and CD4+ CD25hi Treg cells by Western blot (Fig. 1b), demonstrating a threefold higher expression in Treg cells. Overall, freshly isolated viable human peripheral blood CD4+ ANXA5+ T cells constituted about 0·1%–0·6% of the total CD3+ T‐cell population depending on the donor and antibody used for ANXA5 detection. More specifically, after subtraction of the correspondent isotype controls, we observed 0·23 ± 0·26%; 0·79% (n = 10, mean ± SD; range); and 0·57 ± 0·53%; 1·5% (n = 7, mean ± SD; range) of ANXA5 CD4 double‐positive CD3 T cells following staining with mouse clone VAA‐33 and polyclonal rabbit anti‐ANXA5 antibodies, respectively. Representative FACS dot‐plots are shown in Fig. 1(c) and Fig. S1B (see Supplementary material). As to CD25 co‐staining, 32 ± 24% of the CD4+ ANXA5+ T cells versus 4·2 ± 3·1% of the CD4+ ANXA5− T cells expressed CD25 (Fig. 1d). Furthermore, using the VAA‐33 mAb (AbCam) ANXA5 was found on 59·2 ± 16·0% of CD4+ Foxp3+ Treg cells versus 4·7 ± 2·9% on CD4+ Foxp3− Teff cells by flow cytometry (Fig. 1e, upper panel) as depicted by a representative experiment (Fig. 1e, lower). Further phenotypic analysis of CD4+ ANXA5+ for the expression of CD36, CD38, CD152 (CTLA‐4), CD278, CD279 (PD‐1), CD314 and CD328 is depicted in Fig. 1(f). None of the investigated markers was exclusively expressed on CD4+ ANXA5+ T cells. However, expression of several additional Treg markers, including CTLA‐4, PD‐1 and CD38, was higher on CD4+ ANXA5+ T cells in comparison to CD4+ ANXA5− T cells.
Figure 1.
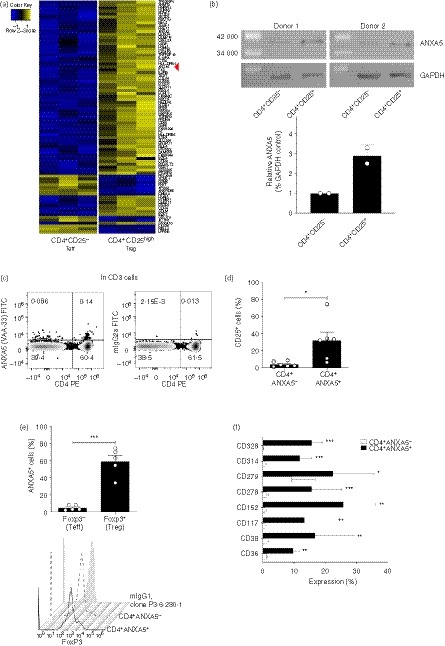
Annexin V (ANXA5) expression by CD4+ T cells and phenotypic characterization of CD4+ ANXA5+ T cells. (a) Sorted regulatory (Treg) and effector (Teff) T cells (purity > 98%) were analyzed by microarray for mRNA expression of a large panel of genes, each lane representing one donor; blue = low expression, yellow = high expression. The line indicated with a red arrowhead represents ‘ANXA5’, which is clearly more highly expressed in Treg cells than in Teff cells. (b), Sorted Treg and Teff cells (purity > 98%) from two different donors were lyzed and loaded in a 10% SDS–PAGE gel, transferred into nitrocellulose membranes and stained with anti‐ANXA5 (mouse monoclonal, ab54775) and anti‐GAPDH (rabbit polyclonal) antibodies. Protein band densitometric analysis of ANXA5 was normalized to their respective GAPDH controls. (c–f), Human peripheral blood mononuclear cells (PBMC) were analyzed by FACS for the expression of surface and intracellular cell markers on different CD4+ T‐cell populations. (c) Representative dot‐plot analysis for CD4 and ANXA5 surface expression as measured by anti‐ANXA5 clone VAA‐33 gated on viable CD3+ (left panel), with the respective isotype controls (right panel). (d) Surface expression of CD25 on CD4+ ANXA5+ and CD4+ ANXA5− T cells shown as bar‐plot, mean ± SEM (n = 6). (e) Bar plots showing the expression of FoxP3 on CD4+ ANXA5+ and CD4+ ANXA5− T cells (upper panel, mean ± SEM, n = 5), representative stagger offset histogram for the intracellular expression of Foxp3 in CD4+ ANXA5+ and CD4+ ANXA5− T cells together with the mouse isotype control IgG1 antibody, clone P3.6.280.1 (lower panel). (f) Phenotypic characterization of CD4+ ANXA5+ (black bars) and CD4+ ANXA5− (white bars) T cells for the expression of CD36, CD38, CD117, CD152, CD278, CD279, CD314 and CD328 shown as mean ± SEM% of expression (n ≥ 3). *P ≤ 0·05, **P ≤ 0·005, ***P ≤ 0·0005.
Taken together, we report for the first time a subpopulation of freshly isolated viable peripheral blood CD4+ T cells with membrane‐associated ANXA5 co‐expressing several well‐described Treg markers.
Expression of PS on HAEC increases adhesion of Treg cells
To investigate whether membrane‐associated ANXA5 on Treg cells interacts with PS on apoptotic endothelial cells, we performed dynamic adhesion assay using HAEC under constant flow as described elsewhere.49 The total number of human Treg cells versus Teff cells that adhered to PS− HAEC, PS+ HAEC, or PS+ HAEC blocked with soluble recombinant ANXA5 (recANXA5) is depicted in Fig. 2(a). Treg (17·58 ± 7·57 absolute counts per high‐power field; HPF) and Teff (15·21 ± 0·86 absolute counts per HPF) cells adhered to a similar extent to PS− HAEC. In contrast, Treg, but not Teff, adhesion was significantly enhanced following PFA treatment to induce the expression of PS on HAEC (50·84 ± 9·49% absolute counts per HPF). PFA treatment not only causes PS expression but also crosslinks cellular membrane components and thereby changes, for example, surface molecule epitopes. Therefore, to address the question whether PS expression promotes Treg cell adhesion, we performed specific blocking of PS with recANXA5 before the flow assay. Indeed, recombinant ANXA5 partially reversed the increased binding of Treg to PS+ HAEC to 27·24 ± 2·61 absolute counts per HPF, representing a 55·06% reduction (Fig. 2a,b). In contrast, adhesion of Teff to PS+ HAEC was not changed by blocking PS with recANXA5. Finally, as ANXA5/PS interactions are Ca2+‐dependent the experiment was also performed in the absence of Ca2+; under this condition increased adhesion to PS+ HAEC was not observed. Taken together, these data provide indirect evidence that Ca2+‐dependent interactions between PS receptors, potentially including ANXA5, on Treg cells and PS on endothelial cells enhance adhesion.
Figure 2.
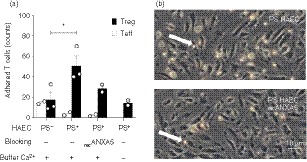
Dynamic regulatory T (Treg) cell adhesion to phosphatidylserine‐positive (PS+) human aortic endothelial cells (HAEC) depends on PS and Ca2+. Dynamic flow assays were performed in flow chambers using human CD4+ CD25+ Treg cells and CD4+ CD25− effector T (Teff) cells and monolayers of either viable PS− HAEC, or early apoptotic PS+ HAEC. As indicated, the assays were performed using Ca2+‐containing buffer or Ca2+‐free buffer, and blocking with recombinant annexin V (recANXA5). (a) Bar‐plot showing the absolute counts per high‐power field of adherent Teff cells (open bars) and Treg cells (close bars) ± SEM, (n = 2 or n = 3). (b) Representative light microscopic image of Treg cells adhering to PS+ HAEC (upper panel) and PS+ HAEC recANXA5 (lower panel). Adherent Treg cells are visible as white bright round cells and shown by the white arrows; score bar 10 µm.
Allogeneic and syngeneic expansion of CD4+ ANXA5+ T cells in vitro is independent of exogenous IL‐2
To overcome the fact that CD4+ ANXA5+ T cells comprise only a small subpopulation of peripheral blood CD4+ T cells, sorted and CFSE‐labeled CD4+ ANXA5+ T cells were expanded in vitro. In the absence of exogenous IL‐2, surprisingly and in strong contrast to conventional Treg cells (0·35 ± 0·15% of proliferation), up to 45 ± 5% of CD4+ ANXA5+ T cells proliferated during a 5‐day culture in the presence of syngeneic irradiated PS+ APC and anti‐CD3 mAb. A representative FACS histogram is shown in Fig. 3(a). Furthermore, to analyze allo‐specificity sorted CD4+ ANXA5+ T cells were expanded in co‐cultures in the presence of either allogeneic or syngeneic γ‐irradiated PS+ APC over 14 days in the absence of exogenous IL‐2 following a previously published protocol.52 Viable absolute cell counts showed a 9·75 ± 1·7‐fold increase of allogeneic stimulated CD4+ ANXA5+ T cells after 2 weeks of culture, whereas syngeneic stimulated cells expanded only 4 ± 0·5‐fold (Fig. 3b). Phenotypic analysis of expanded CD4+ ANXA5+ T cells showed high variations between different donors and a partial loss of membrane‐associated ANXA5 (41·21 ± 22·03%), expression of Foxp3+ was found on 46·12 ± 17·64%, and double expression of ANXA5+ and FoxP3 on 36·07 ± 16·87% of the cells, respectively (Fig. 3c). In summary, sorted CD4+ ANXA5+ T cells can be expanded in vitro without addition of IL‐2 in the presence of both syngeneic and allogeneic PS+ APC; however, we observed a partial loss of membrane‐associated ANXA5.
Figure 3.
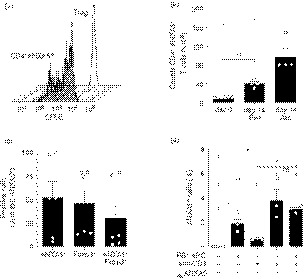
Expansion of CD4+ ANXA5+ T cells occurs independently of exogenous interleukin‐2 (IL‐2). (a–d) Sorted CD4+ CD25high [regulatory T (Treg) cells] or CD4+ ANXA5+ T cells were labeled with CFSE and cultured in vitro in the presence of syngeneic (Syn) or allogeneic (Allo) phosphatidylserine‐positive (PS+) antigen‐presenting cells (APC) and/or anti‐CD3 monoclonal antibody (mAb) for 7 or 14 days; and analyzed by flow cytometry. (a) Representative stagger offset histogram overlay for the proliferation of Treg (solid line) and CD4+ ANXA5+ T cells (gray, shaded) detecting CFSE dilution after 5 days of culture stimulated by syngeneic PS+ APC and anti‐CD3 mAb in the absence of IL‐2 (n = 3). (b) Total cell counts of freshly sorted CD4+ ANXA5+ T cells at day 0 or after 14 days after stimulation with either Syn or Allo PS+ APC. Bars show the mean cell counts of CD4+ ANXA5+ T cells ± SEM (n = 4), *P ≤ 0·05, **P ≤ 0·005. (c) Expression of Foxp3 and annexin V (ANXA5) analyzed 14 days after in vitro expansion of sorted CD4+ ANXA5+ T cells, using Syn PS+ APC and anti‐CD3 stimulation. The percentage of ANXA5+, Foxp3+ or ANXA5+ Foxp3+ double‐positive cells is shown. Bars show the mean percentage ± SEM (n = 6). (d) Sorted CD4+ ANXA5− T cells were stimulated for 7 days with Syn PS− APC; PS+ APC; anti‐CD3 or recombinant ANXA5 (recANXA5) alone or in combination as depicted in the plot. Bars show the mean of the percentage of cells expressing ANXA5 ± SEM (n = 3), *P ≤ 0·05, **P ≤ 0·005.
To further test whether membrane‐associated ANXA5 can be induced on T cells in vitro, sorted CD4+ ANXA5− T cells were co‐cultured with syngeneic γ‐irradiated PS+ APC and anti‐CD3 mAb for 7 days. ANXA5 increased slightly from 0% immediately after sorting up to 1·87 ± 0·32%, 0·59 ± 0·03%, 3·79 ± 0·77% and 3·07 ± 0·13% when co‐cultured with PS+ APC, anti‐CD3 alone, PS+ APC together with anti‐CD3, and PS+ APC blocked with recANXA5 + anti‐CD3, respectively (Fig. 3d). Blocking of PS by recANXA5 did not significantly reverse the induction of membrane‐associated ANXA5 on CD4+ ANXA5− T cells.
CD4+ ANXA5+ T cells specifically suppress allogeneic CD4+ ANXA5− Teff cell proliferation in a cell‐contact‐dependent manner
Soluble ANXA5 is reported to play a role in both anti‐inflammatory responses12, 19 and pro‐inflammatory responses.14, 15 Therefore, the effect of freshly sorted CD4+ ANXA5+ T cells, in vitro expanded CD4+ ANXA5+ T cells, and conventional CD4+ CD25+ Treg cells on the proliferation of corresponding CD4+ ANXA5− or CD4+ CD25− Teff cells was tested. Teff proliferation was induced by 5 days of stimulation with allogeneic PS+ APC and anti‐CD3. As shown in Fig. 4(a), freshly purified CD4+ ANXA5+ T cells inhibited Teff proliferation (35·6 ± 3·2%) to a similar degree as the conventional CD4+ CD25+ Treg cells (36·3 ± 3·5%). Interestingly, expanded CD4+ ANXA5+ T cells inhibited Teff proliferation even more efficiently (70·7 ± 9·4%). To analyze whether CD4+ ANXA5+ T‐cell‐mediated suppression depends on cell contact, transwell experiments were performed. As shown in Fig. 4(a), the suppressive effect mediated by freshly sorted CD4+ ANXA5+ T cells was significantly reduced by 78·4% (7·7 ± 7·4% suppression compared with 35·6 ± 3·2%) when the CD4+ ANXA5+ T cells were not in direct contact with CD4+ ANXA5− Teff cells and PS+ APC. Representative histograms are shown in Fig. 4(b). Hence, the suppressive effect of CD4+ ANXA5+ T cells is not mediated by soluble factors but depends on cell contact.
Figure 4.
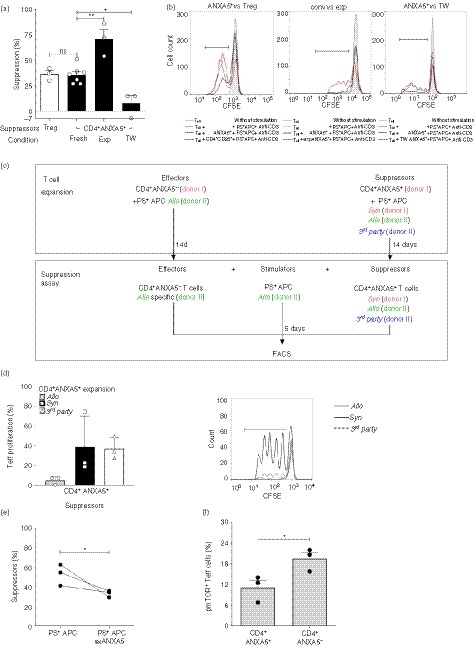
Suppression of effector T (Teff) cell proliferation by CD4+ ANXA5+ T cells is allo‐specific and partially depends on cell‐to‐cell contact and phosphorylated mammalian target of rapamycin (pmTOR) signaling in Teff cells. Suppression of CFSE‐labeled CD4+ ANXA5− (Teff) proliferation by CD4+ ANXA5+ T cells was analyzed by FACS. Suppression was calculated as the difference of proliferation of each condition compared with the corresponding control proliferation stimulated by allogeneic (Allo) PS+ APC and anti‐CD3 mAb taken as 100%. (a) Suppression of Teff proliferation by freshly isolated CD4+ ANXA5+ (fresh), expanded CD4+ ANXA5+ T cells (exp), or CD4+ ANXA5+ T cells separated from Teff cells by a transwell (TW) insert is shown; as suppression control, Teff cells were co‐cultured with freshly isolated CD4+ CD25+ regulatory T (Treg) cells. Bar‐plot shows the mean of percentage of suppression ± SEM (n = 3 for Treg cells, exp CD4+ ANXA5+, and transwell; and n = 7 for fresh CD4+ ANXA5+). *P ≤ 0·05, **P ≤ 0·005. (b) Representative histogram overlays showing the CFSE dilution induced by the proliferation of Teff after 5d stimulation with Allo PS+ APC and anti‐CD3 (CD4+ ANXA5−, red lines) and the suppression in the presence of CD4+ ANXA5+ (solid lines); in addition suppression induced by CD4+ CD25+ Treg (left panel, dashed line); expanded CD4+ ANXA5+ (exp ANXA5+, middle panel, dashed line); and CD4+ ANXA5+ placed in transwells (right panel, dashed line) is shown. (c) Explanatory scheme of the suppression assay using differently expanded CD4+ ANXA5+ T‐cells to demonstrate allo‐specificity. Sorted effector T‐cells (CD4+ ANXA5−, Teff) from donor I were expanded with allogeneic (Allo, donor II) PS+ APC for 14 days. In parallel, sorted CD4+ ANXA5+ T‐cells from donor I were expanded in presence of either syngeneic (Syn, donor I), Allo (donor II), or third party control (3rd party, donor III) PS+ APC for 14 days. For the suppression assay, Teff were then labeled with CFSE and re‐stimulated during 5 days with Allo PS+ APC (donor II) in the presence of CD4+ ANXA5+ T‐cells expanded either with Syn, Allo or 3rd party PS+ APC. The Effector : Stimulator : Suppressor cells ratio was 1 : 2 : 1. (d) Proliferation of Allo‐stimulated CD4+ ANXA5− Teff in the presence of Syn, Allo or 3rd party CD4+ ANXA5+ T‐cells. Bar‐plot (left panel) showing the percentage of proliferation compared to the positive control proliferation in the absence of CD4+ ANXA5+ T‐cells ± SEM (n = 3). A representative proliferation histogram overlay (right panel) showing CFSE‐dilution induced by proliferation of Allo stimulated Teff in the presence of Allo (grey, thick line); Syn (black solid line); 3rd party (dashed line) CD4+ ANXA5+ T cells. (e) Proliferation of Teff cells stimulated with either Allo PS+ APC (PS+ APC) or PS+ APC blocked with recombinant ANXA5 (PS+ APC recANXA5) in the presence of Allo expanded suppressor CD4+ ANXA5+ T cells. Data show the percentage of suppression calculated as described above of individual matched experiments (n = 3), *P ≤ 0·05. (f) Intracellular levels of pmTOR measured in Teff cells after 2 days of co‐culture with CD4+ ANXA5+ T cells (left) or ANXA5− (right). Data are shown as percentage of expression. Bars represent the mean the percentage of positive cells ± SEM, (n = 3). *P ≤ 0·05.
To address the question of whether allogeneic expanded CD4+ ANXA5+ T cells specifically suppress T‐cell proliferation in a major histocompatibility complex‐dependent manner, a complex suppression assay was developed. As depicted in Fig. 4(c), sorted CD4+ ANXA5+ T cells (donor I) were expanded for 14 days in the presence of either syngeneic (donor I), allogeneic (donor II), or third‐party (donor III) control PS+ APC. The differentially expanded CD4+ ANXA5+ T cells were subsequently tested for their suppressive effect on allogeneic (donor II) PS+ APC‐stimulated proliferation of CFSE‐labeled CD4+ ANXA5− Teff cells (donor I) as described in detail in the experimental procedures. As demonstrated in Fig. 4(d), only allogeneic CD4+ ANXA5+ T cells of donor I expanded with PS+ APC of donor II significantly suppressed the proliferation of allogeneic PS+ APC (donor II) ‐stimulated CFSE‐labeled CD4+ ANXA5− Teff cells of donor I (6·37 ± 2·33% of proliferation). In contrast, syngeneic (donor I) expanded CD4+ ANXA5+ T cells (39·05 ± 12·78% of proliferation) and third‐party (donor III) expanded CD4+ ANXA5+ T cells (36·93 ± 6·50% of proliferation) proliferated similarly. This effect could be explained by the competition between allogeneic expanded Teff cells and CD4+ ANXA5+ T cells for the allo major histocompatibility complex of the stimulators or by direct inhibitory effects of CD4+ ANXA5+ T cells. Hence, CD4+ ANXA5+ T cells show allo‐specific T‐cell suppression with an overall reduction of >80%.
ANXA5 binds to PS, expressed by the majority of γ‐irradiated stimulators (APC), so we further investigated the role of ANXA5/PS interactions during cell‐contact‐dependent suppression of T‐cell proliferation by blocking PS with recANXA5 on PS+ APC. Suppression of T‐cell proliferation by fresh CD4+ ANXA5+ T cells was partially reversed by adding recANXA5 (Fig. 4e, showing three independent experiments); with a mean suppression of 32·42% (43·70 ± 10·02% versus 29·52 ± 11·20%). Hence, interactions between PS receptors on CD4+ ANXA5+ T cells, potentially including ANXA5, and PS on APC and/or Teff cells are at least partially responsible for the suppressive activity of CD4+ ANXA5+ T cells.
Modification of mTOR phosphorylation by CD4+ ANXA5+ T cells
To further explore potential down‐stream intracellular signaling pathways of CD4+ ANXA5+ T‐cell‐mediated suppression of Teff proliferation we investigated whether pmTOR was down‐regulated in CD4+ ANXA5− Teff cells. This serine/threonine protein kinase acts as an adenosine triphosphate and amino acid sensor to balance nutrient availability but also to control cell growth and proliferation.53, 54 Intracellular pmTOR expression as measured by FACS staining in CFSE‐labeled CD4+ ANXA5− Teff cells or CD4+ ANXA5+ T cells after a 2‐day cell co‐culture with anti‐CD3 antibody plus Syn PS+ APC was significantly lower in CD4+ ANXA5+ T cells (11·07 ± 2·2%) than in controls (19·45 ± 1·9%), representing a reduction of 41·5 ± 13·6% (Fig. 4f). In conclusion, suppression of T‐cell proliferation by CD4+ ANXA5+ T cells might be mediated, at least partially, through a reduction of pmTOR in Teff cells.
CD4+ ANXA5+ T cells produce inhibitory mediators
In addition to cell‐contact‐dependent mechanisms the production of immunosuppressive and anti‐inflammatory cytokines, such as IL‐10, TGF‐β 1, and GZ‐B is a well‐known mechanism of Treg cell function.55, 56, 57 Therefore, we investigated whether CD4+ ANXA5+ T cells produce regulatory mediators similar to Teff cells (CD4+ ANXA5−) in response to PS+ APC. Culture experiments of either freshly isolated CD4+ ANXA5+ T cells or Teff, both in the presence of Syn PS+ APC and anti‐CD3 mAb showed a ninefold higher intracellular expression of immunosuppressive IL‐10 (5·4 ± 0·5%) and a sixfold higher expression of GZ‐B (9 ± 1·5%) in CD4+ ANXA5+ T cells compared with Teff cells (IL‐10: 0·6 ± 0·2%; GZ‐B: 1·4 ± 0·4%). Blocking with recANXA5 led to a significant decrease of intracellular IL‐10 (3·9 ± 0·6%) and GZ‐B production (7·2 ± 1·9%) in CD4+ ANXA5+ T cells following co‐culture with PS+ APC (Fig. 5a). Moreover, the culture supernatants of these experiments, CD4+ ANXA5+ T cells compared with CD4+ ANXA5− Teff cells, contained higher levels of TGF‐β 1 (436·03 ± 179·49 versus 301·06 ± 172·81 pg/ml); pooled data are shown in Fig. 5(b). Blocking of PS with recANXA5 significantly reduced TGF‐β 1 in CD4+ ANXA5+ T‐cell supernatants (323·27 ± 115·41 pg/ml), but not in CD4+ ANXA5− Teff supernatants. Taken together, CD4+ ANXA5+ T cells produce IL‐10, GZ‐B and TGF‐β 1, partially dependent on interactions with PS.
Figure 5.
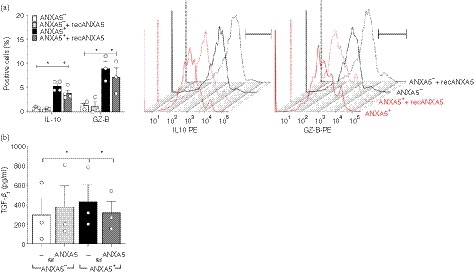
CD4+ ANXA5+ T cells produce inhibitory mediators. (a, b) Purified CFSE‐labeled CD4+ ANXA5− effector T (Teff) cells (ANXA5−) or CD4+ ANXA5+ T cells (ANXA5+) were stimulated with anti‐CD3 monoclonal antibodies (mAb) and co‐cultured with PS+ antigen‐presenting cells (APC) for 3 days, blocking was performed with recombinant annexin V (recANXA5). (a) Summary plot showing the percentage of intracellular expression of interleukin‐10 (IL‐10) and granzyme B (GZ‐B) ± SEM, measured by flow cytometry (n = 3), *P ≤ 0·05 (left). Representative stagger offset histograms showing the relative intracellular staining for IL‐10 (left) and GZ‐B (right) in CD4+ ANXA5+ (red line) in comparison to control CD4+ ANXA5− (Teff, black line) T cells alone or in the presence of recANXA5 (dotted lines) stimulated with anti‐CD3 and Syn γ‐irradiated APC. (b) Secretion of transforming growth factor β 1 (TGF‐β 1) was measured by ELISA in culture supernatants of the above‐mentioned experiments comparing the effect of CD4+ ANXA5− control Teff cells (ANXA5−) with CD4+ ANXA5+ T cells (ANXA5+). Both conditions were carried out without (—) or with blocking with recombinant ANXA5 (recANXA5) as indicated in the plot. Bars represent the mean of TGF‐β 1 in pg/ml ± SEM (n = 3), *P ≤ 0·05.
CD4+ ANXA5+ T cells reduce immune response in a delayed‐type hypersensitivity mouse model
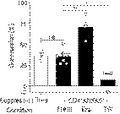
The effect of CD4+ ANXA5+ T cells on Th1‐mediated immune responses in vivo was analyzed using a murine model of DTH.50 As shown in Fig. 6a, intra‐cutaneous injection of sorted murine CD4+ ANXA5+ T‐cells significantly reduced the footpad swelling induced by SRBC after 48 hr (0·13 ± 0·09 mm) in comparison to both positive controls (1·1 ± 0·2 mm) and the CD4+ ANXA5− Teff group (1·2 ± 0·13 mm). Moreover, injection of CD4+ ANXA5+ T‐cells significantly reduced the weight of the draining inguinal LN, from 16·9 ± 2·6 mg to 11·1 ± 1·5 mg (Fig. 6b), the total cell counts, from 8·3 ± 1·78 × 106 to 4·2 ± 0·8 × 106 (Fig. 6c), as well as the size of the draining inguinal LN (Fig. 6d). The intracellular production of IFN‐γ by antigen‐specific re‐stimulated CD4+ CD40L+ T‐cells obtained from the draining LN was reduced from 4·87 ± 1·43% to 0·46 ± 0·29% in the CD4+ ANXA5+ T‐cell treated group, whereas CD4+ ANXA5− Teff cells did not induce significant changes (2·09 ± 0·61%, Fig. 6e). Finally, histologic analysis revealed a clear reduction of inflammatory cellular infiltrates in mice treated with CD4+ ANXA5+ T‐cells, comparable to the negative control group, in strong contrast to positive controls and the CD4+ ANXA5− T‐cell treated animals (Fig. 6f). These results clearly demonstrated that antigen‐unspecific CD4+ ANXA5+ T‐cells effectively suppress Th1‐mediated CD4+ T‐cell immune responses in vivo.
Figure 6.
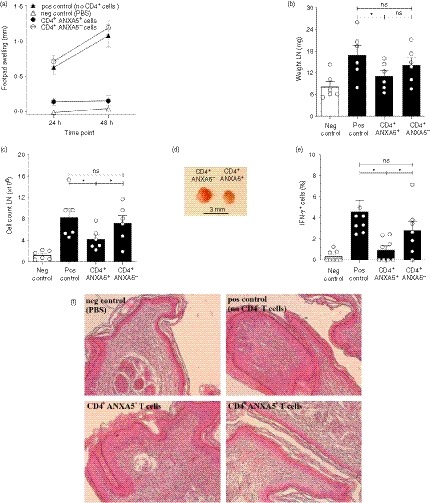
CD4+ ANXA5+ T cells suppress delayed type hypersensitivity (DTH) reactions in vivo. Using a murine model of DTH to investigate the effect of sorted murine CD4+ ANXA5+ T cells on a T helper type 1 (Th1) ‐mediated immune response in vivo, C57BL/6 mice were immunized and challenged with sheep red blood cells (SRBC) as described in the Material and methods section. Four groups of mice were analyzed: (i) Negative control (neg ctrl) were immunized with Dulbecco’s phosphate‐buffered saline free of calcium and magnesium (DPBS) only, (ii) positive control (pos ctrl) were kept untreated following immunization with SRBC, (iii) mice treated with CD4+ ANXA5+ T cells or (iv) mice treated with CD4+ ANXA5− control T cells. (a) Footpad swelling was measured 24 and 48 hr after the challenge (mean ± SEM, n = 7). Six days after immunization mice were killed and draining inguinal lymph nodes (LN) were analyzed (mean ± SEM, n = 8) for (b) weight, and (c) total cell counts (*P ≤ 0·05). (d) Representative picture of the draining inguinal LN obtained from animals treated with CD4+ ANXA5− ctrl (left) or CD4+ ANXA5+ (right) T cells, score bar 3 mm. (e) Intracellular interferon‐γ (IFN‐γ) production by CD4+ CD40L+ T cells from inguinal LN after in vitro re‐stimulation with SRBC in animals belonging to groups (i)–(iv) and analyzed by flow cytometry. Bars represent the mean percentage ± SEM of IFN‐γ‐positive cells (n = 6), *P ≤ 0·05. (f) Haematoxylin & eosin staining of paraffin‐embedded footpads obtained from groups (i)–(iv). The pictures represent the results of one out of seven mice per group at a magnification of 10×.
Discussion
A novel CD4+ T‐cell subpopulation characterized by the expression of membrane associated ANXA5 (CD4+ ANXA5+ T‐cells) is reported. It is of note that soluble fluorescent‐labeled ANXA5 is broadly used as a laboratory marker to stain early apoptotic PS+ cells and that these apoptotic cells are often referred to as ANXA5+ cells. In contrast, the present project aimed to characterize the phenotype and function of CD4+ ANXA5+ T‐cells and addressed the question whether these cells mediate immune silencing via interactions with PS. As to the phenotypic markers of CD4+ ANXA5+ T‐cells they co‐expressed CD25 and FoxP3; showed a higher percentage of expression of CD152 (CTLA‐4), CD279 (PD‐1), and CD38 in comparison to CD4+ ANXA5− Teff but clearly less than conventional Treg.39, 58, 59, 60 CD4+ ANXA5+ T‐cells suppressed CD4+ ANXA5− Teff proliferation in a cell‐contact dependent manner and produced immunoregulatory factors, such as IL‐10, GZ‐B and TGF‐β1. Their suppressive function was partly mediated by interactions with the immune silencing phospholipid PS on APC. Finally, the potential of CD4+ ANXA5+ T‐cells to effectively reduce Th1‐mediated immune responses was demonstrated in vivo.
In contrast to conventional Treg, expansion of CD4+ ANXA5+ T‐cells did not depend on exogenous IL‐2. In general, differentiation of Treg depends on TCR stimulation and cytokines, predominantly on IL‐2.61 Whereas conventional Treg are characterized by high expression of the IL‐2 receptor CD25, only 21 ± 7·2% of CD4+ ANXA5+ T‐cells expressed CD25. Downstream, IL‐2/IL‐2 receptor interactions stimulate growth, differentiation and survival of antigen‐specific CD4+ T‐cells.62, 63, 64 On the one hand, CD4+ ANXA5+ T‐cells might be less dependent on IL‐2 than nTreg according to their lower CD25 expression which eventually might be compensated by other T‐cell growth factors, such as IL‐4, IL‐7, IL‐9 or IL‐27. On the other hand, IL‐2 might have been produced by the cultured cells themselves. Consistent with the latter notion, we observed an 8·6 fold higher IL‐2 secretion by CD4+ ANXA5+ T‐cells in comparison to CD4+ ANXA5− T‐cells in expansion cultures with PS+ APC (data not shown). However, this needs to be addressed in more detail in further studies.
Conventional Treg inhibit T‐cell responses via cell contact‐dependent and ‐independent mechanisms including secretion of suppressive cytokines, IL‐2 consumption, cytotoxicity, and suppression of APC functions such as co‐stimulation and antigen presentation.57, 61 Here we demonstrate that cellular contact with Teff and/or PS+ APC was required for the inhibition of Teff proliferation by CD4+ ANXA5+ T‐cells. Furthermore, blocking PS with recANXA5 partly reversed the inhibitory effect of CD4+ ANXA5+ T‐cells on Teff proliferation as well as production of IL‐10, GZ‐B and TGF‐β1 by CD4+ ANXA5+ T‐cells. Since the blocking effect of recANXA5 was only moderate one could speculate that it was incomplete, e.g. due to additional PS externalization during the course of the experiment after blocking with recANXA5. It is of note, that blocking of PS using recANXA5 might also prevent interactions of PS with other PS receptors than ANXA5, potentially expressed on CD4+ ANXA5+ T‐cells. The latter include brain‐specific angiogenesis inhibitor 1, T‐cell immunoglobulin and mucin‐domain‐containing molecule 4, stabilin‐2 or the receptor for advanced glycation end products. Finally and most likely, CD4+ ANXA5+ T‐cells may interact with other receptors that are not shielded by recANXA5. However, the molecular mechanisms of CD4+ ANXA5+ T‐cell interactions with Teff remain to be studied in detail. Intriguingly, the suppressive capacity of CD4+ ANXA5+ T‐cells increased significantly following in vitro expansion although the overall membrane associated ANXA5 expression decreased. We do not have an explanation for this observation but the detection of potential other ANXA5 receptors on Teff would provide new insights, as previously shown for Annexin I.65 In conclusion, as blocking with recANXA5 could not provide direct evidence we can only speculate whether cell membrane‐associated ANXA5 on CD4+ ANXA5+ T‐cells interacts with PS+ apoptotic cells subsequently inducing tolerogenic signals or immune silencing.
So far, very little is known about the structural details of cell membrane associated ANXA5, in particular interactions with PS. Critical in this respect is the orientation of ANXA5 on the CD4+ ANXA5+ T‐cell surface. Theoretically, ANXA5 could be bound to PS‐patches exposed on the CD4+ ANXA5+ T‐cell surface. Such PS‐exposure on viable cells has been described, e.g., for activated CD8+ T‐cells and platelets.66, 67 In this orientation, however, the PS‐binding sites of surface‐ANXA5 would be occupied and would render any interactions with PS‐expressed on exposing cell surfaces unlikely. A different orientation would imply a kind of membrane‐anchoring partner protein for surface ANXA5, which leaves PS‐binding sites available. However, experiments to address this point were beyond the scope of the present study.
As to the expression and function, ANXA5 was hardly detectable on Jurkat T‐cells but was induced during apoptosis68 similar to Annexin I which was shown to suppress CD8+ T‐cell immunity.21, 69 Another study showed that an ANXA5 mimicking peptide binds to the cytoplasmatic domain of αvβ5 integrin and triggers apoptosis.70 Wen and colleagues suggested that ANXA5 itself may function as a signaling protein involved in the regulation of vascular endothelial cell proliferation.71 Furthermore, ANXA5 has been proposed as a potential tumor marker and seems to contribute to tumor progression and invasion.72 In contrast, soluble ANXA5 was shown to inhibit efferocytosis by blocking the PS‐surface expressing apoptotic cells,36, 73 to serve as a ligand for C1q on apoptotic cells,68 as well as to prevent endotoxemia by inhibiting lipopolysaccharide binding to toll‐like receptor‐4.74 Interestingly, serum levels and gene expression of ANXA5 are decreased in type 1 diabetes75 and addition of soluble ANXA5 to cell cultures induced inflammatory responses of activated macrophages in the presence of apoptotic cells.12
In line with inhibition of the CD4+ T‐cell‐mediated immune response by conventional Treg cells in a DTH mouse model76, 77 we found significant anti‐inflammatory, and immunoprotective, effects of murine antigen‐non‐specific CD4+ ANXA5+ T cells in comparison to CD4+ ANXA5− Teff cells, which did not significantly alter any of the measured parameters observed in the positive control group. On the other hand, we generated alloantigen‐specific CD4+ ANXA5+ T cells in vitro by stimulation with allogeneic PS+ APC. These cells exerted a potent allo‐specific anti‐proliferative effect on Teff cells. Hence, CD4+ ANXA5+ T cells provide both antigen‐unspecific and allo‐specific inhibition of T‐cell responses.
In conclusion, we propose that CD4+ ANXA5+ T cells represent a novel unique Treg cell subset exhibiting similarities to conventional Treg cells but with a distinct phenotype and function. Treg cells are a dynamic population, which would explain the different magnitudes of marker expression as well as differences in their immune suppressive function while nevertheless sharing principal functions and marker. Membrane‐associated ANXA5 on CD4+ ANXA5+ T cells might play a role in silencing, partially interacting with PS, and might be involved in balancing immune regulation to prevent allergies and autoimmune diseases, whereas soluble ANXA5 seems to exert controversial effects by competing with other PS receptors for PS ligation.
Cellular therapy is a promising alternative to replace non‐specific pharmacologic immune suppression used for autoimmune diseases, or to prevent transplant rejection. In this study, we identified CD4+ ANXA5+ T cells as a suitable suppressive T‐cell subset bearing two major advantages in comparison with conventional CD4+ CD25+ Foxp3+ Treg cells. First, ANXA5 serves as a novel cell membrane marker allowing the purification of CD4+ ANXA5+ T cells from peripheral blood. Second, CD4+ ANXA5+ T cells exhibit even stronger inhibitory capacities following expansion without addition of exogenous IL‐2. Thus, our study provides for the first time data that bridge T‐cell‐mediated tolerance mechanisms with PS‐induced immune silencing.
Disclosures
The authors declare no conflict of interest.
Supporting information
Figure S1. Detection of ANXA5 with different anti‐ANXA5 commercially available antibodies.
Acknowledgements
Author contributions: ALB and TB performed the experiments, designed the study and wrote the paper; RP designed the study for microarray comparisons; LP and RC performed the experiments of T‐cell expansions and characterization; NG and KS performed Western blot experiments; GPY performed experiments, data analysis and manuscript preparation; and JDS was involved in experimental design, wrote the paper and gave final approval. This work was funded by the DFG, BO‐3646/1‐1, BO‐3656/1‐1, SFB 654 TP C8, the University of Lübeck (SPP MIA/TP A2), Bollinger 50011 (Klinikum Bayreuth); SNSF grants 310030_159594 and 320030_138376; and a Private Foundation. We thank the Division of Immunology and Allergology of the University Hospitals of Geneva, Switzerland, and members for technical assistance and advice, D. Ehirchiou for technical help with the flow assay experiments, M. Freitas Monteiro and A. Real for PBMC isolation, the Transcriptome Laboratory of the University of Göttingen, G. Salinas‐Riester, C. Pommerenke and L. Opitz for their support with the microarray analysis, and the University of Lübeck, K. Wischnat and S. Gies for cell preparations used in microarray analysis.
References
- 1. Enrich C, Rentero C, Meneses‐Salas E, Tebar F, Grewal T. Annexins: Ca2+ effectors determining membrane trafficking in the late endocytic compartment. Adv Exp Med Biol 2017; 981:351–85. [DOI] [PubMed] [Google Scholar]
- 2. Gerke V, Creutz CE, Moss SE. Annexins: linking Ca2+ signalling to membrane dynamics. Nat Rev Mol Cell Biol 2005; 6:449–61. [DOI] [PubMed] [Google Scholar]
- 3. Crompton MR, Owens RJ, Totty NF, Moss SE, Waterfield MD, Crumpton MJ. Primary structure of the human, membrane‐associated Ca2+‐binding protein p68 a novel member of a protein family. EMBO J 1988; 7:21–7. [DOI] [PMC free article] [PubMed] [Google Scholar]
- 4. Klee CB. Ca2+‐dependent phospholipid‐ (and membrane‐) binding proteins. Biochemistry 1988; 27:6645–53. [DOI] [PubMed] [Google Scholar]
- 5. Patel DR, Isas JM, Ladokhin AS, Jao CC, Kim YE, Kirsch T et al The conserved core domains of annexins A1, A2, A5, and B12 can be divided into two groups with different Ca2+‐dependent membrane‐binding properties. Biochemistry 2005; 44:2833–44. [DOI] [PubMed] [Google Scholar]
- 6. Huber R, Schneider M, Mayr I, Romisch J, Paques EP. The calcium binding sites in human annexin V by crystal structure analysis at 2.0 A resolution. Implications for membrane binding and calcium channel activity. FEBS Lett 1990; 275:15–21. [DOI] [PubMed] [Google Scholar]
- 7. van Heerde WL, de Groot PG, Reutelingsperger CP. The complexity of the phospholipid binding protein Annexin V. Thromb Haemost 1995; 73:172–9. [PubMed] [Google Scholar]
- 8. Romisch J, Schuler E, Bastian B, Burger T, Dunkel FG, Schwinn A et al Annexins I to VI: quantitative determination in different human cell types and in plasma after myocardial infarction. Blood Coagul Fibrinolysis 1992; 3:11–17. [PubMed] [Google Scholar]
- 9. Rothhut B, Comera C, Cortial S, Haumont PY, Le Diep KH, Cavadore JC et al A 32 kDa lipocortin from human mononuclear cells appears to be identical with the placental inhibitor of blood coagulation. Biochem J 1989; 263:929–35. [DOI] [PMC free article] [PubMed] [Google Scholar]
- 10. Rand JH, Wu XX, Andree HA, Lockwood CJ, Guller S, Scher J et al Pregnancy loss in the antiphospholipid‐antibody syndrome–a possible thrombogenic mechanism. N Engl J Med 1997; 337:154–60. [DOI] [PubMed] [Google Scholar]
- 11. Kenis H, van Genderen H, Bennaghmouch A, Rinia HA, Frederik P, Narula J et al Cell surface‐expressed phosphatidylserine and annexin A5 open a novel portal of cell entry. J Biol Chem 2004; 279:52623–9. [DOI] [PubMed] [Google Scholar]
- 12. Bondanza A, Zimmermann VS, Rovere‐Querini P, Turnay J, Dumitriu IE, Stach CM et al Inhibition of phosphatidylserine recognition heightens the immunogenicity of irradiated lymphoma cells in vivo . J Exp Med 2004; 200:1157–65. [DOI] [PMC free article] [PubMed] [Google Scholar]
- 13. Frey B, Schildkopf P, Rodel F, Weiss EM, Munoz LE, Herrmann M et al AnnexinA5 renders dead tumor cells immunogenic – implications for multimodal cancer therapies. J Immunotoxicol 2009; 6:209–16. [DOI] [PubMed] [Google Scholar]
- 14. Roncarolo MG, Battaglia M. Regulatory T‐cell immunotherapy for tolerance to self antigens and alloantigens in humans. Nat Rev Immunol 2007; 7:585–98. [DOI] [PubMed] [Google Scholar]
- 15. Stach CM, Turnay X, Voll RE, Kern PM, Kolowos W, Beyer TD et al Treatment with annexin V increases immunogenicity of apoptotic human T‐cells in Balb/c mice. Cell Death Differ 2000; 7:911–5. [DOI] [PubMed] [Google Scholar]
- 16. Andree HA, Stuart MC, Hermens WT, Reutelingsperger CP, Hemker HC, Frederik PM et al Clustering of lipid‐bound annexin V may explain its anticoagulant effect. J Biol Chem 1992; 267:17907–12. [PubMed] [Google Scholar]
- 17. Romisch J, Heimburger N. Purification and characterization of six annexins from human placenta. Biol Chem Hoppe Seyler 1990; 371:383–8. [DOI] [PubMed] [Google Scholar]
- 18. Amiral J, Peyrafitte M, Dunois C, Vissac AM, Seghatchian J. Anti‐phospholipid syndrome: current opinion on mechanisms involved, laboratory characterization and diagnostic aspects. Transfus Apher Sci 2017; 56:612–25. [DOI] [PubMed] [Google Scholar]
- 19. Schlaepfer DD, Jones J, Haigler HT. Inhibition of protein kinase C by annexin V. Biochemistry 1992; 31:1886–91. [DOI] [PubMed] [Google Scholar]
- 20. Errasfa M, Russo‐Marie F. A purified lipocortin shares the anti‐inflammatory effect of glucocorticosteroids in vivo in mice. Br J Pharmacol 1989; 97:1051–8. [DOI] [PMC free article] [PubMed] [Google Scholar]
- 21. Linke B, Abeler‐Dorner L, Jahndel V, Kurz A, Mahr A, Pfrang S et al The tolerogenic function of annexins on apoptotic cells is mediated by the annexin core domain. J Immunol 2015; 194:5233–42. [DOI] [PubMed] [Google Scholar]
- 22. Henson PM. Fingering IL‐12 with apoptotic cells. Immunity 2004; 21:604–6. [DOI] [PubMed] [Google Scholar]
- 23. Voll RE, Herrmann M, Roth EA, Stach C, Kalden JR, Girkontaite I. Immunosuppressive effects of apoptotic cells. Nature 1997; 390:350–1. [DOI] [PubMed] [Google Scholar]
- 24. van Zandbergen G, Bollinger A, Wenzel A, Kamhawi S, Voll R, Klinger M et al Leishmania disease development depends on the presence of apoptotic promastigotes in the virulent inoculum. Proc Natl Acad Sci USA 2006; 103:13837–42. [DOI] [PMC free article] [PubMed] [Google Scholar]
- 25. Park D, Tosello‐Trampont AC, Elliott MR, Lu M, Haney LB, Ma Z et al BAI1 is an engulfment receptor for apoptotic cells upstream of the ELMO/Dock180/Rac module. Nature 2007; 450:430–4. [DOI] [PubMed] [Google Scholar]
- 26. Kobayashi N, Karisola P, Pena‐Cruz V, Dorfman DM, Jinushi M, Umetsu SE et al TIM‐1 and TIM‐4 glycoproteins bind phosphatidylserine and mediate uptake of apoptotic cells. Immunity 2007; 27:927–40. [DOI] [PMC free article] [PubMed] [Google Scholar]
- 27. Miyanishi M, Tada K, Koike M, Uchiyama Y, Kitamura T, Nagata S. Identification of Tim4 as a phosphatidylserine receptor. Nature 2007; 450:435–9. [DOI] [PubMed] [Google Scholar]
- 28. Park SY, Kang KB, Thapa N, Kim SY, Lee SJ, Kim IS. Requirement of adaptor protein GULP during stabilin‐2‐mediated cell corpse engulfment. J Biol Chem 2008; 283:10593–600. [DOI] [PubMed] [Google Scholar]
- 29. Park SY, Kim SY, Jung MY, Bae DJ, Kim IS. Epidermal growth factor‐like domain repeat of stabilin‐2 recognizes phosphatidylserine during cell corpse clearance. Mol Cell Biol 2008; 28:5288–98. [DOI] [PMC free article] [PubMed] [Google Scholar]
- 30. He M, Kubo H, Morimoto K, Fujino N, Suzuki T, Takahasi T et al Receptor for advanced glycation end products binds to phosphatidylserine and assists in the clearance of apoptotic cells. EMBO Rep 2011; 12:358–64. [DOI] [PMC free article] [PubMed] [Google Scholar]
- 31. Hanayama R, Tanaka M, Miwa K, Shinohara A, Iwamatsu A, Nagata S. Identification of a factor that links apoptotic cells to phagocytes. Nature 2002; 417:182–7. [DOI] [PubMed] [Google Scholar]
- 32. Nagata S, Hanayama R, Kawane K. Autoimmunity and the clearance of dead cells. Cell 2010; 140:619–30. [DOI] [PubMed] [Google Scholar]
- 33. Nakano T, Ishimoto Y, Kishino J, Umeda M, Inoue K, Nagata K et al Cell adhesion to phosphatidylserine mediated by a product of growth arrest‐specific gene 6. J Biol Chem 1997; 272:29411–14. [DOI] [PubMed] [Google Scholar]
- 34. Ravichandran KS. Beginnings of a good apoptotic meal: the find‐me and eat‐me signaling pathways. Immunity 2011; 35:445–55. [DOI] [PMC free article] [PubMed] [Google Scholar]
- 35. Rothlin CV, Ghosh S, Zuniga EI, Oldstone MB, Lemke G. TAM receptors are pleiotropic inhibitors of the innate immune response. Cell 2007; 131:1124–36. [DOI] [PubMed] [Google Scholar]
- 36. Kenis H, van Genderen H, Deckers NM, Lux PA, Hofstra L, Narula J et al Annexin A5 inhibits engulfment through internalization of PS‐expressing cell membrane patches. Exp Cell Res 2006; 312:719–26. [DOI] [PubMed] [Google Scholar]
- 37. Sakaguchi S, Sakaguchi N, Asano M, Itoh M, Toda M. Immunologic self‐tolerance maintained by activated T cells expressing IL‐2 receptor α‐chains (CD25). Breakdown of a single mechanism of self‐tolerance causes various autoimmune diseases. J Immunol 1995; 155:1151–64. [PubMed] [Google Scholar]
- 38. Sakaguchi S, Yamaguchi T, Nomura T, Ono M. Regulatory T cells and immune tolerance. Cell 2008; 133:775–87. [DOI] [PubMed] [Google Scholar]
- 39. Shevach EM. From vanilla to 28 flavors: multiple varieties of T regulatory cells. Immunity 2006; 25:195–201. [DOI] [PubMed] [Google Scholar]
- 40. Jonuleit H, Schmitt E, Kakirman H, Stassen M, Knop J, Enk AH. Infectious tolerance: human CD25+ regulatory T cells convey suppressor activity to conventional CD4+ T helper cells. J Exp Med 2002; 196:255–60. [DOI] [PMC free article] [PubMed] [Google Scholar]
- 41. Oliveira VG, Caridade M, Paiva RS, Demengeot J, Graca L. Sub‐optimal CD4+ T‐cell activation triggers autonomous TGF‐β‐dependent conversion to Foxp3+ regulatory T cells. Eur J Immunol 2011; 41:1249–55. [DOI] [PubMed] [Google Scholar]
- 42. Vocanson M, Rozieres A, Hennino A, Poyet G, Gaillard V, Renaudineau S et al Inducible costimulator (ICOS) is a marker for highly suppressive antigen‐specific T cells sharing features of TH17/TH1 and regulatory T cells. J Allergy Clin Immunol 2010; 126: 280–9. e1–7. [DOI] [PubMed] [Google Scholar]
- 43. Kasagi S, Zhang P, Che L, Abbatiello B, Maruyama T, Nakatsukasa H et al In vivo‐generated antigen‐specific regulatory T cells treat autoimmunity without compromising antibacterial immune response. Sci Transl Med 2014; 6:241ra78. [DOI] [PubMed] [Google Scholar]
- 44. Kawai K, Uchiyama M, Hester J, Wood K, Issa F. Regulatory T cells for tolerance. Hum Immunol 2018; 79:294–303. [DOI] [PubMed] [Google Scholar]
- 45. Tang Q, Bluestone JA. Regulatory T‐cell therapy in transplantation: moving to the clinic. Cold Spring Harb Perspect Med 2013; 3(11):a015552. [DOI] [PMC free article] [PubMed] [Google Scholar]
- 46. Sawant DV, Vignali DA. Once a Treg, always a Treg? Immunol Rev 2014; 259:173–91. [DOI] [PMC free article] [PubMed] [Google Scholar]
- 47. Singer BD, King LS, D'Alessio FR. Regulatory T cells as immunotherapy. Front Immunol 2014; 5:46. [DOI] [PMC free article] [PubMed] [Google Scholar]
- 48. Erlich HA. Polymerase chain reaction. J Clin Immunol 1989; 9:437–47. [DOI] [PubMed] [Google Scholar]
- 49. Bradfield PF, Johnson‐Leger CA, Zimmerli C, Imhof BA. LPS differentially regulates adhesion and transendothelial migration of human monocytes under static and flow conditions. Int Immunol 2008; 20:247–57. [DOI] [PubMed] [Google Scholar]
- 50. Kunzendorf U, Pohl T, Bulfone‐Paus S, Krause H, Notter M, Onu A et al Suppression of cell‐mediated and humoral immune responses by an interleukin‐2‐immunoglobulin fusion protein in mice. J Clin Invest 1996; 97:1204–10. [DOI] [PMC free article] [PubMed] [Google Scholar]
- 51. Deaglio S, Dwyer KM, Gao W, Friedman D, Usheva A, Erat A et al Adenosine generation catalyzed by CD39 and CD73 expressed on regulatory T cells mediates immune suppression. J Exp Med 2007; 204:1257–65. [DOI] [PMC free article] [PubMed] [Google Scholar]
- 52. Joffre O, Gorsse N, Romagnoli P, Hudrisier D, van Meerwijk JP. Induction of antigen‐specific tolerance to bone marrow allografts with CD4+CD25+ T lymphocytes. Blood 2004; 103:4216–21. [DOI] [PMC free article] [PubMed] [Google Scholar]
- 53. Dennis PB, Jaeschke A, Saitoh M, Fowler B, Kozma SC, Thomas G. Mammalian TOR: a homeostatic ATP sensor. Science 2001; 294:1102–5. [DOI] [PubMed] [Google Scholar]
- 54. Gingras AC, Raught B, Sonenberg N. Regulation of translation initiation by FRAP/mTOR. Genes Dev 2001; 15:807–26. [DOI] [PubMed] [Google Scholar]
- 55. Cao X, Cai SF, Fehniger TA, Song J, Collins LI, Piwnica‐Worms DR et al Granzyme B and perforin are important for regulatory T cell‐mediated suppression of tumor clearance. Immunity 2007; 27:635–46. [DOI] [PubMed] [Google Scholar]
- 56. Gondek DC, Lu LF, Quezada SA, Sakaguchi S, Noelle RJ. Cutting edge: contact‐mediated suppression by CD4+CD25+ regulatory cells involves a granzyme B‐dependent, perforin‐independent mechanism. J Immunol 2005; 174:1783–6. [DOI] [PubMed] [Google Scholar]
- 57. Shevach EM. Mechanisms of foxp3+ T regulatory cell‐mediated suppression. Immunity 2009; 30:636–45. [DOI] [PubMed] [Google Scholar]
- 58. Bahri R, Bollinger A, Bollinger T, Orinska Z, Bulfone‐Paus S. Ectonucleotidase CD38 demarcates regulatory, memory‐like CD8+ T cells with IFN‐γ‐mediated suppressor activities. PLoS ONE. 2012; 7:e45234. [DOI] [PMC free article] [PubMed] [Google Scholar]
- 59. Francisco LM, Sage PT, Sharpe AH. The PD‐1 pathway in tolerance and autoimmunity. Immunol Rev 2010; 236:219–42. [DOI] [PMC free article] [PubMed] [Google Scholar]
- 60. Walker LS. Treg and CTLA‐4: two intertwining pathways to immune tolerance. J. Autoimmun. 2013; 45:49–57. [DOI] [PMC free article] [PubMed] [Google Scholar]
- 61. Josefowicz SZ, Lu LF, Rudensky AY. Regulatory T cells: mechanisms of differentiation and function. Annu Rev Immunol 2012; 30:531–64. [DOI] [PMC free article] [PubMed] [Google Scholar]
- 62. Beadling C, Johnson KW, Smith KA. Isolation of interleukin 2‐induced immediate‐early genes. Proc Natl Acad Sci USA 1993; 90:2719–23. [DOI] [PMC free article] [PubMed] [Google Scholar]
- 63. Beadling C, Smith KA. DNA array analysis of interleukin‐2‐regulated immediate/early genes. Med Immunol 2002; 1:2. [DOI] [PMC free article] [PubMed] [Google Scholar]
- 64. Stern JB, Smith KA. Interleukin‐2 induction of T‐cell G1 progression and c‐myb expression. Science 1986; 233:203–6. [DOI] [PubMed] [Google Scholar]
- 65. Yang YH, Morand E, Leech M. Annexin A1: potential for glucocorticoid sparing in RA. Nat Rev Rheumatol 2013; 9:595–603. [DOI] [PubMed] [Google Scholar]
- 66. Nagata S, Suzuki J, Segawa K, Fujii T. Exposure of phosphatidylserine on the cell surface. Cell Death Differ 2016; 23:952–61. [DOI] [PMC free article] [PubMed] [Google Scholar]
- 67. Fischer K, Voelkl S, Berger J, Andreesen R, Pomorski T, Mackensen A. Antigen recognition induces phosphatidylserine exposure on the cell surface of human CD8+ T cells. Blood 2006; 108:4094–101. [DOI] [PubMed] [Google Scholar]
- 68. Martin M, Leffler J, Blom AM. Annexin A2 and A5 serve as new ligands for C1q on apoptotic cells. J Biol Chem 2012; 287:33733–44. [DOI] [PMC free article] [PubMed] [Google Scholar]
- 69. Weyd H, Abeler‐Dorner L, Linke B, Mahr A, Jahndel V, Pfrang S et al Annexin A1 on the surface of early apoptotic cells suppresses CD8+ T cell immunity. PLoS ONE. 2013; 8:e62449. [DOI] [PMC free article] [PubMed] [Google Scholar]
- 70. Cardo‐Vila M, Arap W, Pasqualini R. α v β 5 integrin‐dependent programmed cell death triggered by a peptide mimic of annexin V. Mol Cell 2003; 11:1151–62. [DOI] [PubMed] [Google Scholar]
- 71. Wen Y, Edelman JL, Kang T, Sachs G. Lipocortin V may function as a signaling protein for vascular endothelial growth factor receptor‐2/Flk‐1. Biochem Biophys Res Commun 1999; 258:713–21. [DOI] [PubMed] [Google Scholar]
- 72. Peng B, Guo C, Guan H, Liu S, Sun MZ. Annexin A5 as a potential marker in tumors. Clin Chim Acta 2014; 427:42–8. [DOI] [PubMed] [Google Scholar]
- 73. Appelt U, Sheriff A, Gaipl US, Kalden JR, Voll RE, Herrmann M. Viable, apoptotic and necrotic monocytes expose phosphatidylserine: cooperative binding of the ligand Annexin V to dying but not viable cells and implications for PS‐dependent clearance. Cell Death Differ 2005; 12:194–6. [DOI] [PubMed] [Google Scholar]
- 74. Arnold P, Lu X, Amirahmadi F, Brandl K, Arnold JM, Feng Q. Recombinant human annexin A5 inhibits proinflammatory response and improves cardiac function and survival in mice with endotoxemia. Crit Care Med. 2014; 42:e32–e41. [DOI] [PubMed] [Google Scholar]
- 75. Bakar F, Unluturk U, Baskal N, Nebioglu S. Annexin V expression and anti‐annexin V antibodies in type 1 diabetes. J Clin Endocrinol Metab 2014; 99:932–7. [DOI] [PubMed] [Google Scholar]
- 76. Sumitomo S, Fujio K, Okamura T, Morita K, Ishigaki K, Suzukawa K et al Transcription factor early growth response 3 is associated with the TGF‐β1 expression and the regulatory activity of CD4‐positive T cells in vivo . J Immunol 2013; 191:2351–9. [DOI] [PubMed] [Google Scholar]
- 77. Warnecke G, Chapman SJ, Bushell A, Hernandez‐Fuentes M, Wood KJ. Dependency of the trans vivo delayed type hypersensitivity response on the action of regulatory T cells: implications for monitoring transplant tolerance. Transplantation 2007; 84:392–9. [DOI] [PubMed] [Google Scholar]
Associated Data
This section collects any data citations, data availability statements, or supplementary materials included in this article.
Supplementary Materials
Figure S1. Detection of ANXA5 with different anti‐ANXA5 commercially available antibodies.