Abstract
Background and Purpose:
Ultra-high-field 7T promises more than doubling the signal-to-noise ratio (SNR) of 3T for MRI, particularly for MRI of magnetic susceptibility effects induced by . Quantitative susceptibility mapping (QSM) is based on deconvolving the induced phase (or field) and would therefore benefit substantially from 7T. The purpose of this work was to compare QSM performance at 7T versus 3T in an intra-scanner test-retest experiment with varying echo numbers (5 and 10 echoes).
Methods:
A prospective study in N=10 healthy subjects was carried out at both 3T and 7T field strengths. Gradient echo data using 5 and 10 echoes was acquired twice in each subject. Test-retest reproducibility was assessed using Bland-Altman and regression analysis of region of interest measurements. Image quality was scored by an experienced neuroradiologist.
Results:
Intra-scanner bias was below 3.6ppb with correlation R2>0.85. Inter-scanner bias was below 10.9ppb with correlation R2>0.8. The image quality score for the 3T 10 echo protocol was not different from the 7T 5 echo protocol (p=0.65).
Conclusion:
Excellent image quality and good reproducibility was observed. 7T allows equivalent image quality of 3T in half of the scan time.
Keywords: Quantitative Susceptibility Mapping, 7T, 3T, reproducibility
Introduction
Ultra-high-field 7T MRI, which is capable of more than doubling the signal-to-noise ratio (SNR) of 3T MRI, has been established as an important research tool for imaging the brain and many other organs in the body1 and is becoming a clinical tool for imaging the brain and extremities.2 Tissue magnetism effects including susceptibility and chemical shift induced by the main field are proportional to .3 Accordingly, 7T MRI can potentially provide exceptional contrast-to-noise ratio (CNR) benefit for magnetic resonance spectroscopy (MRS) and susceptibility based imaging: T2* weighted magnitude imaging including susceptibility-weighted imaging (SWI)4 and paramagnetic-deoxyheme-based fMRI,5 phase imaging,6 and quantitative susceptibility mapping (QSM).7,8 QSM is particularly valuable for enabling precision targeting for deep brain stimulation,9 no-gadolinium MRI for monitoring multiple sclerosis patients,10 confident differentiation of calcification and hemorrhage for assessing brain tumor,11,12 dating and monitoring cerebral cavernous malformations,13 mapping iron overloading in Alzheimer’s disease14 and Parkinson’s disease,15 mapping cerebral metabolic rate of oxygen consumption,16 mapping magnetic nanocarrier distribution17, and precision measurement of liver iron concentration.18
T2* weighted magnitude and phase images are always simultaneously acquired in routine gradient echo sequences using quadrature detection, but they contain blooming artifacts highly dependent on imaging parameters and object orientation.19 QSM deconvolves the blooming artifacts to enable a quantitative study of the local tissue magnetic susceptibility property.7 The Bayesian approach to QSM has been established for solving the ill-posed field-to-susceptibility inverse problem.7,20–25 QSM has become sufficiently robust for routine applications in studying susceptibility changes occurring in neurodegeneration, inflammation, oxygen consumption, hemorrhage, bone mineralization and other calcifications.8 Several studies have now shown reproducibility of QSM across 1.5T, 3T, and 7T, within sites and between sites, and between scanner vendors in well-controlled travelling phantoms, in healthy subjects, and in patients.26–33
The benefit of 7T for QSM has been recognized since the early days of QSM34–37 and reproducibility of QSM between 7T and 3T in human subjects has been studied on the whole brain level.33 The later echoes in the multi-echo gradient echo sequence typically used in QSM suffer from more rapid signal decay at 7T. Accordingly, this study compares 7T and 3T QSM in various regions of interest within the brain and includes evaluating the effects of the number of echoes.
Methods
Data Acquisition
MRI was performed in N=10 healthy subjects (2 female) with ages ranging between 19–68 years (average 52 years) and who satisfied the MR safety criteria. Informed consent was obtained from each subject under approval from the Institutional Review Board. 3D multiple echo gradient echo (mGRE) data were acquired on a prototype 7T MR scanner (MR950, Signa 7.0T, General Electric Healthcare, Waukesha, WI, USA) and on a 3T MR scanner (Discovery MR750, General Electric Healthcare, Waukesha, WI, USA) using a 2-channel transmit/ 32-channel receive head coil at 7T and the body transmit coil and a 32 channel receive head coil at 3T. The same 3D mGRE sequence, compiled for both 3T and 7T scanners, was used to acquire data for QSM. For each subject and after acquiring a scout scan, two mGRE acquisitions were performed with identical parameters, except for the number of echoes, which was 5 and 10, respectively. For 3T only, a separate coil calibration scan was prescribed and acquired to obtain coil sensitivity maps. For 7T, this was done automatically immediately for the first mGRE acquisition. Next, the subject was asked to get up from the scanner table and take a few steps, after which the subject was repositioned onto the table. This was done to ensure that instrumental and positioning settings were properly reset between measurements. The complete protocol was then repeated (including scout and calibration scans) to assess reproducibility. The imaging parameters for all mGRE acquisitions are shown in Table 1.
Table 1.
Imaging parameters for the in vivo acquisitions, using two field strengths (3T and 7T) and 5 echoes and 10 echoes.
| field strength / number of echoes1 | 3T 5E | 3T 10E | 7T 5E | 7T 10E |
| acquired voxel size [mm] | 0.69 × 0.69 × 2.00 | 0.69 × 0.69 × 2.00 | 0.69 × 0.69 × 2.00 | 0.69 × 0.69 × 2.00 |
| reconstructed voxel size2 [mm] | 0.43 × 0.43 × 1.00 | 0.43 × 0.43 × 1.00 | 0.43 × 0.43 × 1.00 | 0.43 × 0.43 × 1.00 |
| field of view [mm] | 220 × 176 | 220 × 176 | 220 × 176 | 220 × 176 |
| number of echoes | 5 | 10 | 5 | 10 |
| acquisition matrix | 320 × 320 × 86 | 320 × 320 × 86 | 320 × 320 × 74 | 320 × 320 × 74 |
| repetition time [ms] | 24.48 | 45.08 | 24.55 | 45.03 |
| echo time [ms] | 3.85 / 7.97 / 12.09 / 16.21 / 20.33 | 3.85 / 7.97 / 12.09 / 16.21 / 20.33 / 24.45 / 28.57 / 32.69 / 36.81 / 40.93 | 3.81 / 7.91 / 12.00 / 16.10 / 20.20 | 3.81 / 7.91 / 12.00 / 16.10 / 20.20 / 24.29 / 28.39 / 32.48 / 36.58 / 40.68 |
| acceleration factor (phase) | 2 | 2 | 2 | 2 |
| partial k-space3 [%] | 75.15 | 75.15 | 69.96 | 69.96 |
| flow compensation4 | Readout | Readout | Readout | Readout |
| flip angle | 15° | 15° | 15° | 15° |
| pixel bandwidth [Hz/pixel] | 244.14 | 244.14 | 244.14 | 244.14 |
| scan time | 3m35s | 6m36s | 2m51s | 5m15s |
| reconstruction5 | Mag/Real/Imag | Mag/Real/Imag | Mag/Real/Imag | Mag/Real/Imag |
| reconstructed matrix | 512 × 512 × 172 | 512 × 512 × 172 | 512 × 512 × 148 | 512 × 512 × 148 |
| receiver coil6 | 32 channel head | 32 channel head | 32 channel head | 32 channel head |
5E = 5 echoes, 10E = 10 echoes.
reconstructed voxel size is after Fourier zero-filling by the scanner.
using elliptical k-space sampling.
flow compensation is performed for all echoes.
Mag=Magnitude, Imag=Imaginary.
at 3T, RF transmit was performed using the body coil while, at 7T, both RF transmit and reception was performed using a 2-channel transmit/32-channel receive coil.
QSM reconstruction
From each mGRE acquisition, a total field was estimated from the complex data of all echoes using nonlinear least squares20. In the case of a single echo reconstruction, it was obtained by dividing the phase by the corresponding echo time. The Brain Extraction Tool (BET) algorithm in the FSL toolkit38,39 was used to extract a brain mask M(r), where r denotes the three-dimensional spatial index. The background field was removed using the projection onto dipole field algorithm to yield the local field 40 Then a susceptibility map , expressed in units of parts-per-billion (ppb), was reconstructed using the morphology enabled dipole inversion (MEDI) algorithm, which solves the following optimization problem,7,41
| 1 |
Where is the relative difference field, B0 the main magnetic field, W(r) reflecting the reliability of , the dipole kernel, the 3D gradient operator, a binary edge mask, and the average of over the ventricular cerebral spinal fluid (CSF) mask MCSFfor automatic zero referencing. From the magnitude mGRE images, the transversal relaxation rate R2* was calculated using the Auto-Regression on Linear Operations algorithm (ARLO).42 From this R2* map, a mask was computed by selecting those voxels whose R2* was below 5Hz and applying additional morphological image operations.41 The regularization parameters were chosen using the L-curve method with λ1 =10−3 and λ2 =10-1. A Matlab implementation of the QSM reconstruction code can be freely downloaded at https://med.cornell.edu/mri. From the first 10 echo mGRE acquisition at both 3T and 7T, an R2* map was calculated using the ARLO algorithm.
Data Analysis
For each subject, the first 10 echo acquisition at 3T was set as the reference for image registration, denoting and for the magnitude and susceptibility map, respectively. For each acquisition in each subject, the magnitude images were registered to using the FLIRT tool from the FSL Toolbox.39,43,44 On the reference susceptibility map of each subject, an experienced neuroradiologist (SL, 13 years of experience) segmented the following regions of interest (ROI): Caudate Nucleus (CN), Putamen (PU), Globus Pallidus (GP), Substantia Nigra (SN), Red Nucleus (RN), Splenium of Corpus Callosum (SCC) and Dentate Nucleus (DN), segmenting the right and left subregions separately where applicable. These ROIs were then registered back to each of the susceptibility reconstructions by applying the inverse of the transformation obtained during the registration of the magnitude images. For each susceptibility map, the mean over each ROI was recorded and their average and standard deviation over the scans were recorded for each field strength and echo number to assess the reproducibility of the susceptibility mapping method.
For the R2* map derived from the 10 echo acquisitions, the mean over each ROI was recorded for each field strength. A linear regression of the ROI R2* values between 3T and 7T was performed.
For each subject, the signal to noise ratio (SNR) was measured by drawing two circular ROIs on the magnitude image corresponding to the first echo of the first 7T 10 echo acquisition. A first ROI was drawn in the posterior horn of the right lateral ventricle. A second ROI was drawn within the air posterior to the head on the most inferior slice of the imaging volume. Spatially matching ROIs were then drawn on the first echo of the first 3T 10 echo acquisition by visually matching the anatomical locations. The magnitude SNR was computed as
where was the mean over of the magnitude image of the first echo time and was the standard deviation over of the magnitude image of the last (10th) echo time. The latter was done to avoid biasing the noise estimate by artifacts (such as remaining aliasing artifacts), which were sharply reduced due to the significant signal decay at the last echo time. The phase SNR was then estimated as
where was the mean over of the difference in phase between the second and the first echo time. This was done to remove the zero echo time image phase that may have differed between field strengths. The expression was used to estimate the noise in the ROI phase.45
QSM image quality was assessed by an experienced neuroradiologist (IK, over 20 years of experience) using a three 3 point scale: 1=excellent contrast, (with deep gray matter nuclei and white-gray matter contrast well visualized), 2=diagnostic (moderate white-gray matter contrast), 3=undiagnostic. All QSM image parameters, including field strength and number of echoes, were blinded from the neuroradiologist.
Reproducibility of the QSM ROI measurements across echo numbers and field strengths was assessed using correlation and Bland-Altman analysis. Reproducibility of the image quality was assessed using the Wilcoxon rank sum test.
Results
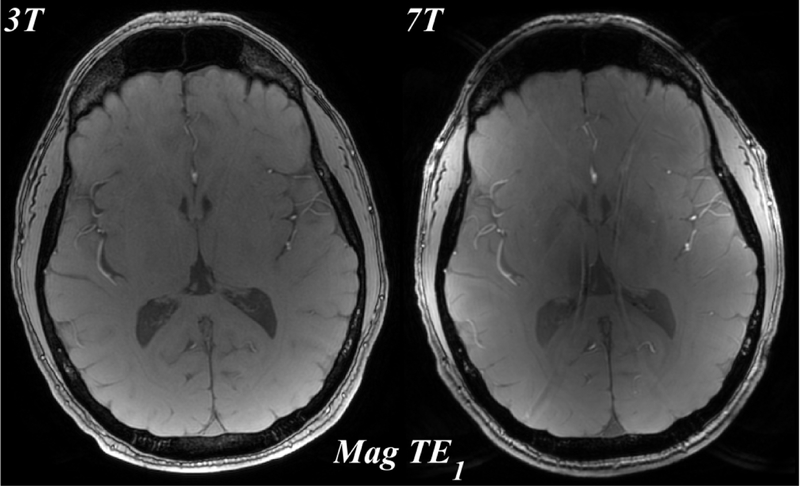
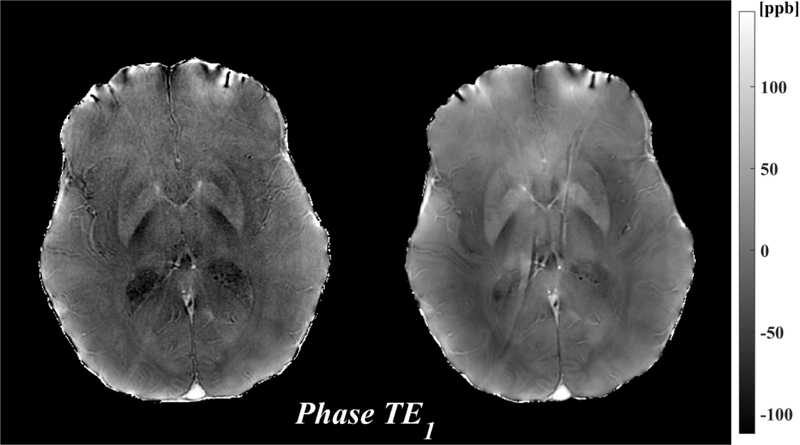
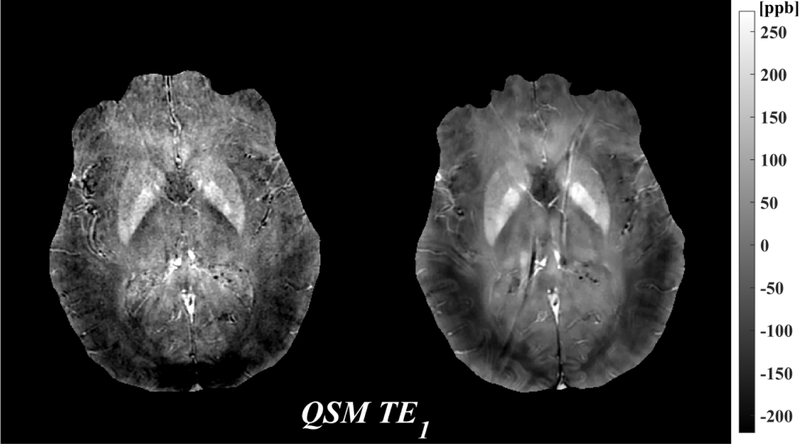
Figure 1 shows the magnitude, phase and QSM using a single echo, the first echo at TE~3.8ms for both 3T and 7T. The susceptibility induced field is more apparent on the 7T phase compared to the 3T phase, resulting in improved visualization of susceptibility contrast (bottom row).
Figure 1.
Comparison of 3T (left) and 7T (right) MRI: magnitude (mag, top), local field (phase, middle), which was obtained by removing the background field, and quantitative susceptibility map (QSM, bottom) from the first echo time TE1=3.8ms. All images shown are registered.
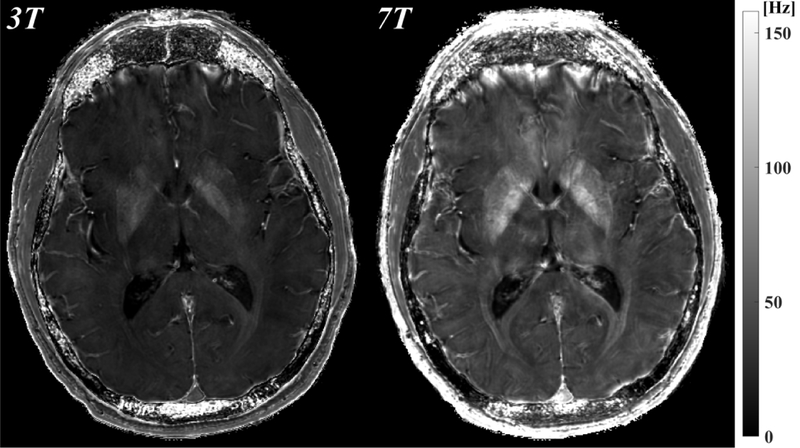
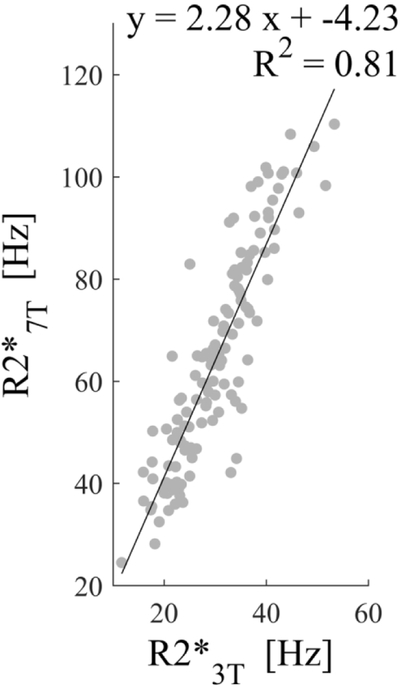
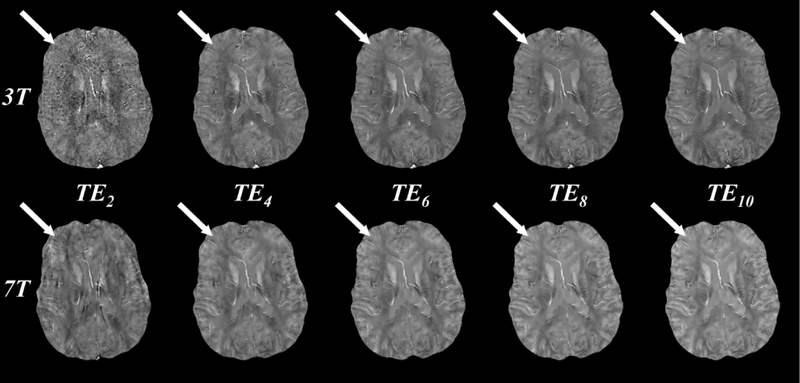
T2* signal decay at 7T was faster than at 3T (Figure 2a) resulting in higher R2* values (Figure 2b). Across all segmented ROIs and all subjects, a regression analysis revealed an estimated slope of 2.28 between the R2* values at 7T and those at 3T (Figure 2c)
Figure 2.
a) Magnitude images of 3T and 7T for all even echo times ( through ). All images shown are registered. The susceptibility induced magnitude changes are already well visualized at =7.91ms. The 7T magnitude image signal to noise decay is much faster than for 3T. b) The R2* maps at 3T and 7T, demonstrating higher R2* values for 7T. c) Regression of deep gray matter region of interest R2* values across the 10 subjects between 3T and 7T. A good correlation with a slope of 2.28 was found.
Figure 3 shows QSM images reconstructed at both 3T and 7T using the first 2, 4, 6, 8, and 10 echoes. Using the first two echoes (Figure 3, first column, ), QSM image quality at 3T is visually worse than at 7T, with the latter having lower apparent noise. For both field strengths, QSM image quality is increased by including later echoes. At 3T, subtle improvement in the contrast between gray and white matter susceptibility is observed up to echo 10 (Figure 3, top tow, white arrows). At 7T, QSM image quality, including gray and white matter contrast, is largely similar when including between 6 and 10 echoes (Figure 3, bottom row, white arrows).
Figure 3.
QSM images reconstructed at 3T (top row) and 7T (bottom row) using the first 2, 4, 6, 8, and 10 echoes (columns 1 through 5, echo times through ). Image quality at 3T increases with increasing echo number as evidenced in the white-gray matter contrast (white arrows), while image quality at 7T remains similar after including 6 or more echoes. All images were obtained from a single 10 echo acquisition. Images at 7T are registered to those at 3T for visualization purposes only.
Average magnitude SNR was 73.2 for 3T compared to 162.4 for 7T, corresponding to a ratio of 2.2. Average phase SNR was 6.1 for 3T compared to 19.3 for 7T, corresponding to a ratio of 3.2.
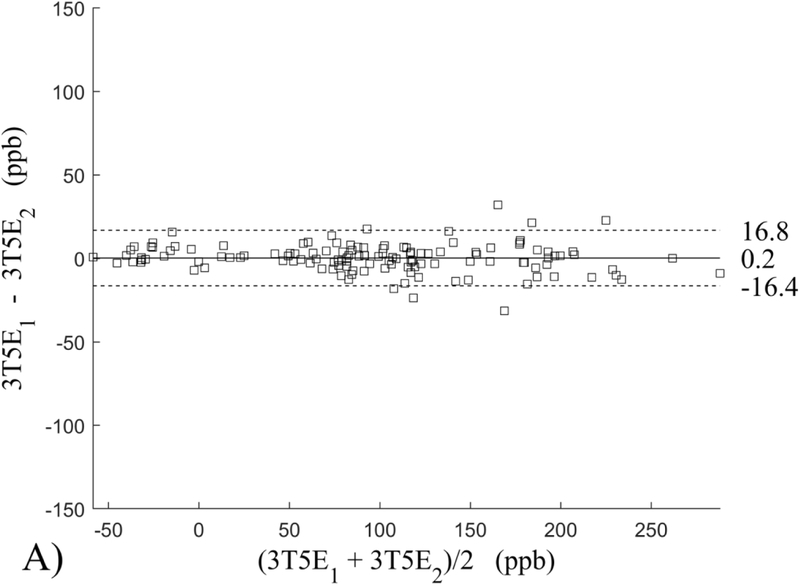
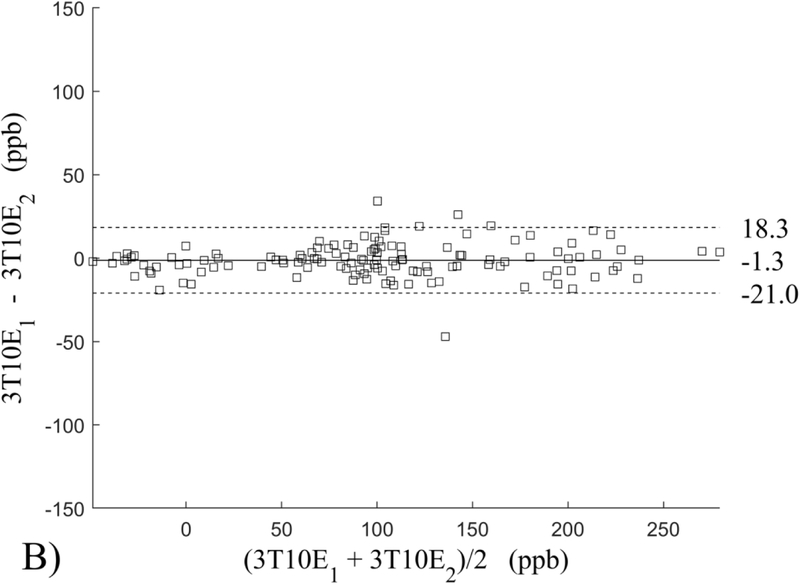
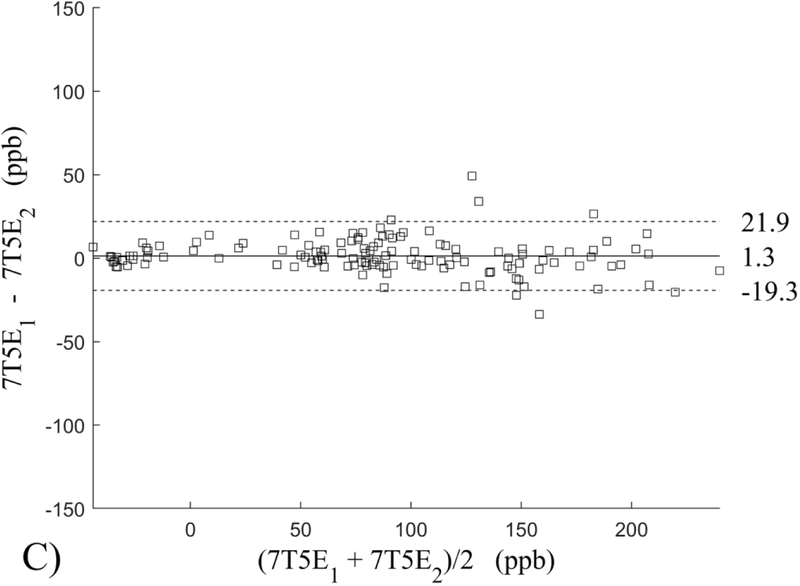
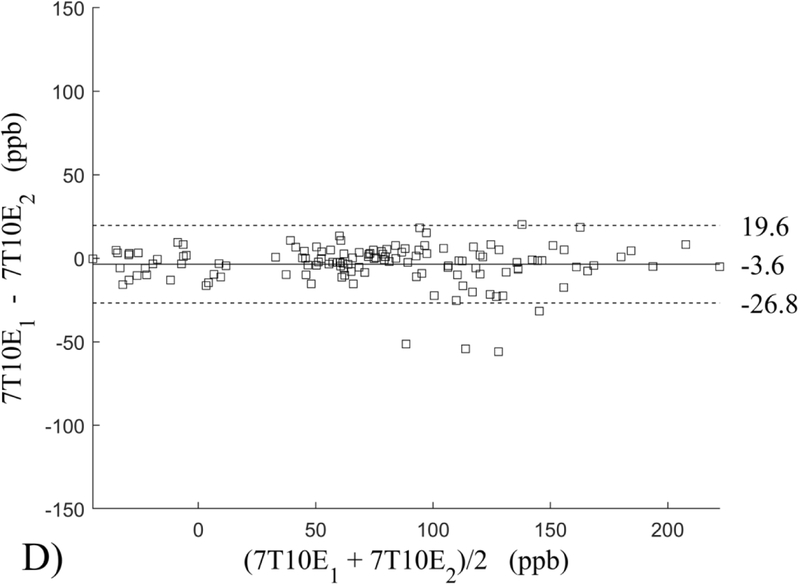
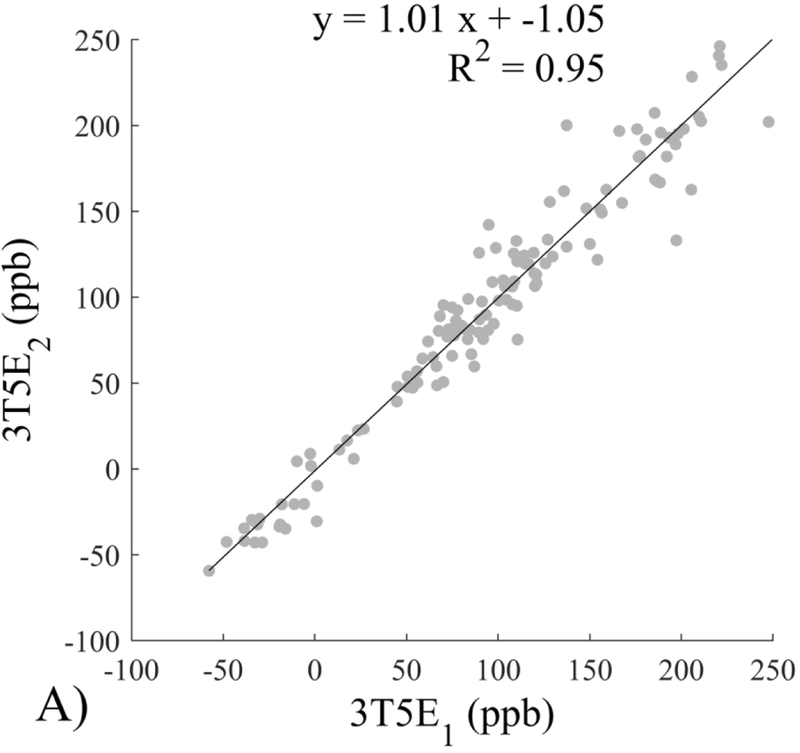
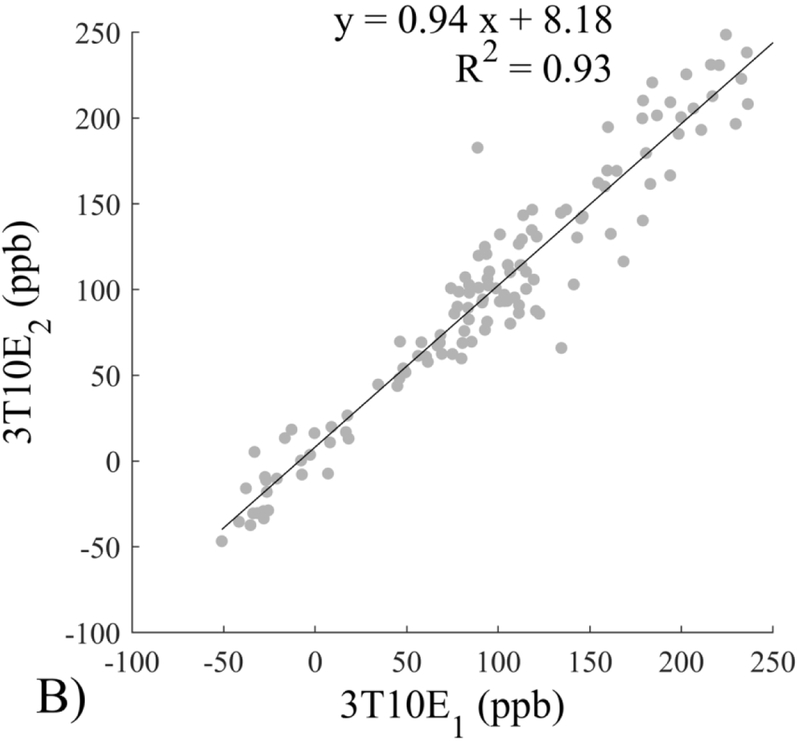
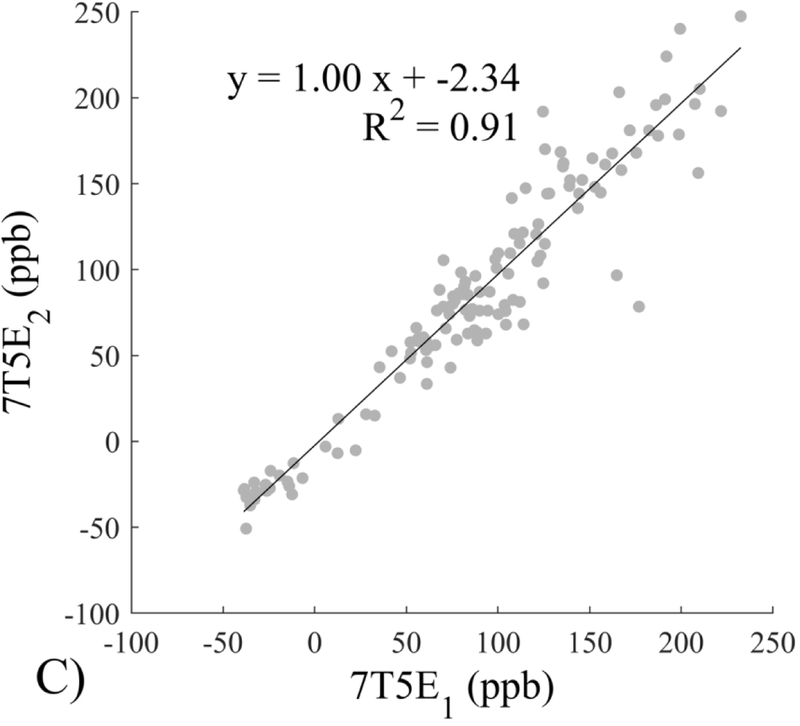
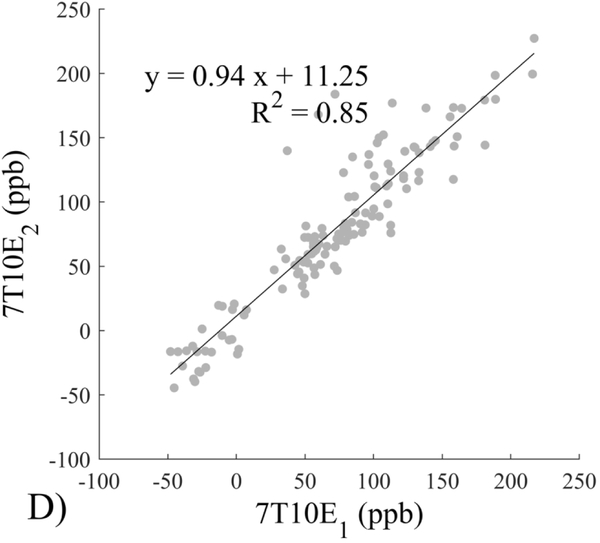
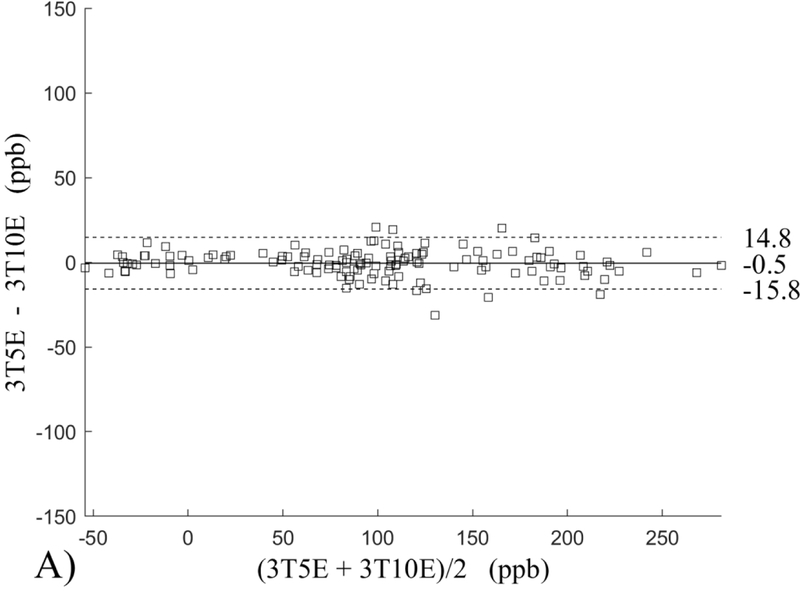
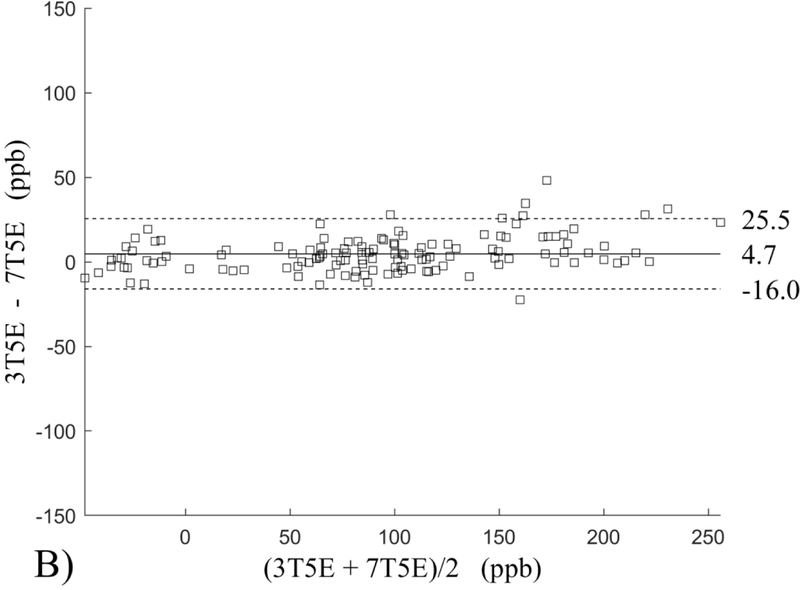
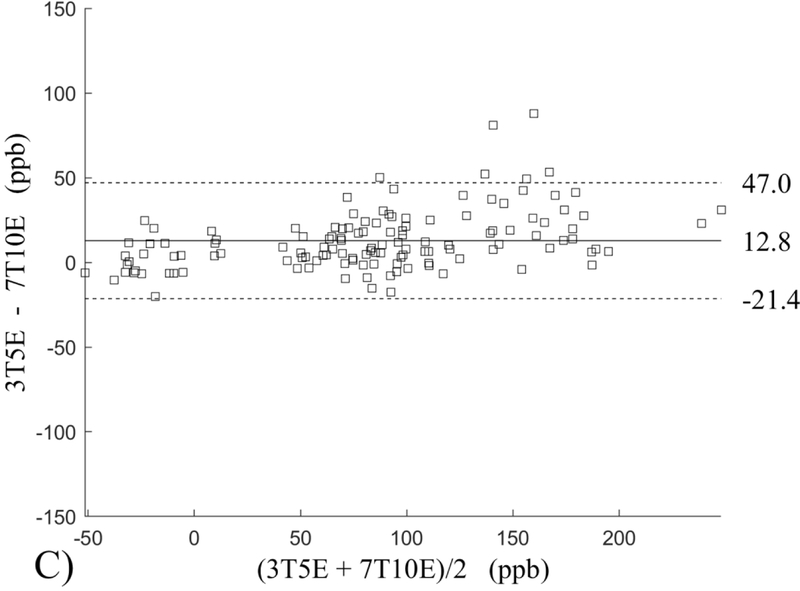
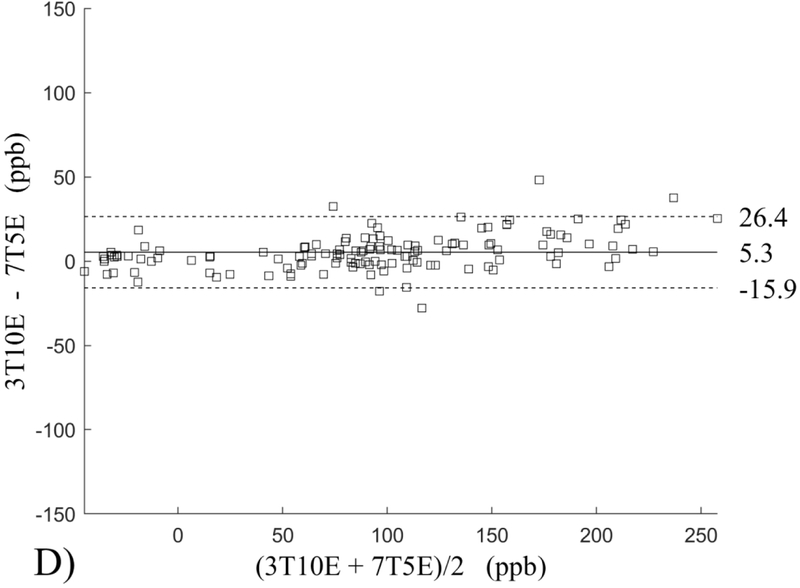
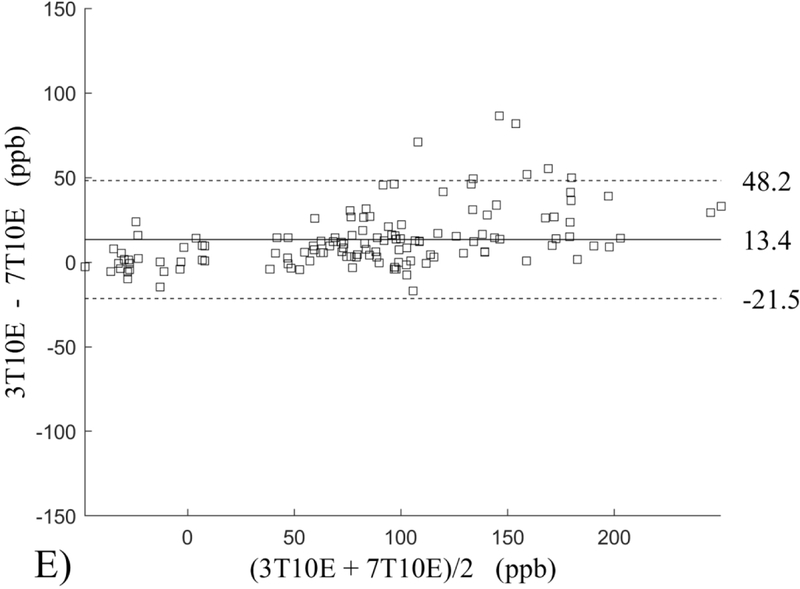
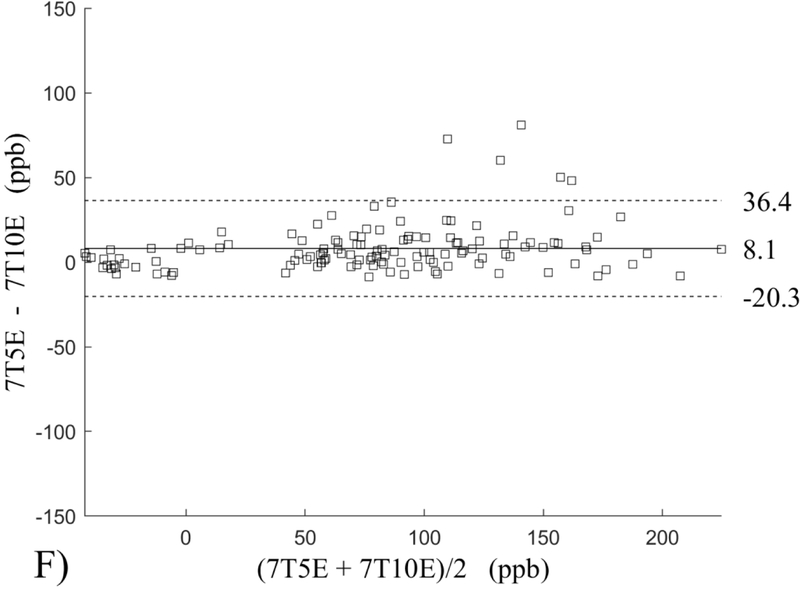
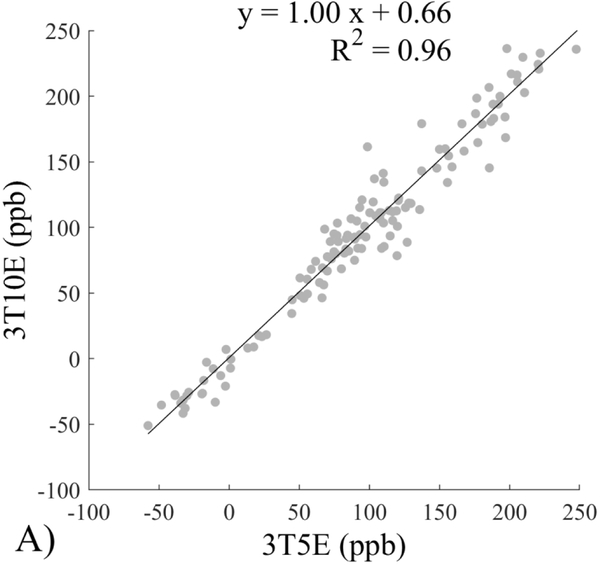
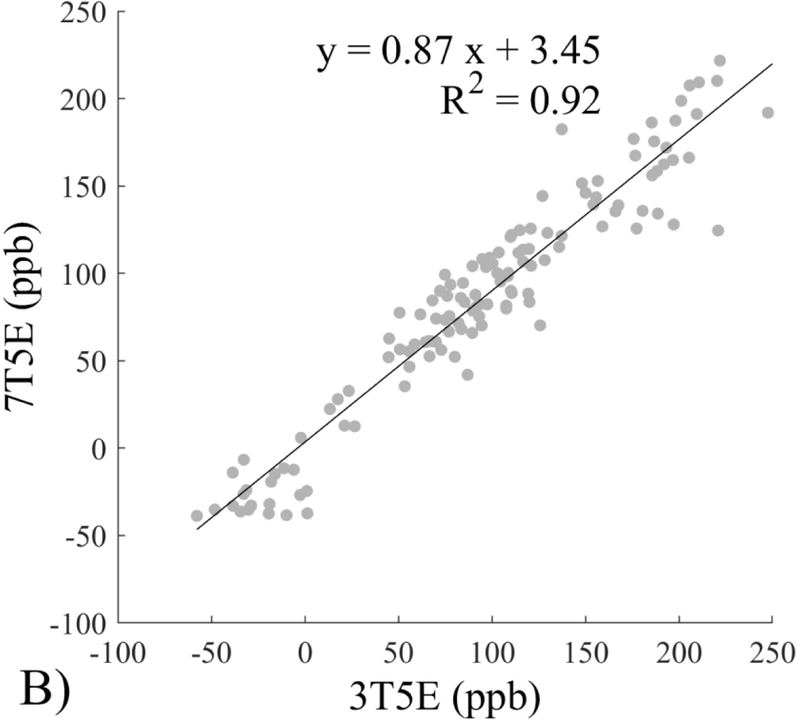
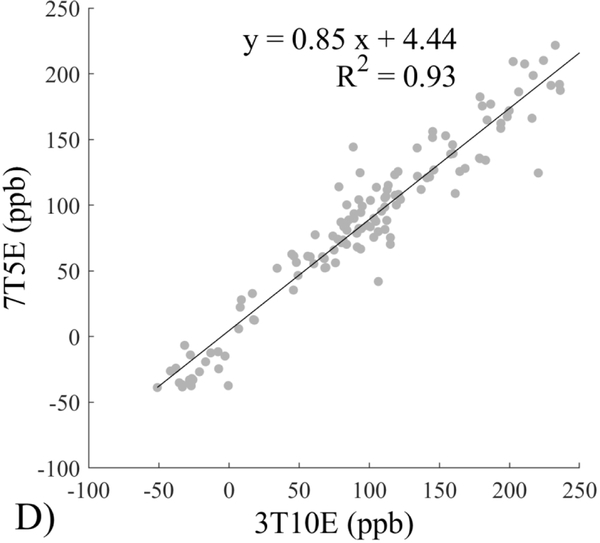
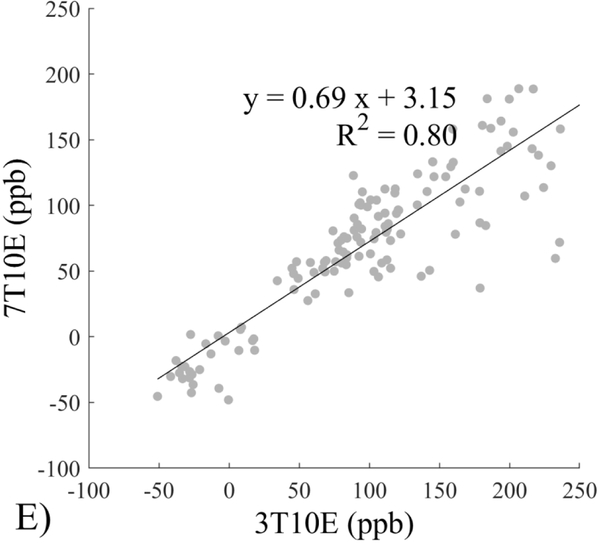
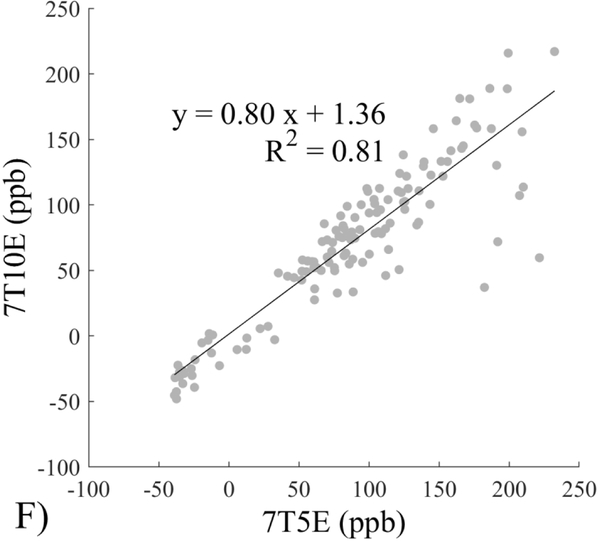
The Bland-Altman analysis of test-retest reproducibility keeping field strength and echo number fixed is shown in Figure 4, indicating a bias between 0.2ppb and 3.6ppb (in absolute terms) and similar limits of agreement, between ±16.6ppb and ±23.2ppb around the bias. The corresponding regression analysis shows similarity with slopes between 0.94 and 1.01 and R2 above 0.85 (Figure 5). The ROI measurements averaged across subjects are shown in Figure 6. The ROI values were similar between the 3T 5 echo, 3T 10 echo and 7T 5 echo acquisitions, with lower values for 7T susceptibility using 10 echoes. The Bland-Altman analysis of the reproducibility across field strengths and echo numbers is shown in Figure 7, showing a bias less than 13.4ppb between any pair of acquisitions. Similarly, good correlation between acquisitions was observed with R2 above 0.8 (Figure 8).
Figure 4.
Bland-Altman analysis of test-retest reproducibility of quantitative susceptibility mapping at 3T and 7T and using 5 and 10 echoes (5E and 10E). Susceptibility is expressed in parts per billion (ppb). Each data point represents one region of interest measurement in one subject. Bias (solid line) is below 3.6 ppb in absolute terms with similar limits of agreements (dashed lines).
Figure 5.
Regression analysis of test-retest performance of quantitative susceptibility mapping measured at 3T and 7T and using 5 and 10 echoes (5E and 10E). Susceptibility is expressed in parts per billion (ppb). Each data point represents one region of interest measurement in one subject. Correlation is excellent with slopes between 0.94 and 1.01 and R2 above 0.85.
Figure 6.
Region of interest (ROI) susceptibility values measured at both 3T and 7T and both 5 and 10 echoes (5E and 10E) averaged across the 10 subjects. Susceptibility is expressed in parts per billion (ppb). The selected ROIs are Caudate Nucleus (CN), Putamen (PU), Globus Pallidus (GP), Substantia Nigra (SN), Red Nucleus (RN), Splenium of Corpus Callosum (SCC) and Dentate Nucleus (DN).
Figure 7.
Bland-Altman analysis of reproducibility of quantitative susceptibility mapping between different field strengths (3T and 7T) and echo numbers (5E and 10E). Susceptibility is expressed in parts per billion (ppb). Each data point represents one region of interest measurement in one subject. The solid horizontal line indicates the bias while the dashed lines indicate the limits of agreement.
Figure 8.
Regression analysis of reproducibility of quantitative susceptibility mapping between different field strengths (3T and 7T) and echo numbers (5E and 10E). Susceptibility is expressed in parts per billion (ppb). Each data point represents one region of interest measurement in one subject.
The image quality score (expressed in mean±standard deviation over the subjects) for the 3T 5 echo protocol was 3.0±0.0 and 3.0±0.0 (test/retest, p=1.00). The image quality score for the 3T 10 echo protocol was 1.30±0.48 and 1.10±0.32 (test/retest, p=0.30). The image quality score for the 7T 5 echo protocol was 1.20±0.42 and 1.50±0.53 (test/retest, p=0.19). The image quality score for the 7T 10 echo protocol was 1.90±0.74 and 1.80±0.42 (test/retest, p=0.82). The image quality score for the 3T 10 echo protocol was not statistically significantly different from the 7T 5 echo protocol (p=0.65).
Discussion
The presented data confirmed a increase in magnitude SNR and a greater than increase in phase SNR in a gradient echo acquisition at minimal TE. For data acquisition using an mGRE sequence, R2* was found to increase linearly with as well. QSM reconstructed from a short echo train (5 echoes) at 7T was similar to that from a long echo train at 3T (10 echoes). QSM was reproducible within fixed field strength when the same number of echoes were used. Across field strengths and with different numbers of echoes, acceptable levels of reproducibility were achieved between the 3T acquisition with 10 echoes and the 7T acquisition with 5 echoes. The preliminary data suggest that 7T can be used to shorten QSM acquisition time or enable higher resolution QSM in clinically acceptable scan times.
The observed similarity in QSM image quality between using 10 echoes at 3T and using 5 echoes at 7T is a consequence of both the increased magnitude SNR as well as the increased phase contrast. However the magnitude SNR depends on tissue T2*, which becomes shorter with higher field strength. This can be seen in Figure 2, where the slope between 7T and 3T R2* was found to be 2.2, close to the expected value of 7/3 ≈ 2.3.46 This affects the actual observed phase SNR.47 Indeed, in this work, the phase SNR increase with field strength (3.2 folds) was lower than the expected value of (7/3)2 ≈ 5.4.45,48 Changes in tissue T1 additionally affect this relationship. The low image quality scores for the 3T 5 echo protocol is a consequence of the generally poor white matter / gray matter contrast, on which the image quality score was partially based in this work. When a specific clinical application requires the visualization of anatomical regions with a higher susceptibility difference (such as cerebral veins or certain deep gray matter regions), a 5 echo protocol at 3T may be sufficient, but this was not investigated in this study.
The reproducibility of QSM at 7T and concordance among 7T and 3T QSMs may be explained in part by QSM’s insensitivity to shimming. In fact, 7T QSM was performed without high order shimming, with only linear order shimming. The background field removal or general dipole-deconvolution in QSM reconstruction may explain its insensitivity to shimming. The field due to sources outside the tissue of interest is separated from the tissue induced field in QSM reconstruction. The separation between background and tissue fields is very effectively achieved by using the Laplacian property of the background field.7,20,25 Therefore, QSM reconstruction intrinsically performs shimming in post-processing.
The insensitivity of QSM to inhomogeneity may also contribute to the reproducibility of QSM at 7T and acceptable concordance among 7T and 3T QSMs. A challenge of 7T MRI is the inhomogeneity of the transmit RF field due to the wave characteristics of electromagnetic field, which increases with frequency or . Although reduced at lower flip angles such as the ones used in this work, inhomogeneity is a concern for causing artificial contrasts in typical magnitude-based imaging. Fortunately, the contrasts in the multiple echo derived field and corresponding QSM images are insensitive to inhomogeneity, as the Larmor frequency is determined by the field that is always sufficiently uniform over the imaging volume. However, phase is observed in single echo phase images leading to the prominent dark ring in the 7T QSM TE1 in Figure 1. Image SNR does depend on inhomogeneity but this effect may be mitigated by the regularization in QSM reconstruction.
The intra-and inter-scanners reproducibility observed here using Bland-Altman analysis is consistent with literature on QSM reproducibility.26–33 This suggests practical applications for QSM to advance the MRI study of tissue magnetic susceptibility from simple qualitative detection of its hypointense blooming artifacts to precise measurement of its biodistributions.19 High resolution 7T QSM may be especially useful for studying cortical pathological changes in Alzheimer’s disease14,49 and multiple sclerosis.50
This study may be improved in several aspects. 1) The data acquisition at 7T should be further optimized. The first echo time may be shortened to reduce signal loss for structures of high T2* signal decay at 7T, which would benefit QSM depiction of these structures. Higher order shimming on product scanners and specialized shimming may be used to reduce T2* decay caused by the inhomogeneous background field. The echo train length and flip angle need to be adjusted for optimal SNR efficiency, which would be useful for high spatial resolution QSM at 7T. 2) The susceptibility value measured on 7T was observed to be lower than that on 3T (Figures 5–8). This underestimation may be caused by discretization of the finite voxel size and is expected to increase with field strength due to greater dephasing,51 as well as possible decrease of susceptibility with field strength.17 The results in this study suggest that the estimated susceptibility is also influenced by the choice of the number of echoes, consistent with prior work investigating this dependence.33,52,53 This dependence is somewhat more apparent at 7T compared to 3T in terms of bias (Figure 7F vs Figure 7A) for the ROIs investigated in this study, which were predominantly deep gray matter regions. The fiber orientation of the surrounding white matter likely plays a role here.52,53 Imperfection in removing background field effects may also contribute to the lower values in the dentate nuclei. This susceptibility underestimation at ultra-high-field should be further investigated and corrected for, including calibration on phantoms of deoxyheme, ferritin and hemosiderin, major paramagnetic iron sources in brain tissue. 3) Additional investigation is needed to study white matter susceptibility anisotropy effects on QSM at 7T.35,54,55 Recent studies have shown that tissue microstructure has an effect on the estimated susceptibility56,57 and that this effect is echo time dependent.33,52,53 Further studies elucidating this at 7T are warranted. 4) This study was performed in healthy subjects only and further research is needed to establish the findings of this study in patients. 5) This study did not investigate higher resolution at 7T within the same acquisition time of 3T to demonstrate the benefit of 7T in studying smaller anatomical features.
In conclusion, reproducible QSM values can be obtained with 3T and 7T MRI. At 7T, the number of echoes can be reduced by half to achieve the same image quality of 3T.
Acknowledgments:
This work was supported in part by the NIH (R01NS090464, R01NS095562, R01CA181566, R21EB024366, and S10OD021782). Yi Wang and Pascal Spincemaille are inventors on QSM related patents issued to Cornell University. Yi Wang and Pascal Spincemaille hold equity in Medimagemetric LLC. Julie Anderson, Gaohong Wu, Baolian Yang, Maggie Fung, Ke Li, Douglas Kelley, and Nissim Benhamo are employees of GE Healthcare.
Footnotes
Disclosure: The remaining authors declare that they have no disclosures.
References
- 1.Ladd ME, Bachert P, Meyerspeer M, et al. Pros and cons of ultra-high-field MRI/MRS for human application. Prog Nucl Magn Reson Spectrosc 2018;109:1–50. [DOI] [PubMed] [Google Scholar]
- 2.Barisano G, Sepehrband F, Ma S, et al. Clinical 7 T MRI: Are we there yet? A review about magnetic resonance imaging at ultra-high field. Br J Radiol 2019;92:20180492. [DOI] [PMC free article] [PubMed] [Google Scholar]
- 3.Wang Y Principles of magnetic resonance imaging: Physics concepts, pulse sequences, & biomedical applications. Scotts Valley, CA: CreateSpace Independent Publishing Platform; 2012. [Google Scholar]
- 4.Haacke EM, Reichenbach JR. Susceptibility weighted imaging in MRI: Basic concepts and clinical applications. Hoboken, NJ: Wiley-Blackwell; 2011. [Google Scholar]
- 5.Vaughan JT, Garwood M, Collins CM, et al. 7T vs. 4T: RF power, homogeneity, and signal-to-noise comparison in head images. Magn Reson Med 2001;46:24–30. [DOI] [PubMed] [Google Scholar]
- 6.Lee J, Fukunaga M, Duyn JH. Improving contrast to noise ratio of resonance frequency contrast images (phase images) using balanced steady-state free precession. Neuroimage 2011;54:2779–88. [DOI] [PMC free article] [PubMed] [Google Scholar]
- 7.de Rochefort L, Liu T, Kressler B, et al. Quantitative susceptibility map reconstruction from MR phase data using bayesian regularization: Validation and application to brain imaging. Magn Reson Med 2010;63:194–206. [DOI] [PubMed] [Google Scholar]
- 8.Wang Y, Spincemaille P, Liu Z, et al. Clinical quantitative susceptibility mapping (QSM): Biometal imaging and its emerging roles in patient care. J Magn Reson Imaging 2017;46:951–71. [DOI] [PMC free article] [PubMed] [Google Scholar]
- 9.Liu T, Eskreis-Winkler S, Schweitzer AD, et al. Improved subthalamic nucleus depiction with quantitative susceptibility mapping. Radiology 2013;269:216–23. [DOI] [PMC free article] [PubMed] [Google Scholar]
- 10.Zhang Y, Gauthier SA, Gupta A, et al. Magnetic susceptibility from quantitative susceptibility mapping can differentiate new enhancing from nonenhancing multiple sclerosis lesions without gadolinium injection. AJNR Am J Neuroradiol 2016;37:1794–9. [DOI] [PMC free article] [PubMed] [Google Scholar]
- 11.Deistung A, Schweser F, Wiestler B, et al. Quantitative susceptibility mapping differentiates between blood depositions and calcifications in patients with glioblastoma. PLoS One 2013;8:e57924. [DOI] [PMC free article] [PubMed] [Google Scholar]
- 12.Chen W, Zhu W, Kovanlikaya I, et al. Intracranial calcifications and hemorrhages: Characterization with quantitative susceptibility mapping. Radiology 2014;270:496–505. [DOI] [PMC free article] [PubMed] [Google Scholar]
- 13.Tan H, Liu T, Wu Y, et al. Evaluation of iron content in human cerebral cavernous malformation using quantitative susceptibility mapping. Invest Radiol 2014;49:498–504. [DOI] [PMC free article] [PubMed] [Google Scholar]
- 14.Acosta-Cabronero J, Williams GB, Cardenas-Blanco A, et al. In vivo quantitative susceptibility mapping (QSM) in Alzheimer’s disease. PLoS One 2013;8:e81093. [DOI] [PMC free article] [PubMed] [Google Scholar]
- 15.Murakami Y, Kakeda S, Watanabe K, et al. Usefulness of quantitative susceptibility mapping for the diagnosis of parkinson disease. AJNR Am J Neuroradiol 2015;36:1102–8. [DOI] [PMC free article] [PubMed] [Google Scholar]
- 16.Zhang J, Liu T, Gupta A, et al. Quantitative mapping of cerebral metabolic rate of oxygen (CMRO2 ) using quantitative susceptibility mapping (QSM). Magn Reson Med 2015;74:945–52. [DOI] [PMC free article] [PubMed] [Google Scholar]
- 17.Liu T, Spincemaille P, de Rochefort L, et al. Unambiguous identification of superparamagnetic iron oxide particles through quantitative susceptibility mapping of the nonlinear response to magnetic fields. Magn Reson Imaging 2010;28:1383–9. [DOI] [PMC free article] [PubMed] [Google Scholar]
- 18.Li J, Lin H, Liu T, et al. Quantitative susceptibility mapping (QSM) minimizes interference from cellular pathology in R2* estimation of liver iron concentration. J Magn Reson Imaging 2018;48:1069–79. [DOI] [PMC free article] [PubMed] [Google Scholar]
- 19.Li J, Chang S, Liu T, et al. Reducing the object orientation dependence of susceptibility effects in gradient echo MRI through quantitative susceptibility mapping. Magn Reson Med 2012;68:1563–9. [DOI] [PMC free article] [PubMed] [Google Scholar]
- 20.Wang Y, Liu T. Quantitative susceptibility mapping (QSM): Decoding MRI data for a tissue magnetic biomarker. Magn Reson Med 2015;73:82–101. [DOI] [PMC free article] [PubMed] [Google Scholar]
- 21.Haacke EM, Liu S, Buch S, et al. Quantitative susceptibility mapping: Current status and future directions. Magn Reson Imaging 2015;33:1–25. [DOI] [PubMed] [Google Scholar]
- 22.Langkammer C, Schweser F, Shmueli K, et al. Quantitative susceptibility mapping: Report from the 2016 reconstruction challenge. Magn Reson Med 2018;79:1661–73. [DOI] [PMC free article] [PubMed] [Google Scholar]
- 23.Liu C, Wei H, Gong NJ, et al. Quantitative susceptibility mapping: Contrast mechanisms and clinical applications. Tomography 2015;1:3–17. [DOI] [PMC free article] [PubMed] [Google Scholar]
- 24.Reichenbach JR, Schweser F, Serres B, et al. Quantitative susceptibility mapping: Concepts and applications. Clin Neuroradiol 2015;25(Suppl 2):225–30. [DOI] [PubMed] [Google Scholar]
- 25.Schweser F, Robinson SD, de Rochefort L, et al. An illustrated comparison of processing methods for phase MRI and QSM: Removal of background field contributions from sources outside the region of interest. NMR Biomed 2017;30. [DOI] [PMC free article] [PubMed] [Google Scholar]
- 26.Santin MD, Didier M, Valabregue R, et al. Reproducibility of R2 * and quantitative susceptibility mapping (QSM) reconstruction methods in the basal ganglia of healthy subjects. NMR Biomed 2017;30. [DOI] [PubMed] [Google Scholar]
- 27.Deh K, Nguyen TD, Eskreis-Winkler S, et al. Reproducibility of quantitative susceptibility mapping in the brain at two field strengths from two vendors. J Magn Reson Imaging 2015;42:1592–600. [DOI] [PMC free article] [PubMed] [Google Scholar]
- 28.Feng X, Deistung A, Reichenbach JR. Quantitative susceptibility mapping (QSM) and R2(*) in the human brain at 3T: Evaluation of intra-scanner repeatability. Z Med Phys 2018;28:36–48. [DOI] [PubMed] [Google Scholar]
- 29.Hinoda T, Fushimi Y, Okada T, et al. Quantitative susceptibility mapping at 3 T and 1.5 T: Evaluation of consistency and reproducibility. Invest Radiol 2015;50:522–30. [DOI] [PubMed] [Google Scholar]
- 30.Lin PY, Chao TC, Wu ML. Quantitative susceptibility mapping of human brain at 3T: A multisite reproducibility study. AJNR Am J Neuroradiol 2015;36:467–74. [DOI] [PMC free article] [PubMed] [Google Scholar]
- 31.Deh K, Kawaji K, Bulk M, et al. Multicenter reproducibility of quantitative susceptibility mapping in a gadolinium phantom using MEDI+0 automatic zero referencing. Magn Reson Med 2019;81:1229–36. [DOI] [PMC free article] [PubMed] [Google Scholar]
- 32.Spincemaille P, Liu Z, Zhang S, et al. Clinical integration of automated processing for brain quantitative susceptibility mapping: Multi-site reproducibility and single-site robustness. J Neuroimaging 2019. [Epub ahead of print] [DOI] [PMC free article] [PubMed] [Google Scholar]
- 33.Lancione M, Donatelli G, Cecchi P, et al. Echo-time dependency of quantitative susceptibility mapping reproducibility at different magnetic field strengths. Neuroimage 2019;197:557–64. [DOI] [PubMed] [Google Scholar]
- 34.Wharton S, Schafer A, Bowtell R. Susceptibility mapping in the human brain using threshold-based k-space division. Magn Reson Med 2010;63:1292–304. [DOI] [PubMed] [Google Scholar]
- 35.Li X, Vikram DS, Lim IA, et al. Mapping magnetic susceptibility anisotropies of white matter in vivo in the human brain at 7 T. Neuroimage 2012;62:314–30. [DOI] [PMC free article] [PubMed] [Google Scholar]
- 36.Langkammer C, Bredies K, Poser BA, et al. Fast quantitative susceptibility mapping using 3D EPI and total generalized variation. Neuroimage 2015;111:622–30. [DOI] [PubMed] [Google Scholar]
- 37.Bian W, Tranvinh E, Tourdias T, et al. In vivo 7T MR quantitative susceptibility mapping reveals opposite susceptibility contrast between cortical and white matter lesions in multiple sclerosis. AJNR Am J Neuroradiol 2016;37:1808–15. [DOI] [PMC free article] [PubMed] [Google Scholar]
- 38.Smith SM. Fast robust automated brain extraction. Hum Brain Mapp 2002;17:143–55. [DOI] [PMC free article] [PubMed] [Google Scholar]
- 39.Jenkinson M, Beckmann CF, Behrens TE, et al. Fsl. Neuroimage 2012;62:782–90. [DOI] [PubMed] [Google Scholar]
- 40.Liu T, Khalidov I, de Rochefort L, et al. A novel background field removal method for MRI using projection onto dipole fields (PDF). NMR Biomed 2011;24:1129–36. [DOI] [PMC free article] [PubMed] [Google Scholar]
- 41.Liu Z, Spincemaille P, Yao Y, et al. MEDI+0: Morphology enabled dipole inversion with automatic uniform cerebrospinal fluid zero reference for quantitative susceptibility mapping. Magn Reson Med 2018;79:2795–803. [DOI] [PMC free article] [PubMed] [Google Scholar]
- 42.Pei M, Nguyen TD, Thimmappa ND, et al. Algorithm for fast monoexponential fitting based on auto-regression on linear operations (ARLO) of data. Magn Reson Med 2015;73:843–50. [DOI] [PMC free article] [PubMed] [Google Scholar]
- 43.Jenkinson M, Smith S. A global optimisation method for robust affine registration of brain images. Med Image Anal 2001;5:143–56. [DOI] [PubMed] [Google Scholar]
- 44.Jenkinson M, Bannister P, Brady M, et al. Improved optimization for the robust and accurate linear registration and motion correction of brain images. Neuroimage 2002;17:825–41. [DOI] [PubMed] [Google Scholar]
- 45.Conturo TE, Smith GD. Signal-to-noise in phase angle reconstruction: Dynamic range extension using phase reference offsets. Magn Reson Med 1990;15:420–37. [DOI] [PubMed] [Google Scholar]
- 46.Yablonskiy DA, Haacke EM. Theory of NMR signal behavior in magnetically inhomogeneous tissues: The static dephasing regime. Magn Reson Med 1994;32:749–63. [DOI] [PubMed] [Google Scholar]
- 47.Wu B, Li W, Avram AV, et al. Fast and tissue-optimized mapping of magnetic susceptibility and T2* with multi-echo and multi-shot spirals. Neuroimage 2012;59:297–305. [DOI] [PMC free article] [PubMed] [Google Scholar]
- 48.Edelstein WA, Glover GH, Hardy CJ, et al. The intrinsic signal-to-noise ratio in NMR imaging. Magn Reson Med 1986;3:604–18. [DOI] [PubMed] [Google Scholar]
- 49.Ayton S, Fazlollahi A, Bourgeat P, et al. Cerebral quantitative susceptibility mapping predicts amyloid-beta-related cognitive decline. Brain 2017;140:2112–9. [DOI] [PubMed] [Google Scholar]
- 50.Chawla S, Kister I, Sinnecker T, et al. Longitudinal study of multiple sclerosis lesions using ultra-high field (7T) multiparametric MR imaging. PLoS One 2018;13:e0202918. [DOI] [PMC free article] [PubMed] [Google Scholar]
- 51.Zhou D, Cho J, Zhang J, et al. Susceptibility underestimation in a high-susceptibility phantom: Dependence on imaging resolution, magnitude contrast, and other parameters. Magn Reson Med 2017;78:1080–6. [DOI] [PubMed] [Google Scholar]
- 52.Sood S, Urriola J, Reutens D, et al. Echo time-dependent quantitative susceptibility mapping contains information on tissue properties. Magn Reson Med 2017;77:1946–58. [DOI] [PubMed] [Google Scholar]
- 53.Cronin MJ, Wang N, Decker KS, et al. Exploring the origins of echo-time-dependent quantitative susceptibility mapping (QSM) measurements in healthy tissue and cerebral microbleeds. Neuroimage 2017;149:98–113. [DOI] [PMC free article] [PubMed] [Google Scholar]
- 54.Wisnieff C, Liu T, Spincemaille P, et al. Magnetic susceptibility anisotropy: Cylindrical symmetry from macroscopically ordered anisotropic molecules and accuracy of MRI measurements using few orientations. Neuroimage 2013;70:363–76. [DOI] [PMC free article] [PubMed] [Google Scholar]
- 55.Liu C, Murphy NE, Li W. Probing white-matter microstructure with higher-order diffusion tensors and susceptibility tensor MRI. Front Integr Neurosci 2013;7:11. [DOI] [PMC free article] [PubMed] [Google Scholar]
- 56.Yablonskiy DA, Sukstanskii AL. Effects of biological tissue structural anisotropy and anisotropy of magnetic susceptibility on the gradient echo MRI signal phase: Theoretical background. NMR Biomed 2017;30. [DOI] [PMC free article] [PubMed] [Google Scholar]
- 57.Lancione M, Tosetti M, Donatelli G, et al. The impact of white matter fiber orientation in single-acquisition quantitative susceptibility mapping. NMR Biomed 2017;30. [DOI] [PubMed] [Google Scholar]


