Abstract
Purpose:
Multi-exponential relaxometry is a powerful tool for characterizing tissue, but generally requires high image signal-to-noise ratio (SNR). This work evaluates the use of principal-component-analysis (PCA) denoising to mitigate these SNR demands and improve the precision of relaxometry measures.
Methods:
PCA denoising was evaluated using both simulated and experimental MRI data. Bi-exponential transverse relaxation signals were simulated for a wide range of acquisition and sample parameters, and experimental data were acquired from three excised and fixed mouse brains. In both cases, standard relaxometry analysis was performed on both original and denoised image data, and resulting estimated signal parameters were compared.
Results:
Denoising reduced the root-mean-square-error of parameters estimated from multi-exponential relaxometry by factors of ≈ 3×, for typical acquisition and sample parameters. Denoised images and subsequent parameter maps showed little or no signs of spatial artifact or loss of resolution.
Conclusion:
Experimental studies and simulations demonstrate that PCA denoising of MRI relaxometry data is an effective method of improving parameter precision without sacrificing image resolution. This simple yet important processing step thus paves the way for broader applicability of multi-exponential MRI relaxometry.
Keywords: MRI, relaxometry, principal component analysis, denoising, myelin, multi-exponential
1 |. INTRODUCTION
Multi-exponential MRI relaxometry is a powerful tool for characterizing tissue at the sub-voxel level, the most well known example of which is the use of multi-exponential T2 (MET2) relaxometry for myelin water imaging in brain [1, 2] and nerve [3]. Similar myelin imaging has been implemented based on multi-exponential relaxometry [4, 5], and other example applications of multi-exponential MRI relaxometry include characterization of muscle [6, 7, 8, 9], cartilage [10, 11], and tumors [12, 13]. Similarly, inversion-recovery based quantitative magnetization transfer is effectively a bi-exponential signal analysis [14]. However, the challenge in making effective use of MET2 or other multi-exponential relaxometry stems from the ill-posed nature of inverting a signal into a linear combination of exponential functions [15]. For many situations, including myelin water imaging, image signal-to-noise ratio (SNR) in the 100s is required for reasonable results [16, 17]. Such high SNR values dictate low resolution and/or long scan times, which has limited the use of multi-exponential MRI relaxometry.
These SNR demands can be mitigated to some extent through conventional image-domain filtering [18] or joint regularization in the spectral and spatial domains [19, 20], although there is a corresponding cost in spatial resolution of the fitted parameter maps. Edge-preserving image-domain filters have been used (for example, anisotropic diffusion [21] and non local means [22] filters), but the fundamental trade-off between parameter map precision and resolution remains. Recent work using low rank representations of MRI signals offers an alternative approach to improving parameter maps precision. For example, the redundancy of information in multiple spin echo images has been used to produce higher quality images [23] and faster acquisition for mono-exponential T2 mapping [24, 25, 26]. Further, low rank denoising has been demonstrated effective for improving precision of chemical shift imaging data [27], and fat fraction maps [28, 29] derived from multiple gradient echo acquisitions. Similarly, principal component analysis (PCA) has been used for denoising diffusion weighted imaging data sets for improved precision of diffusion tensor or other parametric characterizations [30, 31, 32]. To our knowledge, no such low rank approach has been evaluated for improving precision of parameter maps derived from multi-exponential signal characterizations. Thus, we present an evaluation of a particular PCA denoising method [32] for multi-exponential MRI relaxometry data, with the specific aim of improving precision of myelin water imaging.
2 |. METHODS
2.1 |. Simulations
Simulated data were designed to mimic myelin water imaging by MET2 relaxometry in human brain at 3.0T. Model multiple spin echo (MSE) images, I, of dimension Nx × Ny = 100 × 100 were generated at spin echo times t = TE to NETE. The signal in each voxel was defined as the sum of two exponential decays, with time constants T2s (short-lived) and T2l (long lived),
| (1) |
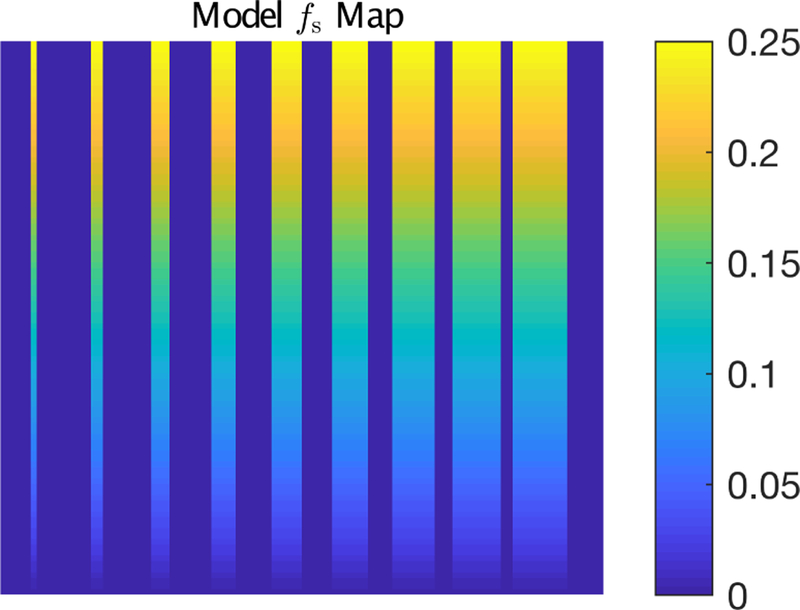
In all cases, T2s < T2l, and so the parameter map, fs, was the map of the short T2 signal fraction. This map was constructed with fs values ranging 2.5 × 10⁻³ to 0.25 in vertical strips with widths ranging 1 to 9 pixels (see Fig 1). Within these strips, the simulated signals were meant to reflect white matter signals, with fs being the myelin water fraction (MWF), and between the strips, where fs = 0, the simulated signals were meant to reflect gray matter signals. For each pixel location, (j, k), the relaxation time constants, T2s and T2|, were randomly drawn from normal distributions, and , respectively. Simulations were repeated for σT2l = 1 to 10 ms, in 1 ms steps, and for five NE,TE combinations spanning 26,12 ms to 80,4 ms. For each combination of signal parameters, a complex noisy image, In, was generated as
| (2) |
where, values ηre (i, j, k) and ηim (i, j, k) were each randomly drawn from a normal distribution, . Simulations were repeated across a log-space range of SNR values, 25 to 1600, with SNR ≜ 1/σ. For the case of NE = 40, TE = 8 ms, and σT2l = 5 ms, simulations were also run to mimic the effect of imperfect refocusing. For this, signals were generated using the extended phase graph algorithm [33], assuming T1 = 1s and refocusing pulse flip angle θ = 155°.
FIGURE 1.
Model map of fs used for the simulations. The non-zero values of fs ranged 2.5 × 10⁻³ to 0.25 in vertical strips of widths ranging 1 to 9 pixels.
2.2 |. MRI
In order to evaluate the denoising on experimental data across a wide range of image SNR values, MRI studies were performed on ex vivo mouse brains. Animal experiments were approved by the Vanderbilt Institutional Animal Care and User Committee. The brains of 3 adult mice were perfusion-fixed (2.5% glutaraldehyde + 2% paraformaldehyde), washed of fixative, and loaded (during and following perfusion) with 1.0 mM gadolinium (Prohance; Bracco Diagnostics, Princeton, NJ). The fixed mouse brains were imaged using a 7T 16cm horizontal bore Bruker BioSpec scanner (Rheinstetten, Germany), using a 25 mm diameter quadrature volume coil for transmission and reception (Doty Scientific, Columbia, SC). To provide a signal-free background and prevent tissue dehydration, brains were placed in an MR-compatible tube filled with perfluoropolyether liquid (Fomblin, Solvay Solexis, Thorofarem NJ, USA). For each brain, a single 0.75 mm thick coronal slice was selected to provide relatively uniform white matter through plane in the middle of the corpus callosum.
Two multi-exponential MRI methods were evaluated, both of which are currently being used for quantitative myelin mapping in excised rodent brain [34]. Both scan protocols were run with with 150 × 150 μm2 in plane resolution. Myelin water imaging was performed using a MSE sequence with refocusing-to-excitation bandwidth ratio = 4.6, NE = 40, TE = 5 ms (uniform echo spacing), TR = 800 ms, and number of averaged excitations (NA) = 4. Quantitative magnetization transfer imaging was performed using a inversion-recovery (IR) prepared RARE sequence with 5 ms echo spacing, centric phase encoding, NI = 15 inversion times log-spaced from 5 to 1500 ms, and NA = 1. For each brain, each protocol was repeated up to 64 times and the complex image data were cumulatively averaged. This resulted in images sets with NA up to 256 for the MSE scans and up to 64 for the IR scans.
2.3 |. Data analysis
2.3.1 |. Denoising
The PCA image denoising algorithm used in this study was presented in detail by Veraart et al. [32] and is briefly summarized here in the context of relaxometry. Let be signals from a subset of Nv voxels acquired with Nq different signal contrasts. In the context of the studies presented here, Nq = NE for the MSE images or Nq = NI for the IR images. Let be the mean signal across the Nv voxels, and then the mean-removed signal matrix can be factored by singular value decomposition, . From here, the eigenvalues of the sample data covariance matrix are, , i = 1 to M, where M = min (Nv, Nq). For a sufficient SNR, one can assume that the P largest eigenvalues correspond to the eigenvectors that predominantly characterize signal, and the remaining M – P eigenvectors predominantly characterize the added noise. For independent and identically distributed (iid) zero-mean random noise, λ is a random variable described by the Marcenko-Pastur (MP) distribution [35], which is fully characterized by the noise variance (σ2) and data dimensions (Nq and Nv). Thus, when X is noisy data, P and σ can be jointly estimated by determining the minimum value of P such that the λP+1 to λM eigenvalues are well described by the MP distribution. A fast and simple approach to do this, introduced by Veraart et al. [32], is to find the minimum P for which the . This works because the inclusion of signal-derived eigenvalues that are sufficiently greater than those from noise causes the range of λ (left hand side of the test inequality) to grow much faster than its sample mean (right hand side). Finally, the denoised signal can be reconstructed using only the S1,1 to SP,P singular values, corresponding singular vectors U (:, 1:P) and V (:, 1:P), and .
For the mouse brain images, an intensity threshold was used to define a mask of the whole brain, and within this mask, the denoising was performed over a Nw × Nw moving window. For the simulated images, the mask included the entire 100 × 100 image space. In both cases, the window size was defined as ; a smaller Nw would result in fewer principal components for each moving window step, while a larger Nw would increase the input signal variation within the window without providing more principal components. However, as discussed below, the optimal strategy for defining the size, shape, or other definition of the region used as input for each denoising step remains an open question. Also, while this denoising algorithm, including the joint estimation of P and σ, is equally valid for real or complex signals, it is not, strictly speaking applicable to magnitude MRI data. (To be clear, the MP-distribution is twice as large for complex compared to real noise, but this scales the range and mean identically, so the test inequality remains the same.) For Rician- or non-central-χ-distributed magnitude data, which may be the only data available from an MRI study, the λp+1 to λM eigenvalues are not MP-distributed. Nonetheless, the same denoising algorithm is applied here to both the complex and magnitude data, and the performance difference between the two scenarios is compared.
2.3.2 |. Parameter Estimation
From each voxel of both the noisy and denoised MSE image sets, T2 was estimated as a spectrum using the freely available multi-exponential relaxation analysis (MERA) toolbox for MATLAB. Briefly, echo magnitudes were fitted in a non-negative least squares sense with spectrum defined at 100 T2 values, logarithmically spaced between 3/4TE and 4/3NeTe, plus an offset term. For the sub-set of simulation data generated assuming 155° refocussing pulses and the mouse brain data, the analysis included fitting the refocussing flip angle [36]. For the mouse brain data only, a constant (across voxels) minimum curvature constraint was used to smooth each T2 spectrum. Because the simulated data were known to be derived from two discrete T2 components their fitted spectra were not regularized. From each T2-spectrum, the estimated short-lived T2 signal fraction and geometric mean T2 of the long-lived signal were computed. The short T2 domain was defined as TE < T2 < 35 ms for the simulations and TE < T2 < 27 ms for the mouse brain data. The long T2 domain was everything above the upper boundary of the short T2 domain. Different domains were needed for simulations and experimental data because simulations mimicked relaxation at 3.0T while the experimental data were collected at 7.0T.
For qMT analysis, the NI image magnitudes were fitted voxel-wise to the Bloch-McConnell equations describing coupled longitudinal relaxation of water and macromolecular protons [14, 37]. The five fitted model parameters included equilibrium magnetizations of the macromolecular (M0m) and water (M0w) proton pools, the rate constant of magnetization transfer from the macromolecular to water pool (kmf), the longitudinal relaxation rate of the water protons (R1f), and the efficiency of the inversion pulse on the water magnetization (Sw). The corresponding R1m and Sm values were constrained to 1 s−1 and 0.83, respectively, in accord with prior studies [14]. The macromolecular proton fraction, was defined as .
3 |. RESULTS
3.1 |. Simulations
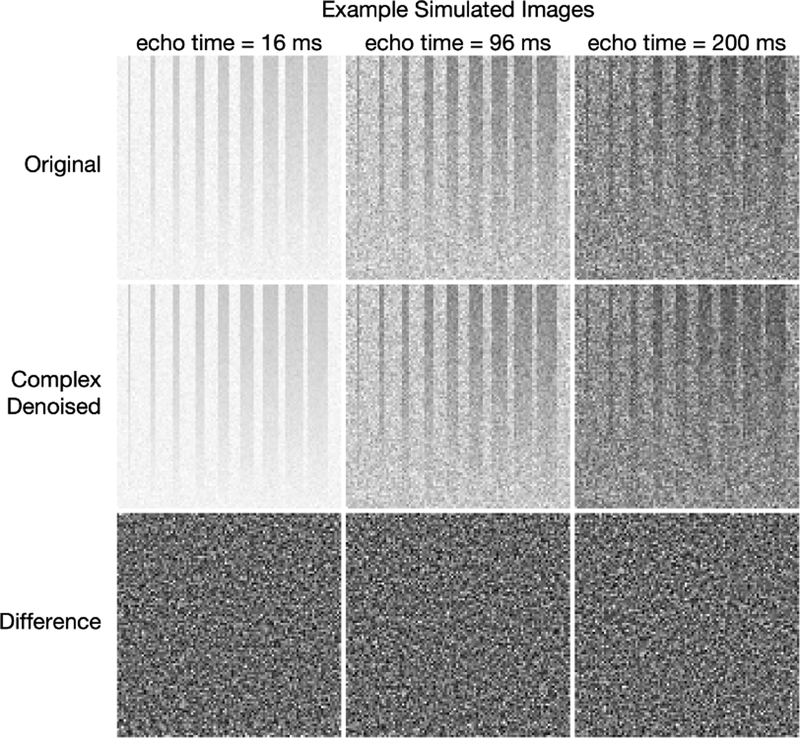
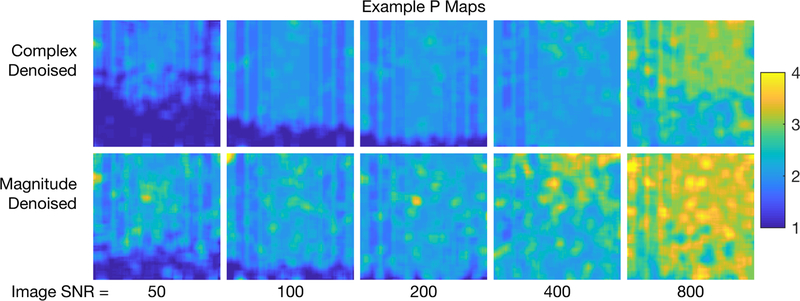
For one example scenario (NE = 40, TE = 8 ms, σ = 5 ms, and SNR = 200), Fig 2 shows original, complex denoised, and difference images. Similar images resulting from magnitude denoising can be seen in supporting Fig S1. Because T2s and T2l varied randomly across the image, the effect of the denoising is difficult to appreciate from the images, but it is easy to see that the sharp boundaries of regions with non-zero fs were retained. The difference images are somewhat more informative, showing little or no structure, with the exception of some features in the lower part of the difference images at echo time = 16 ms. (These second-echo images were chosen as examples because they showed the largest deviations from randomness in the difference image.) These non-random difference image features indicate that, in this region of the image, too few principal components were retained to fully characterize the signal. This is apparent from the maps of the average P value resulting from the MP-PCA denoising for the example simulated images at different SNR values, shown in Fig 3.
FIGURE 2.
Example simulated images from the scenario with NE = 40, TE = 8ms, σT2l = 5 ms, and SNR = 200. The top row shows original noisy images. The second and third rows show the complex denoised images and the difference images, respectively. At each different echo time, the original and denoised images are all displayed using the same grayscale, and all three differences images are scaled to ±3σ.
FIGURE 3.
Maps of the average number of retained principal components in the MP-PCA denoising (P value) for the example scenario NE = 40, TE = 8 ms, σT2l = 5 ms, and SNR values 50 to 800.
For a quantitative assessment of the denoising, the standard deviation of the noise in the denoised images was computed in two ways. A direct calculation was made from the complex difference between the ground truth and denoised images as
| (3) |
where var [·] indicates the variance computed across all pixels, and Id is the denoised image. With the simplifying assumption that the denoising removed only random noise, an approximate estimate of was also made using the complex difference between the noisy and denoised images,
| (4) |
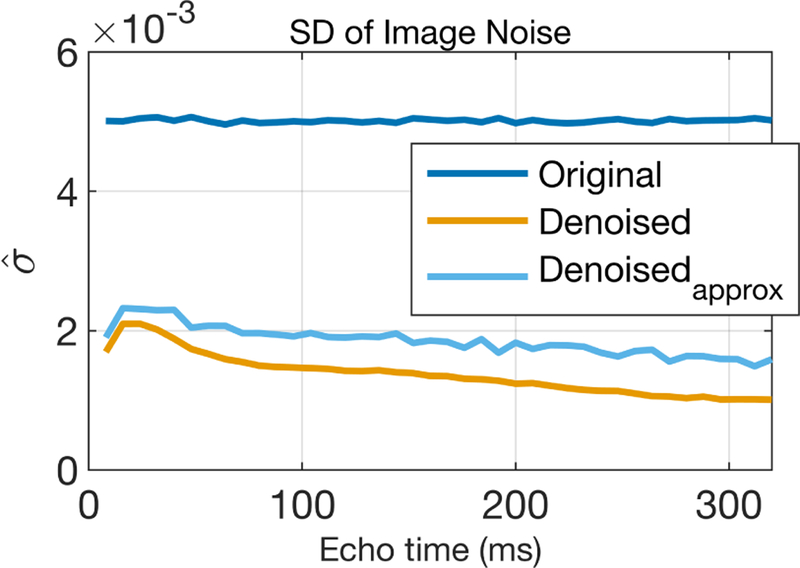
This calculation used the known noise variance of the original image (σ2), which can be replaced by an empirical estimate when dealing with experimental MRI data (as done below, for the mouse brain images). A plot of these two noise measures from the complex denoised images for the example scenario is shown in Fig 4. The values indicate that denoising reduced the standard deviation (SD) of the noise by ≈ 2.5× for the first echo image. The observed decrease in with increasing echo time likely reflects some inaccuracies imparted by the denoising. That is, if the denoising does not perfectly capture all the true signal decay, then will incorporate both the thermal noise and denoising errors. As the signal amplitude drops with increasing echo time, so will the amplitude of denoising error. This figure also shows that serves as a reasonable approximation for , without the need for a ground truth image data.
FIGURE 4.
Calculated image SNR values before and after denoising.
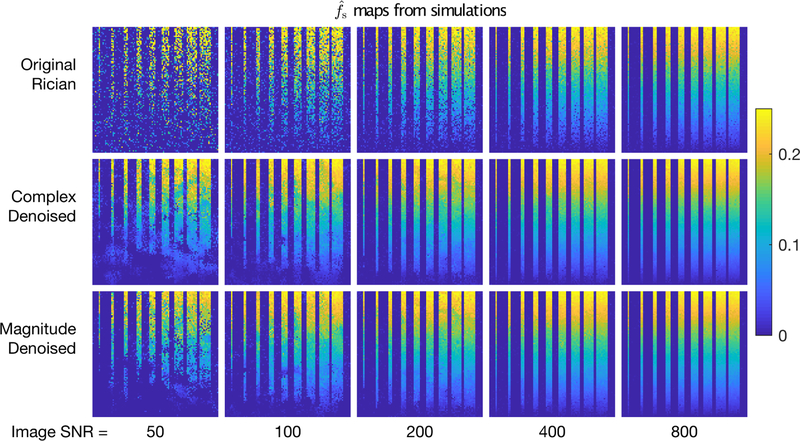
Although denoising increased image SNR substantially, of more importance to relaxometry are the effects of denoising on parameter estimates. For the same example scenario as above and five image SNR values, maps of are shown in Fig 5. In all cases, it is immediately apparent that denoising either the complex or magnitude images before relaxometry analysis resulted in much smoother maps, without apparent loss of resolution. Comparable maps of are not particularly informative because the values of T2I varied randomly across the image;however, scatter plots and vs ground truth values for example scenarios are shown in supporting Figs S2 and S3. Across all SNR values, the increased precision of both and is readily apparent. At low SNR, due to the Rician nature of the noise, fitting of the original data resulted in bias of both and . Complex denoising reduced these parameter biases by lowering the image noise floor prior to analysis;magnitude denoising was less effective at removing these biases, because the denoising algorithm retained principal components that characterized the Rician signal offset.
FIGURE 5.
Maps of estimated short T2 signal fraction from simulated images with five different SNR values. The top row shows results from relaxometry analysis of the original images, while the middle and bottom rows show results from analysis of complex and magnitude denoised images, respectively.
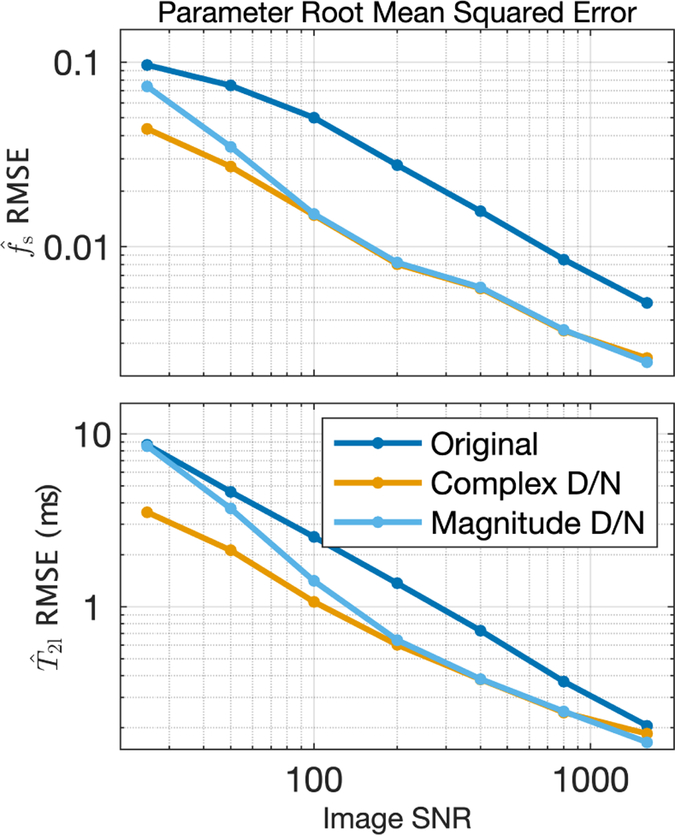
In addition to these Rician-induced biases, at low image SNR, the thin strips of low fs were not captured in any of the maps (see the lower left regions of the maps in Fig 5). This is the same image region that showed structure in the difference images in Fig 2 and reduced P values in Fig 3, and so the implication is that the eigenvalues of the principal components needed to capture these low amplitude fast-relaxing signals were not distinguishable from noise. Nonetheless, in this region, and across the entire image, denoising resulted in lower root mean square error (RMSE) in . Fig 6 shows the total (i.e., across entire image) RMSE of both and vs image SNR for the same example scenario (NE = 40, TE = 8 ms, σT2l = 5 ms). Across all values of image SNR tested, the RMSE of dropped by factors of 1.8 to 3.1 due to complex denoising and 1.3 to 3.0 from magnitude denoising. For , the benefit of denoising was less;RMSE dropped by factors of 1.1 to 2.4 and 1.0 to 2.2 for complex and magnitude denoising, respectively. Importantly, in no case scenario tested, (i.e., all NE,TE combinations and all values of σT2l), did the the RMSE of increase due to denoising. Across all scenarios, the factors of RMSE reduction for ranged 1.1 to 4.0 and 1.1 to 3.4 for complex and magnitude denoising, respectively. The corresponding ranges for were 0.8 to 6.1 and 0.9 to 2.4, indicating that there were cases where denoising resulted in greater RMSE. However, this only happened in a few high precision cases (i.e., high SNR & high NE) where the RMSE of , even without denoising.
FIGURE 6.
RMSE values of and computed from original and denoised images, for image SNR values 50 to 1600.
Supporting Fig S4 shows RMSE reduction factors for some additional example scenarios. Briefly, these indicate that i) denoising provides a greater benefit when there is less inter-voxel variation in relaxation rate (i.e., smaller σT2l), and ii) that the dependence on NE is similar to the dependence on SNR, as one might expect. Also, supporting Fig S5 shows the RMSE of and (similar to Fig 6) from the simulations mimicking imperfect refocusing (θ = 155°). These results indicate that denoising is essentially equally effective at moderate values of image SNR, but loses some effectiveness at high SNR values. The additional signal variations induced from imperfect refocusing result in slightly greater denoising errors which become a greater factor in parameter RMSE when the thermal noise becomes quite low.
3.2 |. MRI
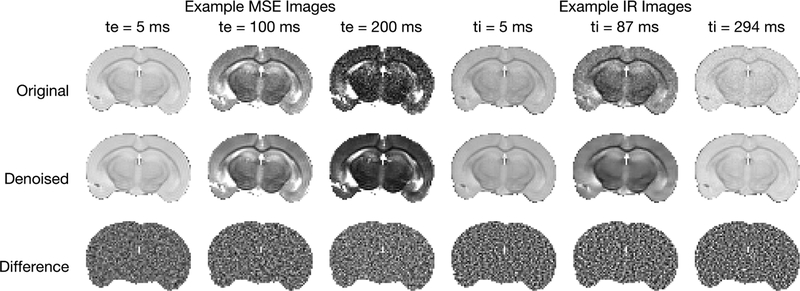
Example mouse brain images (original, complex denoised, and the difference images) are shown in Fig 7 for MSE (NA = 12) and IR (NA = 14) acquisitions, at three different contrast levels each. The impact of denoising on image quality is visually apparent and the difference images show no apparent structure, suggesting that the MP-PCA primarily removed noise. The image SNR was calculated as , where was the mean of a white matter region at the first echo/inversion time. The SD of the noise was calculated as , where was the mean of a background region. For the original images in Fig 7, SNRs were 128 (MSE) and 65 (IR), which are roughly the lowest SNR values that one would use for quantitative MET2 and qMT parameter mapping, respectively. The factor of SNR increase that resulted from denoising was estimated as (see Eq (4)). For the example images in Fig 7, these factors ranged from 1.4 × to 2.3 ×. Across all images (echo/inversion times and NA), the mean image SNR increase factor was 1.9 × for the MSE data and 1.8 × for the IR data. A plot of all image SNR increases can be found in supporting Fig S6, which shows some small variations with echo time or inversion time and as well with NA/SNR over the domains tested.
FIGURE 7.
Example original, denoised, and difference images from MSE (Na = 12)and IR(NA = 14) acquisition at different echo/inversion times.
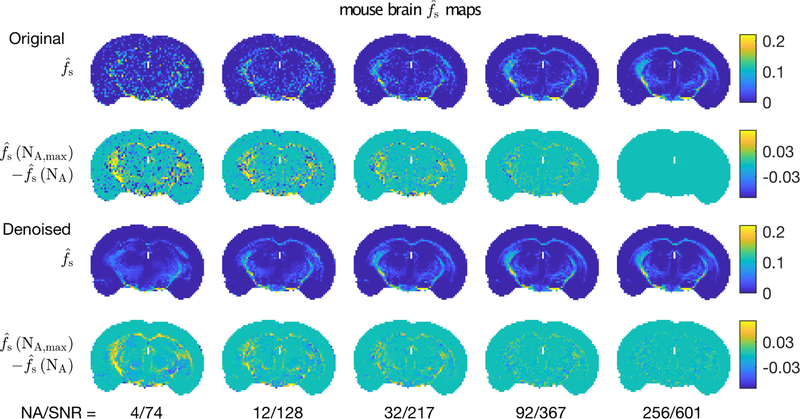
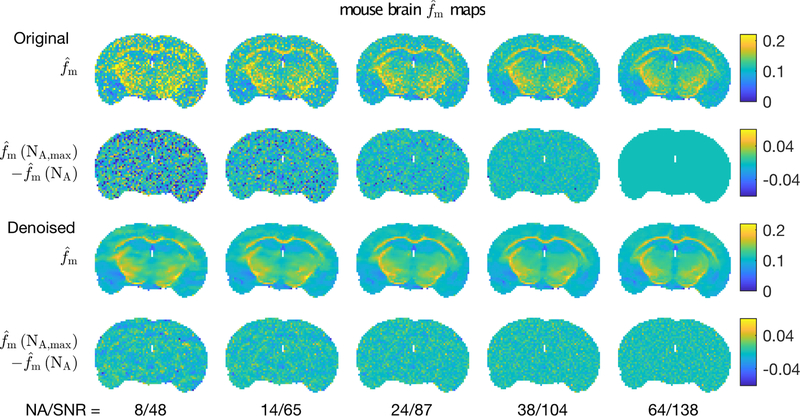
Looking more specifically at the impact of denoising on parameter estimation, Figs 8 and 9 show example and maps from one mouse brain at five different image SNR values. In both cases, the top row shows the parameter maps resulting from analysis of the original data and the third row shows corresponding maps derived from complex denoised images. In lieu of ground truth, parameter maps from original data at the highest image SNR were used as the reference. Thus, the second row shows the difference between original parameter maps and this reference, and the fourth row shows the corresponding differences for the maps from the denoised images. For both MET2 and qMT analyses, denoising the image data improved the resulting parameter map quality, as demonstrated in the first and third rows. In particular, the sharp details of the white matter structures were retained. The difference maps show almost no structure, indicating that the denoising imparted little or no bias or spatial artifact on the qMT analysis. For the maps, the difference images do show structure, particularly in the external capsules and at lower image SNR. However, the biased values were present in maps from both the original and denoised images, indicating these errors were not a consequence of the denoising procedure.
FIGURE 8.
Example maps of from (top) original and (3rd row) denoised mouse brain images, for five different NA/SNR values. The 2nd and 4th rows show differences between these maps and the highest SNR map from original data.
FIGURE 9.
Maps of from (top) original and (3rd row) denoised mouse brain images, for five different NA/SNR values. The 2nd and 4th rows show differences between these maps and the highest SNR map from original data.
Across three different mouse brains and three somewhat different imaging slice locations, the impact of denoising on parameter maps was similar, as can be seen in supporting Fig S7. Also, example parameter maps resulting from complex and magnitude denoised images are shown in supporting Figs S8 and S9. At the low end of the SNRs tested, there are some differences in the maps derived from complex vs magnitude denoising, but for moderate levels of SNR and above, the results were effectively the same, as expected.
DISCUSSION
The simulations and mouse brain MRI demonstrate that MP-PCA denoising can provide substantial improvement to the precision of parameters estimated from multi-exponential MRI signal models. Simulations of MET2 relaxometry meant to mimic myelin water imaging at 3.0T showed that RMSE of the fast relaxing signal fraction—i.e., the MWF—was reduced by 2 – 4× for typical imaging conditions. Experimental studies in mouse brains at 7.0 T showed roughly similar precision improvements for maps of MWF and macromolecular pool fraction. For example, Fig 8 shows comparable quality maps derived from denoised data at SNR = 128 to maps derived from original data at SNR = 367. Likewise, in Fig 9, maps derived from denoised data at SNR = 87 are superior to maps derived from original data at SNR = 138. Also, in both the simulations and experimental studies presented here, these parameter precision gains come without an apparent resolution cost or bias. Of course, there are a number of issues to be considered and/or studied further.
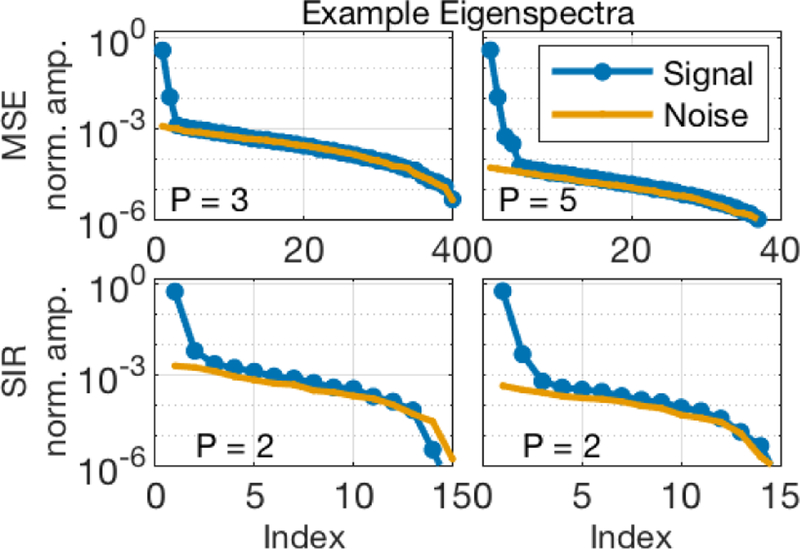
For any PCA/SVD denoising or model reduction, choosing the number of components to retain can be a challenge. Too much rank reduction will result in a model that cannot adequately describe the underlying data, and important details can remain lost in the noise, while retaining too many principal components simply reduces the efficacy of the denoising. Figure 10 shows plots of the PCA eigenvalues from an example Nv voxels overlapping the corpus callosum near the middle of four different mouse brain image sets. For reference, also plotted in each frame are the eigenvalues resulting from randomly generated noise with standard deviation matching that estimated from the image background. The P eigenvalues retained by the MP-PCA algorithm are identified in each frame, and it is reasonable to surmise that various algorithms could be used to identify these same values. The MP distribution [35] offers a theoretically attractive approach for choosing the signal rank cut-off, and because it is data driven, no a priori assumptions about the underlying signal model are needed. In the present implementation, the joint estimation of P and σ is computationally fast, permiffing denoising of Nx × Ny × NE = 100 × 100 × 40 complex images in ≈ 5 sec using MATLAB on desktop computer.
FIGURE 10.
Eigenvalues from the PCA analysis of example Nv voxel regions overlapping the corpus callosum in mouse brain. The top row shows result from MSE images (Nv = 49), acquired with NA = 12 (left) and 256 (right). The bottom shows results from IR images (Nv = 16), acquired with NA = 3 (left) and 64 (right). In each frame, the number of principal components retained from the MP-PCA algorithm, P, is identified.
The primary shortcoming of the MP-PCA algorithm is that the assumption of MP-distributed noise eigenvalues may not be valid for all images sets. When this is the case, P may be overestimated, and, consequently the denoising is less effective. The Rician nature of magnitude images is one cause of such a problem. As shown here in simulation and mouse brain images, at low image SNR, the efficacy of MP-PCA denoising was reduced for magnitude images compared with complex images, although at SNR levels necessary for multi-exponential relaxometry, the denoising was equally effective for magnitude and complex images. On a contemporary clinical scanner, noise characteristics may be altered by a number of processing steps, including signal combination from a multiple channels. For example, we looked at two sets of multiple spin echo magnitude images of human brain, previously acquired at the University of British Columbia using an 8-channel receive coil (NE = 48, TE = 8 ms, TR = 1072 ms, SENSE acceleration = 2×). In both cases, MP-PCA denoising removed almost no noise, finding P > 30 across all brain voxels. However, we re-ran the denoising using a fixed P = 4 (i.e., without the MP algorithm for jointly estimating P and σ) and estimated MWF maps as done for the mouse brain images. The resulting MWF maps (supporting Fig S10) showed improved precision, qualitatively similar to what was observed in the mouse brain studies with images SNR ≈ 200. This demonstrates the potential for PCA denoising independent of the MP based rank selection, although we anticipate that denoising complex images from each receive channel prior to other processing steps will avoid the complications resulting from altered noise characteristics.
This study has not attempted to modify or optimize the MP-PCA image denoising algorithm, but rather has simply applied the method as previously presented [32], with the minor modification of removing the mean signal across voxels prior to SVD factorization. With this algorithm, each PCA denoising step is applied to a local square (or cube, for 3D imaging) of Nv voxels, which means that the denoising performance will vary with tissue heterogeneity over local region. For accurate parameter estimation, the eigenvalues of a sufficient number of principal components must be well distinguished from the noise in order to characterize the relaxation of all Nv voxels. We have reasoned that Nv ≈ Nq offers the benefit making full use of the Nq images while minimizing the number of components likely needed to characterize the variation of relaxation across the Nv voxels, but this has not been rigorously examined. Further, it is possible that a non-local approach, where the Nv voxels are selected based on similar relaxation characteristics, will offer performance advantages.
An intuitive explanation for the efficacy of the MP-PCA denoising on multi-exponential relaxometry stems from the ill-conditioned nature of the problem. Consider a linear system, y = As, where y is a column of echo magnitudes, s is the spectrum of signal amplitudes as a function of T2 (i.e., the T2-spectrum), and the columns of A are decaying exponential functions spanning the relevant T2 domain. For the case of NE = 40, TE = 8 ms, and A comprised of 100 columns of exponential decays spanning T2 = 10 ms to 500 ms, the rank of A is equal to 18 at double precision roundoff tolerance and only 5 using a tolerance of σ∥A∥∞, where σ = 1 × 10⁻³ is the relative uncertainty in the elements of y (i.e., for image SNR = 1000)[38]. If the columns of A are EPG-defined functions for the case that θ < 180°, the rank of A is greater (depending θ), but only for σ ≾ 5 × 10⁻⁴. This is to say that any linear combination of the columns of A can be expressed effectively (i.e., within the precision of practically any MRI measurement) as a linear combination of only a handful of singular vectors, typically many fewer than the number of echoes acquired.
This rank-deficient characteristic of the multi-exponential signal model has been used for some time to reduce the dimensionality of the numerical inverse Laplace transform [39] (and is part of the aforementioned MERA processing code), and the same idea underlies multi-echo image denoising [23] and sub-sampling strategies for fast parameter mapping [40, 41, 26]. On one hand, this rank deficiency is what makes the inverse solution—estimate of the T2 spectrum—difficult. On the other hand, it means that, even for relatively high image SNR, only a handful of principal components are necessary to characterize all of the signals from a region of voxels, each with somewhat different relaxation characteristics. The same is true for a mono-exponential problem, but the practical payoff of denoising is less because the solution is not ill-conditioned, meaning that a relatively precise estimate of mono-exponential T2, for example, can be achieved with relatively low image SNR.
CONCLUSIONS
The use of PCA denoising offers substantial improvement in the precision of parameters estimated from MRI multi-exponential relaxometry. Of particular interest for neuroimaging, the results indicate that the precision of myelin specific parameter maps may be increased by a factor ≈ 3× for typical acquisition parameters. When image noise characteristics have by altered by post-processing steps, as is common on clinical scanners, the optimal approach to determining the extent of rank reduction remains an open question.
Supplementary Material
Fig S1 Example simulated images from the scenario with NE = 40, TE = 8 ms, σT2l = 5 ms, and SNR = 200. The top row shows original noisy images. The second and third rows show the magnitude denoised images and the difference images, respectively. At each different echo time, the original and denoised images are all displayed using the same grayscale, and all three differences images are scaled to ±3σ.
Fig S2 Scatter plots of estimate short T2 signal fraction, , vs the ground truth, fs, for the example scenario of NE = 40, TE = 8 ms, and σT2l = 5 ms.
Fig S3 Scatter plots of estimate long T2, , vs the ground truth, T2l, for the example scenario of NE = 40, TE = 8 ms, and σT2l= 5 ms.
Fig S4 Measure of the relative decrease in parameter RMSE due to denoising, as a function of σT2l (left), NE (right), and image SNR (color). For all frames, the vertical axis is Γ(p) ≜ RMSEo (p) /RMSEd (p), where subscripts ‘o’ and ‘d’ indicate ‘original’ and ‘denoised’, respectively, and ‘p’ is the fitted parameter of interest.
Fig S5 RMSE values of and computed from original and denoised images, for simulations using θ = 155° and image SNR values 50 to 1600.
Fig S6 Relative increase in mouse brain image SNR after denoising, as a function of echo time (MSE, top) or inversion time (IR, bottom) and NA (color). Note that NA ranges 4 to 256 for MSE and 1 to 64 for IR.
Fig S7 Example and parameter maps from three different mouse brains. Parameter intensities vary some between brains/slice location, but the improvement in parameter map quality due to denoising is qualitatively similar in all cases.
Fig S8 A comparison of maps from original, complex denoised, and magnitude denoised images. Except at low image SNR, the effect of complex and magnitude denoising on maps was similar.
Fig S9 A comparison of maps from original, complex denoised, and magnitude denoised images. Except at low image SNR, the effect of complex and magnitude denoising on maps was similar.
Fig S10 A comparison of maps from original and magnitude denoised images acquired with an 8-channel receive coil on a Philips 3.0T scanner. The PCA denoising was done by retaining a fixed P = 4 principal components, rather than using the MP algorithm.
ACKNOWLEDGEMENTS
The authors thank Dr. Robert Carson and Mr. Dong Kyu Kim of Vanderbilt University for providing the fixed mouse brains, and we thank Drs Alex Mackay, Cornelia Laule, and Irene Vavasour of the University of British Columbia for generously sharing human brain multiple spin echo images.
The MERA toolbox for MATLAB is available at https://github.com/markdoes and the MP-PCA image denoising code is available at https://github.com/sunenj.
Funding information
European Research Council, 679058; The Danish National Research Foundation the Danish Ministry of Science, Innovation, and Education; The National Institutes of Health, EB019980
REFERENCES
- [1].MacKay A, Whittall K, Adler J, Li D, Paty D, Graeb D. In-Vivo Visualization of Myelin Water in Brain by Magnetic-Resonance. Magn Reson Med 1994;31(6):673–677. [DOI] [PubMed] [Google Scholar]
- [2].Whittall K, MacKay A, Graeb D, Nugent R, Li D, Paty D. In vivo measurement of T-2 distributions and water contents in normal human brain. Magn Reson Med 1997;37(1):34–43. [DOI] [PubMed] [Google Scholar]
- [3].Does M, Snyder R. Multiexponential T-2 relaxation in degenerating peripheral nerve. Magn Reson Med 1996;35(2):207–213. [DOI] [PubMed] [Google Scholar]
- [4].Du YP, Chu R, Hwang D, Brown MS, Kleinschmidt-DeMasters BK, Singel D, et al. Fast multislice mapping of the myelin water fraction using multicompartment analysis of T2* decay at 3T: a preliminary postmortem study. Magn Reson Med 2007;58(5):865–70. [DOI] [PubMed] [Google Scholar]
- [5].Alonso-Ortiz E, Levesque IR, Pike GB. Multi-gradient-echo myelin water fraction imaging: Comparison to the multi-echo-spin-echo technique. Magn Reson Med 2018. March;79(3):1439–1446. [DOI] [PubMed] [Google Scholar]
- [6].Ababneh Z, Beloeil H, Berde CB, Gambarota G, Maier SE, Mulkern RV. Biexponential parameterization of diffusion and T2 relaxation decay curves in a rat muscle edema model: Decay curve components and water compartments. Magn Reson Med 2005;54(3):524–531. [DOI] [PubMed] [Google Scholar]
- [7].Fan RH, Does MD. Compartmental relaxation and diffusion tensor imaging measurements in vivo in λ-carrageenan-induced edema in rat skeletal muscle. NMR Biomed 2008;21(6):566–573. [DOI] [PMC free article] [PubMed] [Google Scholar]
- [8].Yuan J, Zhao F, Chan Q, Wang YXJ. Observation of bi-exponential T1ρ relaxation of in-vivo rat muscles at 3T. Acta Radiologica 2012;53(6):675–681. [DOI] [PubMed] [Google Scholar]
- [9].Siracusano G, La Corte A, Milazzo C, Anastasi GP, Finocchio G, Gaeta M. On the R2 relaxometry in complex multi-peak multi-Echo chemical shift-based water-fat quantification: Applications to the neuromuscular diseases. Magn Reson Imaging 2017;35:4–14. [DOI] [PubMed] [Google Scholar]
- [10].Zheng S, Xia Y. On the measurement of multi-component T2 relaxation in cartilage by MR spectroscopy and imaging. Magn Reson Imaging 2010;28(4):537–545. [DOI] [PMC free article] [PubMed] [Google Scholar]
- [11].Reiter DA, Roque RA, Lin PC, Irrechukwu O, Doty S, Longo DL, et al. Mapping proteoglycan-bound water in cartilage: improved specificity of matrix assessment using multiexponential transverse relaxation analysis. Magn Reson Med 2011;65(2):377–384. [DOI] [PMC free article] [PubMed] [Google Scholar]
- [12].Dortch RD, Yankeelov TE, Yue Z, Quarles CC, Gore JC, Does MD. Evidence of multiexponential T2 in rat glioblastoma. NMR Biomed 2009. July;22(6):609–618. [DOI] [PMC free article] [PubMed] [Google Scholar]
- [13].Laule C, Bjarnason TA, Vavasour IM, Traboulsee AL, Moore GW, Li DK, et al. Characterization of brain tumours with spin-spin relaxation: pilot case study reveals unique T2 distribution profiles of glioblastoma, oligodendroglioma and meningioma. J Neurol 2017;264(11):2205–2214. [DOI] [PubMed] [Google Scholar]
- [14].Gochberg DF, Gore JC. Quantitative magnetization transfer imaging via selective inversion recovery with short repetition times. Magn Reson Med 2007;57(2):437–41. [DOI] [PMC free article] [PubMed] [Google Scholar]
- [15].Istratov AA, Vyvenko OF. Exponential analysis in physical phenomena. Rev Sci Instrum 1999;70(2):1233–1257. [Google Scholar]
- [16].Graham SJ, Stanchev PL, Bronskill MJ. Criteria for analysis of multicomponent tissue T2 relaxation data. Magn Reson Med 1996;35(3):370–378. [DOI] [PubMed] [Google Scholar]
- [17].Fenrich FR, Beaulieu C, Allen PS. Relaxation times and microstructures. NMR Biomed 2001;14(2):133–9. [DOI] [PubMed] [Google Scholar]
- [18].Jones CK, Whittall KP, Mackay AL. Robust myelin water quantification: averaging vs. spatial filtering. Magn Reson Med 2003;50(1):206–209. [DOI] [PubMed] [Google Scholar]
- [19].Kwon Oh In, Woo Eung Je, Du Yiping P, Hwang Dosik. A tissue-relaxation-dependent neighboring method for robust mapping of the myelin water fraction. Neuroimage 2010;74:12–21. [DOI] [PubMed] [Google Scholar]
- [20].Raj A, Pandya S, Shen X, LoCastro E, Nguyen TD, Gauthier SA. Multi-Compartment T2 Relaxometry Using a Spatially Constrained Multi-Gaussian Model. Plos One 2014;9(6):e98391. [DOI] [PMC free article] [PubMed] [Google Scholar]
- [21].Bonny JM, Boespflug-Tanguly O, Zanca M, Renou JP. Multi-exponential analysis of magnitude MR images using a quantitative multispectral edge-preserving filter. J Magn Reson 2003;161(1):25–34. [DOI] [PubMed] [Google Scholar]
- [22].Guo J, Ji Q, Reddick WE. Multi-slice myelin water imaging for practical clinical applications at 3.0 T. Magnetic resonance in medicine 2013;70(3):813–822. [DOI] [PMC free article] [PubMed] [Google Scholar]
- [23].Bydder M, Du J. Noise reduction in multiple-echo data sets using singular value decomposition. Magn Reson Imaging 2006;24(7):849–856. [DOI] [PubMed] [Google Scholar]
- [24].Huang C, Graff CG, Clarkson EW, Bilgin A, Altbach MI. T2 mapping from highly undersampled data by reconstruction of principal component coefficient maps using compressed sensing. Magn Reson Med 2011;67(5):1355–1366. [DOI] [PMC free article] [PubMed] [Google Scholar]
- [25].Zhao B, Lu W, Hitchens TK, Lam F, Ho C, Liang ZP. Accelerated MR parameter mapping with low-rank and sparsity constraints. Magn Reson Med 2015. August;74(2):489–498. [DOI] [PMC free article] [PubMed] [Google Scholar]
- [26].Zhang T, Pauly JM, Levesque IR. Accelerating parameter mapping with a locally low rank constraint. Magn Reson Med 2015;73(2):655–661. [DOI] [PMC free article] [PubMed] [Google Scholar]
- [27].Nguyen HM, Peng X, Do MN, Liang ZP. Denoising MR spectroscopic imaging data with low-rank approximations. IEEE T Bio-med Eng 2013. January;60(1):78–89. [DOI] [PMC free article] [PubMed] [Google Scholar]
- [28].Lugauer F, Nickel D, Wetzl J, Kannengiesser SAR, Maier A, Hornegger J. Robust Spectral Denoising for Water-Fat Separation in Magnetic Resonance Imaging In: Medical Image Computing and Computer-Assisted Intervention - MICCAI 2015 Cham: Springer, Cham; 2015. p. 667–674. [Google Scholar]
- [29].Allen BC, Lugauer F, Nickel D, Bhaffi L, Dafalla RA, Dale BM, et al. Effect of a Low-Rank Denoising Algorithm on Quantitative Magnetic Resonance Imaging-Based Measures of Liver Fat and Iron. J Comput Assist Tomo 2017. May;41(3):412–416. [DOI] [PubMed] [Google Scholar]
- [30].Manjôn JV, Coupé P, Concha L, Buades A, Collins DL, Robles M. Diffusion weighted image denoising using overcomplete local PCA. Plos One 2013;8(9):e73021. [DOI] [PMC free article] [PubMed] [Google Scholar]
- [31].Manjôn JV, Coupé P, Buades A. MRI noise estimation and denoising using non-local PCA. Med Image Anal 2015;22(1):35–47. [DOI] [PubMed] [Google Scholar]
- [32].Veraart J, Novikov DS, Christiaens D, Ades-aron B, Sijbers J, Fieremans E. Denoising of diffusion MRI using random matrix theory. Neuroimage 2016;142:394–406. [DOI] [PMC free article] [PubMed] [Google Scholar]
- [33].Hennig J Multiecho imaging sequences with low refocusing flip angles. J Magn Reson 1988;78(3):397–407. [Google Scholar]
- [34].West KL, Kelm ND, Carson RP, Gochberg DF, Ess KC, Does MD. Myelin volume fraction imaging with MRI. Neuroimage 2016;. [DOI] [PMC free article] [PubMed] [Google Scholar]
- [35].Marčenko VA, Pastur LA. Distribution of eigenvalues for some sets of random matrices. Mathematics of the USSR-Sbornik 1967;1(4):457. [Google Scholar]
- [36].Prasloski T, Mädler B, Xiang QS, MacKay A, Jones C. Applications of stimulated echo correction to multicomponent T2 analysis. Magn Reson Med 2012;67(6):1803–1814. [DOI] [PubMed] [Google Scholar]
- [37].Li K, Zu Z, jJunzhong X, Janve VA, Gore JC, Does MD, et al. Optimized inversion recovery sequences for quantitative T1 and magnetization transfer imaging. Magn Reson Med 2010. August;64(2):491–500. [DOI] [PMC free article] [PubMed] [Google Scholar]
- [38].Golub GH, Van Loan CF. Matrix Computations. Third ed., p. 261 Johns Hopkins Studies in the Mathematical Sciences, Johns Hopkins University Press; 1996. [Google Scholar]
- [39].Venkataramanan L, Song YQ, Htirlimann MD. Solving Fredholm integrals of the first kind with tensor product structure in 2 and 2.5 dimensions. IEEET Signal Proces 2002;50(5):1017–1026. [Google Scholar]
- [40].Sumpf TJ, Petrovic A, Uecker M, Knoll F, Frahm J. FastT2 mapping with improved accuracy using undersampled spinecho MRI and model-based reconstructions with a generating function. IEEE T Med Imaging 2014;33(12):2213–2222. [DOI] [PMC free article] [PubMed] [Google Scholar]
- [41].Lankford CL, Dortch RD, Does MD. Fast T2 mapping with multiple echo, caesar cipher acquisition and model-based reconstruction. Magn Reson Med 2015;73(3):1065–1074. [DOI] [PMC free article] [PubMed] [Google Scholar]
Associated Data
This section collects any data citations, data availability statements, or supplementary materials included in this article.
Supplementary Materials
Fig S1 Example simulated images from the scenario with NE = 40, TE = 8 ms, σT2l = 5 ms, and SNR = 200. The top row shows original noisy images. The second and third rows show the magnitude denoised images and the difference images, respectively. At each different echo time, the original and denoised images are all displayed using the same grayscale, and all three differences images are scaled to ±3σ.
Fig S2 Scatter plots of estimate short T2 signal fraction, , vs the ground truth, fs, for the example scenario of NE = 40, TE = 8 ms, and σT2l = 5 ms.
Fig S3 Scatter plots of estimate long T2, , vs the ground truth, T2l, for the example scenario of NE = 40, TE = 8 ms, and σT2l= 5 ms.
Fig S4 Measure of the relative decrease in parameter RMSE due to denoising, as a function of σT2l (left), NE (right), and image SNR (color). For all frames, the vertical axis is Γ(p) ≜ RMSEo (p) /RMSEd (p), where subscripts ‘o’ and ‘d’ indicate ‘original’ and ‘denoised’, respectively, and ‘p’ is the fitted parameter of interest.
Fig S5 RMSE values of and computed from original and denoised images, for simulations using θ = 155° and image SNR values 50 to 1600.
Fig S6 Relative increase in mouse brain image SNR after denoising, as a function of echo time (MSE, top) or inversion time (IR, bottom) and NA (color). Note that NA ranges 4 to 256 for MSE and 1 to 64 for IR.
Fig S7 Example and parameter maps from three different mouse brains. Parameter intensities vary some between brains/slice location, but the improvement in parameter map quality due to denoising is qualitatively similar in all cases.
Fig S8 A comparison of maps from original, complex denoised, and magnitude denoised images. Except at low image SNR, the effect of complex and magnitude denoising on maps was similar.
Fig S9 A comparison of maps from original, complex denoised, and magnitude denoised images. Except at low image SNR, the effect of complex and magnitude denoising on maps was similar.
Fig S10 A comparison of maps from original and magnitude denoised images acquired with an 8-channel receive coil on a Philips 3.0T scanner. The PCA denoising was done by retaining a fixed P = 4 principal components, rather than using the MP algorithm.


