Abstract
Background:
Imaging the lower extremity reproducibly and accurately remains an elusive goal. This is particularly true in the high risk diabetic foot, where tissue loss, edema, and color changes are often concomitant. The purpose of this study was to evaluate the reproducibility of a novel and inexpensive stereotaxic frame in assessment of wound healing.
Methods:
The main idea is to keep constant and reproducible the relative position of extremities related to the sensor used for the examination during a serial studies by stereotaxic digital photographic sequence. Ten healthy volunteers were evaluated at 10 different time moments to estimate the foot position variations in the stereotaxic frame. The evolution of 40 of DFU patients under treatment was evaluated before and during the epidemical grow factor intralesional treatment.
Results:
The wound closing and granulation speeds, the relative contribution of the contraction and tissue restauration mechanism were evaluated by stereotaxic digital photography.
Conclusions:
The results of this study suggest that the stereotaxic frame is a robust platform for serial study of the evolution of wound healing which allow to obtain consistent information from a variety of visible and hyperspectral measurement technologies. New stereotaxic digital photography evidences related to the diabetic foot ulcer healing process under treatment has been presented.
Keywords: diabetic foot ulcer, quantitative evolution, serial studies, imaging
Imaging the lower extremity reproducibly and accurately remains an elusive goal. This is particularly true in the high risk diabetic foot, where tissue loss, edema, and color changes are often concomitant.1,2
Recent works2 have described an intent to solve the problem of recording the diabetic foot ulcers (DFU) by serial photographic methods. However these technologies have encountered limitations. (1) Some recent technologies may come into contact with the ulcer, and (2) this contact can introduce an ulcer form distortions. Finally, (3) the geometry of the measurement may only accurately evaluate plantar DFUs.
In serial and transverse assessments one of the most important problems in the extremities is the reproducibility of the relative position between observed zone and the sensor device. Our group have developed a stereotaxic frame (SF) to better assist in reproducibility.2 We are unaware of any reports in the literature that describe its use. Therefore, the purpose of this study was to evaluate the reproducibility of an SF in assessment of wound healing.
Methods
Study Subjects
Written informed consent was obtained from all 10 healthy volunteers (without diabetes) and from 40 people with DFU. This cohort included lesions classified as grades I to IV by the Wagner scale.3 The patients were treated and evaluated in three different medical institutions specialized in DFU: INACV, Camilo Cienfuegos Provincial Santis Spiritus Hospital and Sierra Maestra Policlinic.
Stereotaxic Frame Description
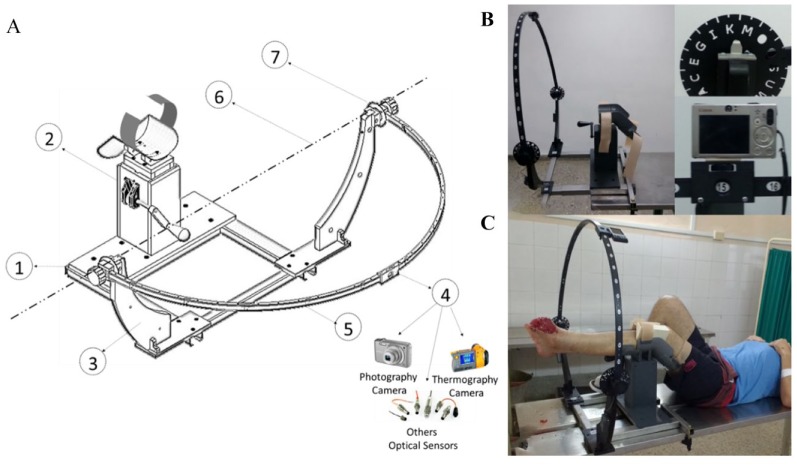
The SF is a medical device used for the reproducible measurement of the extremity. The goal is to provide constant and reproducible registration of the relative position of extremities related to the sensor used for the examination during serial and transverse studies. The sensor can be any variety of devices including but not limited to multi sensor digital photographic cameras, thermographic sensors, noncontact flow oximeter, and so on. The frame is illustrated in Figure 1.
Figure 1.
Stereotaxic frame views. (A) An isometric view schema. (B) A real photographic lateral view. (C) A general photographic view with the patient in the examination position. In Figure A, (1) is the base, (2) is the tower to fit the leg position, (3) is the tower were is collocated the measurement instrument or sensor. The measurement instrument can be move around the arc (5) or the axes (6).
Measurement Procedure and Statistical Analysis
Potential measurement errors can be classified into two groups: (1) those associated with the reproducibility of the foot or leg position in the SF; (2) errors associated with the evaluation of the different zones of the lesion by the expert which introduce a subjective appreciation.
To assess weekly wound size/planimetry we used Image J.4 We used three independent clinician validators to confirm wound size and healing.
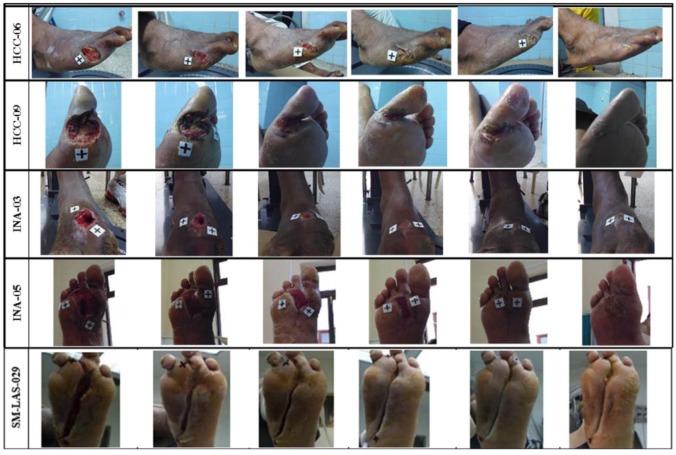
The reported value is the mean reported by the experts. These serial measurements are further illustrated in Figure 2.
Figure 2.
As example five photographic sequences as time function. The cross is an external marker in order to makes the pixel-dimension calibration. The first columns of photographs at the left correspond to lesion before the treatment. INA, HCC, and SMLAS are patients corresponding to Camilo Cienfuegos Provincial Santis Spiritus Hospital and Sierra Maestra Policlinic, respectively.
For all analyses, we used Matlab 7x. Software (MathWorks, Natick, MA, USA). We employed an ANOVA test for normally distributed data of homogeneous variance to assess differences between healthy people and people with DFU. For all measures, we used an alpha (P value) of 5%.
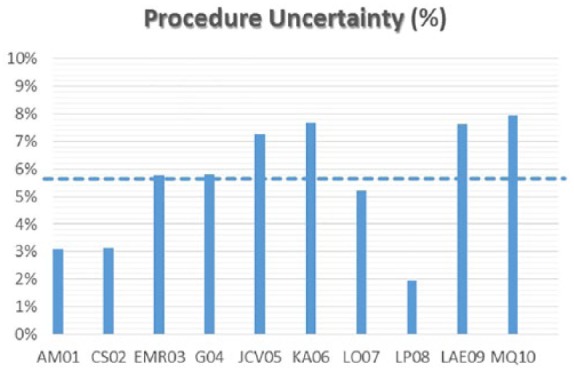
Ten healthy volunteers were evaluated at 10 different time moments to evaluate the foot position variations in the SF. Diverse external markers with irregular and well known areas are collocated in various places of the volunteer’s foot to make a comparison between the real area, of the external marker, and the area obtained by photography in different evaluation moments.
Likewise, the measured areas of the real wound at the time t are normalized to the initial area before the treatment in order to decrease the influence of the errors in the results. Additionally, the normalization process allows the appraisal between different patients under the same treatment.
Results
Table 1 reports the mean variation of area measurements of external markers of 10 healthy volunteers at different time points. The maximum mean ratio difference of the areas between the markers from one measurement to another was less than 10% in all cases. Any change larger than 10% can therefore be assumed to represent the result of a physiological or pathological event.
Table 1.
Means Variations of the Area Measurement of 10 Healthy Volunteers in Different Time Points.
| Voluntaries | Error (%) | |
|---|---|---|
| AM01 | 3.10 |
|
| CS02 | 3.12 | |
| EMR03 | 5.76 | |
| G04 | 5.79 | |
| JCV05 | 7.25 | |
| KA06 | 7.68 | |
| LO07 | 5.21 | |
| LP08 | 1.94 | |
| LAE09 | 7.64 | |
| MQ10 | 7.96 |
The stereotactic digital photographic sequence of the evolution of some of DFU patients under treatment is presented in Figure 2. The first columns of photographs at the left, correspond to wounds before treatment.
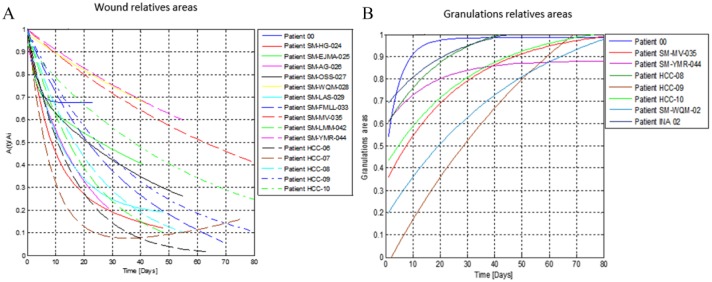
Figure 3A illustrates the diminishing area of the wound as a function of the treatment time. Figure 3B reports granulation tissue formation. Similarly, Figure 4 highlights two curves in an individual patient and its ability to also record wound contracture synchronized with epidermal growth factor (EGF) administration.5
Figure 3.
Normalized kinetics curve wound (A) and granulation (B) areas in depends time of the treatment for some of the patients.
Figure 4.
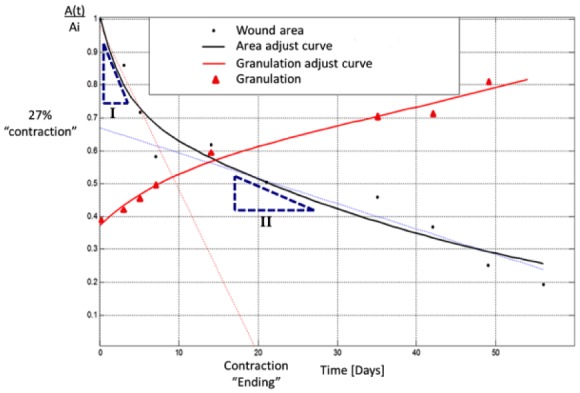
Kinetic curve analysis of a typical case. The curve in black is the lesion area changing as function of the treatment time. Similarly the red curves represent the growing granulation area as consequence of the EGF treatment. The most important obtained information is the slope of these curve which represent the rate of change of the lesion closing process and the increasing the extent of the new tissue.
Table 2 presents the speed of the contraction and granulation process calculated at the wound area and perimeter variation in relative units during the treatment time for some of the patients included in the study.
Table 2.
Speed of Contraction and Wound Granulation Calculated at the Wound Area and Perimeter Variation, In Relative Units, During the Treatment Time.
| Speed variation of the areas and perimeter of the DFU | |||||||
|---|---|---|---|---|---|---|---|
| Patient ID | Zone | Initial area (Ai) [cm2] | DFU area normalized [(A(t)/Ai)*100/day] |
Initial perimeter a[cm] | DFU perimeter normalized [(P(t)/Pi)*100/day] |
||
| Slope I | Slope II | Slope I | Slope II | ||||
| INA-03 | Dorsal | 8.1 | −3.9 | −0.4 | 12.8 | −2.4 | −0.7 |
| SM-LMM-042 | Frontal | 1.4 | −3.0 | −2.0 | 6.0 | −2.0 | −3.0 |
| HCC-09 | Lateral | 11.9 | −8.0 | −0.8 | 21.5 | — | −1.0 |
| HCC-06 | Lateral | 5.6 | −5.0 | −0.3 | 9.1 | −3.0 | −0.6 |
| INA-10 | Lateral | 1.3 | — | −1.9 | 5.5 | — | −2.0 |
| INA-05 | Plantar | 23.2 | −3.0 | −0.8 | 23.6 | — | −1.5 |
| INA-13 | Plantar | 8.5 | −2.4 | −0.2 | 13.6 | — | −0.8 |
| SM-HG-024 | Calcaneus | 1.9 | −6.0 | −0.5 | 5.7 | −2.0 | −0.5 |
| SM-EJMA-025 | Dorsal | 47.7 | −6.0 | −0.7 | 28.3 | −5.0 | −0.3 |
| INA-04 | Dorsal | 2.2 | −9.1 | −1.0 | 7.2 | −4.3 | −1.2 |
| HCC-08 | Frontal | 3.4 | −3.0 | −0.7 | 7.6 | −0.3 | −3.0 |
| SM-FMLL-033 | Frontal | 5.5 | −2.0 | −0.7 | 10.0 | −1.0 | −0.7 |
| SM-MV-035 | Frontal | 38.2 | — | −0.7 | 24.1 | −0.3 | −2.0 |
| INA-12 | Frontal | 24.6 | — | −1.3 | 18.6 | — | −0.7 |
| SM-OSS-027 | Lateral | 46.3 | −5.0 | −1.0 | 27.6 | −8.0 | −1.0 |
| HCC-07 | Plantar | 8.0 | −8.0 | −0.2 | 11.8 | −5.0 | 0.3 |
| SM-AG-026 | Plantar | 18.0 | — | −3.0 | 27.4 | — | −2.0 |
| SM-LAS-029 | Plantar | 14.3 | −5.0 | −0.4 | 29.1 | — | −0.3 |
| INA-02 | Plantar | 6.3 | −5.2 | −0.6 | 12.8 | 10.8 | −0.9 |
In Table 3 reports rate of closure obtained by magnetic resonance imaging (MRI)1 and by stereotaxic digital photography. The patients and the number of cases in both studies were different. Nonetheless, they had an exactly equal treatment scheme.
Table 3.
Comparison of the Means for Speed of the Wound Volume and Area Variation Determined by MRI and by SF in Relative Units.
| Speed changes | Speed volume changes (IRM), volume/day in RU | Speed area changes (stereotaxic frame), area/day in RU |
|---|---|---|
| Max | −0.02 | −0.08 |
| Min | −0.01 | −0.01 |
| Mean | −0.02 | −0.05 |
Discussion
In most of the cases, the lesion area change can be represented by two exponents curves one fast and other one more slowly (Figures 3 and 4). The two curves slope corresponding to these two exponents represents the rate of changes of the area variation. In other words, the slopes magnitudes are the speed of closing process. In all the cases the first slope, rate of changes, is bigger than the second.
Otherwise, for patients included in this study the variation curves of granulation area are adjusted to only one exponent (Figure 4). The exponent of the granulation curve (in red) is almost exactly the inverse of the second exponent of the closed curve (in black).
We believe that this device has the potential to measure both wound contracture (surface area) and granulation tissue formation.6-8 Both play a central role in wound healing. This allows us to personalize our measurement. For example, in Figure 4 the relative contribution toward wound closure is 27% by contraction and 73% due to granulation. On the other hand the intersection of the rapid slope curve with the Abscissa axis can be interpreted as the moment when contraction becomes negligible.7,8
The comparisons between the lesions closing speed obtained by MRI1 and by stereotaxic digital photographic presented in Table 3 shows that in both cases, the wound dimension speed changes behavior and the mean rate of changes during the treatment time are similar. Moreover, as it explained in1 the MRI lesion closing speed was determinate by the changes of the lesion volume. Likewise, increasing the experimental data obtained by SF and MRI will make possible more robust wound healing modeling.
At the moment some improvements to stereotectic measurement are being introduced in order to continue to reduce variability. Additionally, we are testing its use to include other imaging such as 3D photography, temperature, oxygenation and vascularization, coherent optical tomography. As well it is necessary to increase the number of patients in order to obtain more regularities associated with the wound heling process. At the moment they are going others studies which include others injuries no related to diabetes.
The results of this study suggest that SF is a robust platform for serial study of the evolution of wound healing which allow to obtain consistent information from a variety of optical and measurement technologies.
Conclusion
Rate of granulation tissue and wound closure along with the relative contribution of the contraction and tissue restauration mechanism, the infection and necrosis areas and its temporal variation can be determined by stereotaxic digital photography.
The developed platform and these studies permit a better understanding of the wound healing process and also suggest the potential use a new evaluation tool to better and more consistently measure what we manage.9, 10,11 We look forward to further works that will confirm or refute these data.
Acknowledgments
The authors express gratitude to the patients, volunteers, and coworkers related to these studies. The present study was reviewed and approved by the Ethics Committee of the Cuban National Institute of Angiology and Vascular Surgery in Havana per the ethical principles of the World Medical Association (Declaration of Helsinki). Written informed consent was obtained from all healthy volunteers (without diabetes) and from all people with DFU included in the study. The datasets used and analyzed during the current study are available from the corresponding or the first authors on reasonable request.
Footnotes
Abbreviations: CIGB, Centro de Ingeniería Genética y Biotecnología; DFU, diabetic foot ulcers; EGF, epidermal growth factor; INACV, Instituto de Angiología y Cirugía Vascular; MRI, magnetic resonance imaging; SF, stereotaxic frame.
Declaration of Conflicting Interests: The author(s) declared no potential conflicts of interest with respect to the research, authorship, and/or publication of this article.
Funding: The author(s) disclosed receipt of the following financial support for the research, authorship, and/or publication of this article: All economic and logistical support was from the Genetic Engineering and Biotechnology Center.
ORCID iDs: Leonardo Oramas Díaz  https://orcid.org/0000-0003-2829-2212
Evelio González Dalmau  https://orcid.org/0000-0003-4569-2103
References
- 1. Cabal-Mirabal C, González Dalmau E, Berlanga Acosta J. et al. Quantitative studies of the evolution of diabetic foot lesions under EGF treatment by magnetic resonance imaging. J Radiol Res Pract. 2014;2014:783980. [Google Scholar]
- 2. Wang L, Pedersen PC, Strong DM. et al. An automatic assessment system of diabetic foot ulcers based on wound area determination, color segmentation, and healing score evaluation. J Diabetes Sci Technol. 2015;10:421-428. [DOI] [PMC free article] [PubMed] [Google Scholar]
- 3. Frykberg RG, Zgonis T, Armstrong DG. et al. Diabetic foot disorders: a clinical practice guideline. American College of Foot and Ankle Surgeons. J Foot Ankle Surg. 2006;45:S1-S66. [DOI] [PubMed] [Google Scholar]
- 4. Official Site of Image J Software. https://imagej.nih.gov/ij/.
- 5. Acosta JB, Savigne W, Valdez C. et al. Epidermal growth factor intralesional infiltrations can prevent amputation in patients with advanced diabetic foot wounds. Int Wound J. 2006;3:232-239. [DOI] [PMC free article] [PubMed] [Google Scholar]
- 6. Levinson HA. A paradigm of fibroblast activation and dermal wound contraction to guide the development of therapies for chronic wounds and pathologic scars. Adv Wound Care. 2017;2:149-159. [DOI] [PMC free article] [PubMed] [Google Scholar]
- 7. Wong VW, Akaishi S, Longaker MT, Gurtner GC. Pushing back: wound mechanotransduction in repair and regeneration. J Invest Dermatol, 2011;131:2186-2196. [DOI] [PubMed] [Google Scholar]
- 8. Murphy KE, Hall CL, Maini PK, McCue SW, McElwain DL. A fibrocontractive mechanochemical model of dermal wound closure incorporating realistic growth factor kinetics. Bull Math Biol. 2012;74:1143-1170. [DOI] [PubMed] [Google Scholar]
- 9. Armstrong DG, Boulton AJM, Bus SA. Diabetic Foot Ulcers and Their Recurrence. N Engl J Med. 2017;376:2367-2375. doi: 10.1056/NEJMra1615439. [DOI] [PubMed] [Google Scholar]
- 10. Armstrong DG, Lew EJ, Hurwitz B, Wild T. The quest for tissue repair’s holy grail: The promise of wound diagnostics or just another fishing expedition? Wound Medicine. 2015;8:1-5. doi: 10.1016/j.wndm.2015.03.010. [DOI] [Google Scholar]
- 11. Wrobel JS, Armstrong DG. Reliability and validity of current physical examination techniques of the foot and ankle. J Am Podiatr Med Assoc. 2008;98:197-206. [DOI] [PubMed] [Google Scholar]


