

Abstract
Background:
Deviations in glucose control in critical care have been shown to increase mortality and morbidity. However, optimal glucose control through present technologies has shown to be a challenge. The insulin balanced infusion system (IBIS) is a new and emerging technology.
Methods:
The closed loop system was tested in a stress trial to evaluate glucose stability in response to various conditions in nonrandomized people with type 1 diabetes mellitus (n=12). The prototype used in this trial was based on intermittent capillary measurements.
Results:
Induced stresses in the study using unpredicted stimuli of intravenous or oral glucose and intravenous insulin boluses, was contained with glucose remaining in target 43.8% of the time. Mean increase in glucose concentration after glucose load was 17.4 mg/dl; after insulin bolus, no hypoglycemia (blood glucose less than 70 mg/dl) occurred.
Conclusion:
The use of IBIS proved safe and feasible under a wide range of conditions. The sensing and stress response of the IBIS demonstrated noticeable features.
Keywords: automated glucose monitoring, closed loop glucose control, critical care glucose control, stress trial
People with diabetes mellitus (DM) undergoing cardiovascular surgery have shown increased perioperative morbidity and mortality, and reduced long-term survival.1-4 After cardiac surgery, the majority of patients are sent to intensive care units (ICU).5 In the ICU deviations in glycemic control can lead to an increase in hospital morbidity and mortality.5,6
In general insulin-based treatments are acknowledged to decrease both morbidity and mortality, but the greater control also increases the risk of hypoglycemia, which imposes a hazard to the patients.7,8
It has been demonstrated that continuous glucose monitoring (CGM) may be useful in lowering hypoglycemic incidents and increasing safety procedures.9 The CGM devices have in particular shown great sensitivity in the detection of swift glucose excursions.10 However, subcutaneous sensors sample interstitial fluid instead of blood glucose, and results in a lag in glucose measurements between blood glucose and interstitial fluid glucose samples.11 Furthermore, poor tissue perfusion also plays a role in creating error with the interstitial glucose sensors.12-14 To avoid these adverse effects, it is more preferable to use intravascular sensors and alternatively sensors that can that withdraw blood automatically through an indwelling catheter.12 Sensors of this type are capable of sampling every 5-15 minutes, which is ideal to visualize satisfying glucose curve and to prevent excursions.12,15,16
Furthermore, to treat hyperglycemia and prevent hypoglycemia using a CGM device, a system is needed which can quickly change insulin released in response to quick changes in blood glucose levels.12 In addition, it should be able to rapidly change the insulin release to zero during hypoglycemic states.12
The insulin-based infusion system (IBIS) samples the blood and measures blood glucose levels via an intravenous catheter. Depending on the blood glucose levels, the IBIS delivers treatment with glucose, insulin or both simultaneously.
The aim of this study is to investigate the safety and performance of the IBIS under unstable glycemic conditions, which may resemble tendencies in critically ill patients, and determine if real-time blood glucose sensing every 10-20 minutes is adequate for a closed loop system.
The study aims to assess the safety of the IBIS, specifically the avoidance of hypoglycemia, and recovery from unstable conditions and restoration of normoglycemia and target range (80-125 mg/dl) in such circumstances.
Methods
All data was provided by Admetsys: Advanced Metabolic Systems™.
Study Sample
The study was approved by the US Food and Drug Administration (FDA) under an Investigational Device Exemption (IDE) and was approved by an independent Institutional Review Board (IRB). Twelve people on treatment for diabetes mellitus type 1 (T1DM), but otherwise healthy, were admitted nonrandomized to a research unit were the study took place. Inclusion criteria were (1) male or female with no pregnancy; (2) age > 21; (3) known people with DM type 1; (4) blood glucose 150-350 mg/dl at time of initiation; (5) nil per os (NPO) at time of study initiation; (6) stable blood pressure and cardiac rhythm; and (7) adequate intravenous access. Exclusion criteria were (1) unwillingness to participate or dementia; (2) use of thiazolidinediones (TZD) or GLP-1 receptor agonists; (3) HbA1c >10%; (4) (a) serum creatinine >1.5 mg/dl, (b) serum potassium <3.5 mEq/l, (c) hematocrit <30% or >55%, (d) ALT/AST >3xnormal; (5) (a) anticoagulation therapy (other than aspirin), (b) corticosteroid use in previous 30 days, (c) supplemental oxygen pO2 <80 or >100 mmHg; (6) diabetic ketoacidosis in previous year; (7) history of seizures; (8) history of or symptomatic cardiac, peripheral, or cerebral vascular disease; (9) drug or alcohol dependency; (10) inclusion in a separate clinical trial. This population was intended to allow total glucose control by the investigatory system without the individual’s standard regimen interfering.
Upon entering the trial, the subjects’ usual insulin pumps were turned off so that glucose control was totally dependent on the IBIS. The subjects were required to have glucose levels of 150-350 mg/dl at the commencement of the trial.
All subjects were given oral and written information and entered the studies after giving informed and written consent according to the Helsinki II declaration and to local ethical guidelines. The studies were performed at the Admetsys Clinical Research Center in Orlando Florida.
Procedures
The study duration was 9.3-16.9 hours.
The protocol was designed to apply metabolic stress and intentional destabilizing stimuli to the subjects.
The stimuli were:
a. Carbohydrate loading: a high-carbohydrate meal given orally, without any compensating insulin.
The carbohydrate size of the meal was 60-120 g, calculated by body weight at a minimum of 1.0 g/kg.
b. Continuous glucose infusion: A glucose infusion, besides that of the treatment system, was given to elevate the blood glucose and was later abruptly discontinued creating two separate and opposite stimuli.
The rate of the glucose infusion was 8-12 g/hr based on body weight for a period of two hours.
c. Insulin bolus: A clinically significant bolus of insulin was introduced intravenously to result in a sudden drop of blood glucose.
The amount of insulin was calculated by body weight at 0.015 unit/kg.
At commencement, the uncontrolled glucose levels of the subjects were stabilized in the target range by the IBIS, and afterward the above-mentioned stress stimuli were applied in succession, with an interposing period to observe the IBIS response.
The timing and order of the stimuli varied in every trial to ensure unpredictability for the IBIS.
A Bayer Contour glucose strip meter (Bayer Contour meter, Ascensia Healthcare, Parsippany NJ) was electronically connected to the system controller by USB cable. When new measurements were received, the IBIS autonomously calculated the glucose and insulin dosage and changed the delivery rates of the pump to match the requirements. The only input required was the subjects’ weight. A nurse applied blood to glucose test strips, and besides this, no manual interaction with the treatment system was permitted or required. Capillary glucoses were performed every 10-16 minutes with a mean of 13.7 minutes. This data allowed real-time adjustment of the insulin and/or dextrose infusions.
Through a 23 gauge peripheral catheter the study treatment was infused. Vein patency was insured with a saline solution which was infused at 30 ml/hr. Regular human insulin at 1 unit/ml in normal saline and 50% dextrose (D50) in water, were separately infused by IBIS insulin and glucose pumps, when required, through 50 ml syringes. Simultaneous infusion of normal saline at 30 ml/hr was infused for dilution to prevent any irritation from D50. Using a 3-way connector treatment channels were connected to the intravenous saline infusion. To verify input data quality, confirmatory capillary glucose measurements were taken using a separate technology (HemoCue Glucose 201 Analyzer, Brea, CA) at minimum every two hours, and whenever glucose levels were below 80 mg/dl or over 250 mg/dl. Primary and confirmatory values were required to agree within 10% of one another or measurements were retaken.
Insulin Balanced Infusion System (IBIS)
The IBIS consists of three components: a glucose-sensing device (Bayer Contour meter, Ascensia Healthcare, Parsippany, NJ), two syringe pumps (AS 50, Baxter Healthcare, Round Lake, IL), and the system controller developed by Admetsys (Admetsys, Boston, MA). This study uses a development prototype of the system where the pumps are electronically connected to the system controller, but physically separate.
An evolving model of the subjects’ metabolism is generated and is used to determine the real-time therapeutic requirements to control the glucose levels of the patient. When the subjects’ requirements change the system adapts and modifies to the optimal therapy. The core of the system is a proprietary controller developed by Admetsys. It uses a 3D proprietary AI algorithm, which also suggests the frequency of blood sampling during the studies.
Depending on the blood glucose levels, the IBIS delivers glucose, insulin or both to the patient. The system can interoperate with many glucose sensor types. The presented research employs leveraging more moderate frequency data, sourced from an enzymatic strip based meter, electronically cabled to the controller. This interim sensor configuration is not for practical hospital use and is intended as a demonstration of concept using presently sensing techniques.
Analysis of Results
An aggregate analysis across the entire study population by segmentation of the frames of reference was made and demarcated by the transitions of the three treatment stages:
Stress: application of intentional destabilizing stimuli
Normalization: restoration of blood glucose in the target range (80-125 mg/dl), held for at least an hour
Stability: continued maintenance of glucose levels, postnormalization and prior to application of subsequent destabilizing stimuli
Analysis of stress response is examined individually, and further divided by stimulus type.
Descriptive statistics for blood glucose level and time are presented with central tendencies described with mean and median. Dispersion is described with standard deviation (SD) and range (interquartile range is depicted on some charts).
Results
Twelve subjects with diabetes were separately admitted to a research unit for trial participation. A summary of the subjects included can be seen in Table 1.
Table 1.
Protocol Demographics.
| Stress protocol | |
|---|---|
| Diabetes type | 12 type 1 |
| Sex | 6 male, 6 female |
| Age | 21-57 years |
| Weight | 62-144 kg |
| A1c | 5.8-9.8% |
| Insulin | 30-120 units/day |
| Regimen | Insulin pumps |
The stress protocol included only subjects with type 1 diabetes to maximize the influence of the stimuli applied. Diabetic condition and insulin requirements varied in the protocol population.
To have subjects who were more dependent on systems for diabetic control and correspondingly more susceptible to external stimuli, only subjects with DM type 1 whose normal insulin regimen was via an insulin pump, were included.
One subject’s blood glucose fell to 99 mg/dl between admittance and start of treatment and was given food just before initiation of the study. Twelve subjects underwent the complete trial.
Summary of Results
The subjects’ glucose levels at the time of study commencement ranged from 99-344 mg/dl.
In Figure 1 the aggregate analysis for the stress trial population is seen.
Figure 1.

Aggregate analysis with repeated stabilization and extended maintenance of the stress trial population.
Where normalization was needed either at the beginning of the trial or after a destabilization event, the mean time to reach the target range (80-125 mg/dl) was 1.91 hours. After normoglycemia was established, blood glucose levels remained in the target range 97.86% of the time with a mean blood glucose of 105.2 mg/dl prior to application of a destabilizing stimulus.
Normoglycemic levels were maintained in 43.8% of all induced stimuli. No hypoglycemia (<70 mg/dl) occurred at any time. The glucose levels ranged from 126 to 230 mg/dl after destabilizing events. Figure 2 shows the regularity of distribution for normalization times across all trials.
Figure 2.
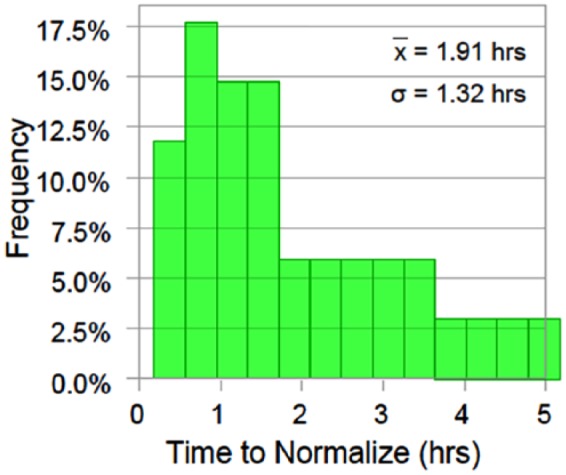
The distribution for time to normalization across all trials.
Carbohydrate Loading
Figure 3 depicts the summary statistics for the carbohydrate loading stress response and the following period.
Figure 3.

Aggregated analysis of the carbohydrate loading event. The left side of the figure shows glucose levels from the time of administration of the high-carbohydrate meal till the time of restoration of the normoglycemic target range. The right side of figure depicts the following two hours after restoration of the normoglycemic target range.
The carbohydrate load produced a rise to mean blood glucose levels of 158.2 mg/dl (SD 36.8 mg/dl), over two hours after administration of the carbohydrate load. The glucose levels peaked approximately 1.25 hours after administration of the carbohydrate load, with a mean maximum of 205.05 mg/dl.
Normoglycemic stability was restored in a mean time of 2.51 hours (SD 1.34). Once glucose levels were restored to the target range, they remained stable with a mean of 100.0 mg/dl (SD 13.3 mg/dl) over the following two hours. There was no occurrence of hypoglycemia.
Continuous Intravenous Glucose Infusion
Figure 4 shows the aggregated analysis for the intravenous glucose infusion response and the subsequent two hours.
Figure 4.

Plot of the summary statistics for the intravenous glucose infusion response. The left chart shows the glucose levels at the time of administration and the following two hours, and the right chart shows the subsequent two hours.
The left portion of Figure 4 shows the glucose levels from the time of infusion of the intravenous glucose and the following two hours. The left portion of Figure 4 shows the subsequent two hours following discontinuation.
For the two hours the infusion was given, the subjects experienced an increase in blood glucose levels of 17.4 mg/dl (SD 12.7 mg/dl). The blood glucose peaked at an average maximum of 134.0 mg/dl.
When the glucose infusion was discontinued the average glucose levels stabilized to a mean of 114.4 mg/dl (SD 9.6 mg/dl), overall returning to target range 1.3 hours after the peak, and remaining there until next stimuli was induced.
The discontinuation of glucose infusion produced an inverse stress and caused the blood glucose levels to drop a mean of 10.1 mg/dl (SD 16.3) to an average low of 94.8 mg/dl in the first hour after removal. Progressively tightened control followed and, in the second hour after removal, low dispersion control with a mean of 106.4 mg/dl (SD 13.6 mg/dl) was observed.
Target range blood glucose levels were sustained uninterrupted through 41.7% of the glucose infusion introductions and 75.0% of glucose infusion removals. No hypoglycemic events were introduced.
Intravenous Insulin Bolus
Figure 5 shows the aggregated analysis of the intravenous insulin response.
Figure 5.

The descriptive statistics summarizing intravenous insulin bolus response, from administration to the following hour.
The descriptive statistics summarizing intravenous insulin bolus response, from the administration to the following one hour.
The lowest observed blood glucose level was 77 mg/dl, and the mean drop of blood glucose levels was 8.4 mg/dl (SD 9.1 mg/dl).
Blood glucose levels remained in the target range uninterrupted in 58.3% of the subjects. No hypoglycemic events were observed.
Discussion
This study investigated the IBIS response to correction of hyperglycemia in a disciplined manner, which is necessary to suit the need of a critical care setting.
Even though the response to stimuli is individual, and therefore at first look does not allow the aggregation and summary statistics, the application of external stimuli creates individual frames of reference. Therefore, the segmenting of these frames of results permits the aggregate analysis across the study population although the timelines are not synchronized and the stresses come in different orders, which also skews the visual presentation slightly to the right, as seen in Figure 3.
As shown in Figures 1 and 2, a wide range of blood glucose values was seen due to the external stimuli and diverse glucose values at study onset. The fluctuations were progressively diminished, and the dispersion seen in this study did not alter treatment outcomes.
Destabilizing Stimuli
The destabilizing stresses did not result in hypoglycemic risk in escalating oscillations, but were subdued restoring tightness of control. The study duration of 16 hours allowed for longer periods of stability, with no deterioration in glucose control, as seen in the results. The mean time to normalize blood glucose levels was around two hours with minor corrections, due to glucose infusion and psychological stress, corrected quickly, and larger corrections, due to carbohydrate loading and uncontrolled glucose level, generally taking slightly longer to correct. Although unstable conditions simulated in this trial may be outside the best practices for the system use, critically ill patients undergoing rapid deterioration of condition may encounter them.
In most studies testing intravenous insulin systems, the patients are not able to intake intermittent meals, because of disturbances of the blood glucose values, resulting in a greater titration of insulin infused to the patients.17-19 This has resulted in a variety of coping strategies, dealing with the disturbances experienced by the insulin system, such as dosing 1 unit of rapid-acting subcutaneous analog for every 10 g of carbohydrate, or with a step-up dosing program after a carbohydrate meal.17 Furthermore, the great excursions seen during the carbohydrate loading stimulus, depicted in Figure 3, was also a result of not allowing any compensating insulin to be infused, because it was intentional to produce a large and substantial glycemic excursion. The effects of allowing the system to compensate with insulin may be underlined, with the rapid tightening of control, seen with the IBIS under the glucose infusion test, with 41.7% uninterruptedly staying in the target range even after glucose infusion stimuli, as seen in Figure 4. The system here demonstrated an ability to react to a persistent and sudden stimulus.
Furthermore, in all three destabilizing tests no mean blood glucose levels reached above 115 mg/dl after normalization. These results demonstrate the control of tightness and stability of maintenance of the IBIS.
Psychological Stress
During the study, several subjects exhibited unplanned endogenous stress reactions. Psychological and emotional stress are other types of stimuli, which can contribute to a rise in blood glucose, similar to that seen with pain.20,21 Psychological and emotional stress can affect the blood glucose by triggering stress hormones such as cortisol and epinephrine to be released, which cause raised blood glucose levels.21-24 Furthermore, the impact of stress on the blood glucose levels may depend on the individual response to emotional stress, rather than being a standard response.21,25 A study by Strandberg et al20 investigating the longitudinal relationship of emotional distress and glycemic control in people with DM type 1, showed that people with diabetic-specific emotional distress have a greater risk of suboptimal glycemic control.20 Concerning the IBIS, this could mean greater destabilizing events with the carbohydrate and glucose tests and greater negative effects of the insulin test, seen in Figures 3, 4, and 5. However, the IBIS maintained blood glucose levels with restoration and normalization capacity in all cases of destabilizing stimuli.
Clinical Implications
An automated system, as the IBIS, is convenient because of the reduced workload and expenses linked with glucose monitoring in hospital care.26 The achievement of normoglycemic levels is conventionally associated with nursing efforts in the form of measuring blood glucose frequently and adjusting insulin doses.26 Furthermore, the method of obtaining glucose values is currently by way of analyzing capillary blood, accessed through a finger prick.8 But factors such as nursing experience and local perfusion can influence the precision of blood glucose values and the units of insulin given to the patient.8 Also, some intravenous insulin protocol studies have been demonstrated to be complex and therefore mostly nurses with much experience use these protocols, under the instruction of doctors.17,27,28 These obstacles may be reduced with the use of the IBIS, requiring no human intervention, besides inserting the intravenous catheter at the beginning of the treatment, monitoring patency, and refilling syringes when needed. The most frequent adverse effect seen in relation to the placement of an intravenous catheter is infection, and it is due to factors such as placement near a venous valve, bigger catheter than the lumen of the vein, or the movement of the catheter in the vein.29-33 Nonetheless, the risk of infection by the placement of an intravenous catheter is equal to the risk of infection by means such as needles and tubes penetrating the skin under circumstances such as surgery.12 This risk can be minimized by frequently observing the place of insertion and the surrounding skin every hour.12
The basics of the IBIS have been covered in this study. However, further study is needed with more developed prototypes to establish evidence on the capabilities of the system.
Conclusion
In conclusion, the ability of the IBIS to function safely under a wide range of conditions and individual treatment requirements suggests its consideration for further study as a tool for critical care glucose management. The sensing and stress response of the IBIS demonstrated noticeable features, which could potentially decrease patient’s mortality and morbidity, but more clinical research is needed to provide full insight to the IBIS. Future studies will concentrate on the use of real-time intravenous glucose sensing to replace the capillary sensing used in the present study.
Footnotes
Authors’ Note: Any underlying research material can be accessed by emailing the corresponding author.
Abbreviations: CGM, continuous glucose monitoring; D50, 50% dextrose; DM, diabetes mellitus; FDA, US Food and Drug Administration; IBIS, insulin balanced infusion system; ICU, intensive care unit; IDE, Investigational Device Exemption; IRB, institutional review board; SD, standard deviation; TZD, thiazolidinediones.
Declaration of Conflicting Interests: The author(s) declared the following potential conflicts of interest with respect to the research, authorship, and/or publication of this article: Tim Valk is full-time employee of Admetsys.
Funding: The author(s) disclosed receipt of the following financial support for the research, authorship, and/or publication of this article: This work was funded by Admetsys: Advanced Metabolic Systems.
ORCID iD: Nasseh Hashemi  https://orcid.org/0000-0001-9775-2919
References
- 1. Lazar HL, Chipkin SR, Fitzgerald CA, Bao Y, Cabral H, Apstein CS. Tight glycemic control in diabetic coronary artery bypass graft patients improves perioperative outcomes and decreases recurrent ischemic events. Circulation. 2004;109:1497-1502. [DOI] [PubMed] [Google Scholar]
- 2. Szabo Z, Hakanson E, Svedjeholm R. Early postoperative outcome and medium-term survival in 540 diabetic and 2239 nondiabetic patients undergoing coronary artery bypass grafting. Ann Thorac Surg. 2002;74:712-719. [DOI] [PubMed] [Google Scholar]
- 3. Cohen Y, Raz I, Merin G, Mozes B. Comparison of factors associated with 30-day mortality after coronary artery bypass grafting in patients with versus without diabetes mellitus. Israeli Coronary Artery Bypass (ISCAB) Study Consortium. Am J Cardiol. 1998;81:7-11. [DOI] [PubMed] [Google Scholar]
- 4. Carson JL, Scholz PM, Chen AY, Peterson ED, Gold J, Schneider SH. Diabetes mellitus increases short-term mortality and morbidity in patients undergoing coronary artery bypass graft surgery. J Am Coll Cardiol. 2002;40:418-423. [DOI] [PubMed] [Google Scholar]
- 5. Krinsley JS. Association between hyperglycemia and increased hospital mortality in a heterogeneous population of critically ill patients. Mayo Clin Proc. 2003;78:1471-1478. [DOI] [PubMed] [Google Scholar]
- 6. Schmeltz LR, DeSantis AJ, Thiyagarajan V. et al. Reduction of surgical mortality and morbidity in diabetic patients undergoing cardiac surgery with a combined intravenous and subcutaneous insulin glucose management strategy. Diabetes Care. 2007;30:823-828. [DOI] [PubMed] [Google Scholar]
- 7. Langley J, Adams G. Insulin-based regimens decrease mortality rates in critically ill patients: a systematic review. Diabetes Metab Res Rev. 2007;23:184-192. [DOI] [PubMed] [Google Scholar]
- 8. Weiss R, Lazar I. The need for continuous blood glucose monitoring in the intensive care unit. J Diabetes Sci Technol. 2007;1:412-414. [DOI] [PMC free article] [PubMed] [Google Scholar]
- 9. Holzinger U, Warszawska J, Kitzberger R. et al. Real-time continuous glucose monitoring in critically ill patients: a prospective randomized trial. Diabetes Care. 2010;33:467-472. [DOI] [PMC free article] [PubMed] [Google Scholar]
- 10. Holzinger U, Warszawska J, Kitzberger R, Herkner H, Metnitz PG, Madl C. Impact of shock requiring norepinephrine on the accuracy and reliability of subcutaneous continuous glucose monitoring. Intensive Care Med. 2009;35:1383-1389. [DOI] [PubMed] [Google Scholar]
- 11. Steil GM, Rebrin K, Mastrototaro J, Bernaba B, Saad MF. Determination of plasma glucose during rapid glucose excursions with a subcutaneous glucose sensor. Diabetes Technol Ther. 2003;5:27-31. [DOI] [PubMed] [Google Scholar]
- 12. DeJournett L. Essential elements of the native glucoregulatory system, which, if appreciated, may help improve the function of glucose controllers in the intensive care unit setting. J Diabetes Sci Technol. 2010;4:190-198. [DOI] [PMC free article] [PubMed] [Google Scholar]
- 13. Oliver NS, Toumazou C, Cass AE, Johnston DG. Glucose sensors: a review of current and emerging technology. Diabet Med. 2009;26:197-210. [DOI] [PubMed] [Google Scholar]
- 14. Goldberg PA, Siegel MD, Russell RR. et al. Experience with the continuous glucose monitoring system in a medical intensive care unit. Diabetes Technol Ther. 2004;6:339-347. [DOI] [PubMed] [Google Scholar]
- 15. Hendee S, Vanslyke S, Stout F. et al. Evaluation of a near-infrared automated blood glucose monitor for use in critical care settings. Critical Care. 2008;12:1. [Google Scholar]
- 16. Bochicchio GV, Lettich K, Lumpkins K. Mid infrared spectroscopy is highly accurate in measuring glucose in ICU patients. Crit Care Med. 2008;36:A64. [Google Scholar]
- 17. Davidson PC, Steed RD, Bode BW. Glucommander: a computer-directed intravenous insulin system shown to be safe, simple, and effective in 120,618 h of operation. Diabetes Care. 2005;28:2418-2423. [DOI] [PubMed] [Google Scholar]
- 18. Nathan DM, Genuth S, Lachin J. et al. The effect of intensive treatment of diabetes on the development and progression of long-term complications in insulin-dependent diabetes mellitus. N Engl J Med. 1993;329:977-986. [DOI] [PubMed] [Google Scholar]
- 19. Lane W, Weinrib S, Rappaport J, Hale C. The effect of addition of liraglutide to high-dose intensive insulin therapy: a randomized prospective trial. Diabetes Obes Metab. 2014;16:827-832. [DOI] [PubMed] [Google Scholar]
- 20. Strandberg RB, Graue M, Wentzel-Larsen T, Peyrot M, Thordarson HB, Rokne B. Longitudinal relationship between diabetes-specific emotional distress and follow-up HbA1c in adults with type 1 diabetes mellitus. Diabet Med. 2015;32:1304-1310. [DOI] [PMC free article] [PubMed] [Google Scholar]
- 21. Rook KS, August KJ, Choi S, Franks MM, Stephens MA. Emotional reactivity to daily stress, spousal emotional support, and fasting blood glucose among patients with type 2 diabetes. J Health Psychol. 2016;21(11):2538-2549. [DOI] [PubMed] [Google Scholar]
- 22. Cox DJ, Gonder-Frederick L. Major developments in behavioral diabetes research. J Consult Clin Psychol. 1992;60:628-638. [DOI] [PubMed] [Google Scholar]
- 23. Morris T, Moore M, Morris F. Stress and chronic illness: the case of diabetes. J Adult Dev. 2011;18:70-80. [Google Scholar]
- 24. Surwit RS, Schneider MS. Role of stress in the etiology and treatment of diabetes mellitus. Psychosom Med. 1993;55:380-393. [DOI] [PubMed] [Google Scholar]
- 25. Mroczek DK, Almeida DM. The effect of daily stress, personality, and age on daily negative affect. J Pers. 2004;72:355-378. [DOI] [PubMed] [Google Scholar]
- 26. Goldberg PA, Siegel MD, Sherwin RS. et al. Implementation of a safe and effective insulin infusion protocol in a medical intensive care unit. Diabetes Care. 2004;27:461-467. [DOI] [PubMed] [Google Scholar]
- 27. Furnary AP, Gao G, Grunkemeier GL. et al. Continuous insulin infusion reduces mortality in patients with diabetes undergoing coronary artery bypass grafting. J Thorac Cardiovasc Surg. 2003;125:1007-1021. [DOI] [PubMed] [Google Scholar]
- 28. van den Berghe G, Wouters P, Weekers F. et al. Intensive insulin therapy in critically ill patients. N Engl J Med. 2001;345:1359-1367. [DOI] [PubMed] [Google Scholar]
- 29. Ogston-Tuck S. Patient safety and pain in IV therapy. Br J Nurs. 2014;23:S10-S11. [DOI] [PubMed] [Google Scholar]
- 30. Uslusoy E, Mete S. Predisposing factors to phlebitis in patients with peripheral intravenous catheters: a descriptive study. J Am Acad Nurse Pract. 2008;20:172-180. [DOI] [PubMed] [Google Scholar]
- 31. Stokowski G, Steele D, Wilson D. The use of ultrasound to improve practice and reduce complication rates in peripherally inserted central catheter insertions: final report of investigation. J Infus Nurs. 2009;32:145-155. [DOI] [PubMed] [Google Scholar]
- 32. Macklin D. Phlebitis: a painful complication of peripheral IV catheterization that may be prevented. Am J Nurs. 2003;103:55-60. [DOI] [PubMed] [Google Scholar]
- 33. Martinho R, Rodrigues A. Occurrence of phlebitis in patients on intravenous amiodarone. Einstein. 2008;6:459-462. [Google Scholar]