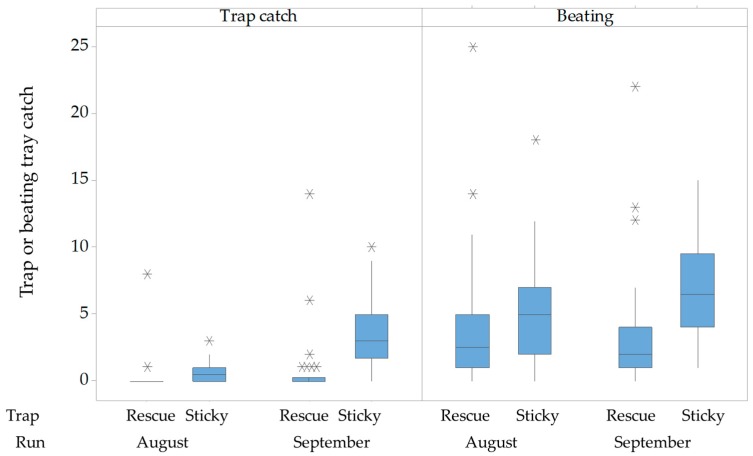
Figure 2.
Boxplot of Halyomorpha halys catch per date from Rescue and sticky traps (left) paired on the right with catches from adjacent (10 m apart) beating trays, in two runs in a hazelnut hedgerow (n = 10 replicates for each trap in each run, August and September) from Experiment 2. Inner lines are medians. The box includes 25–75% of the data, and stars are outliers beyond this. Whiskers are defined in the Methods. Traps were baited with high dose lures.

