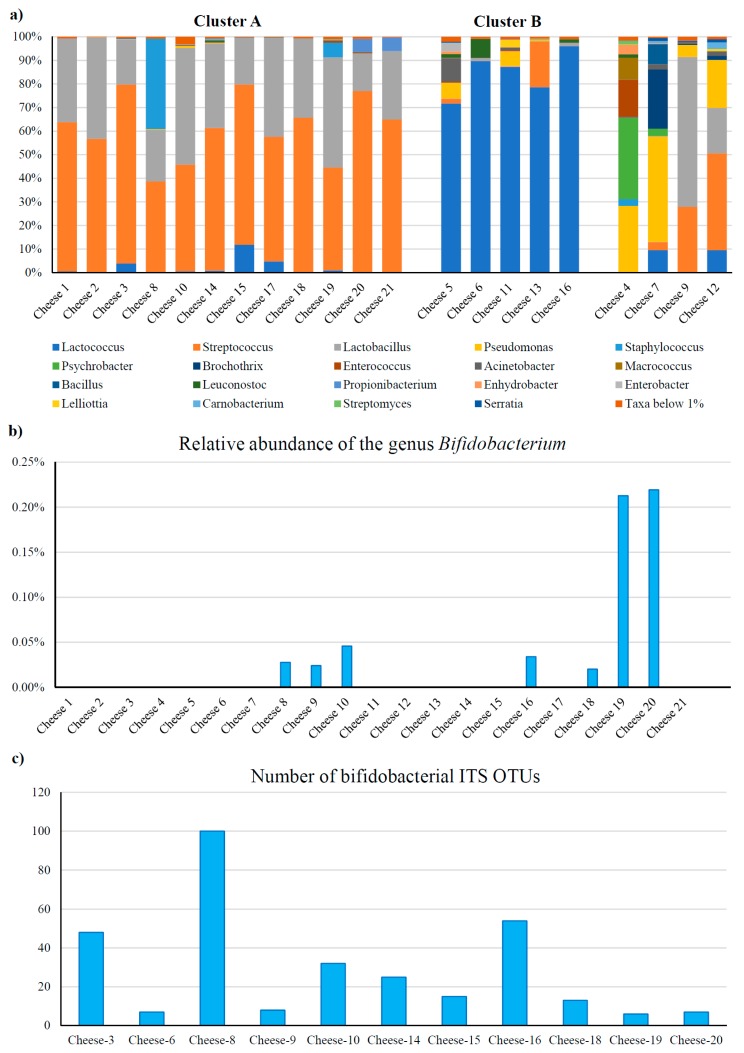
Figure 1.
Taxonomic dissection of the raw cheese microbiota. (a) shows a bar plot representation of the taxonomic composition at the genus level of the profiled microbiota from cheese samples included in this study. Only taxa with relative abundance of >1% are shown. (b) reports the relative abundance of bifidobacteria observed by 16S rRNA gene microbial profiling data in the 21 raw cheese samples. (c) depicts the bifidobacterial biodiversity, reported as the number of operational taxonomic units (OTUs), obtained from bifidobacterial internally transcribed spacer (ITS) profiling data.

