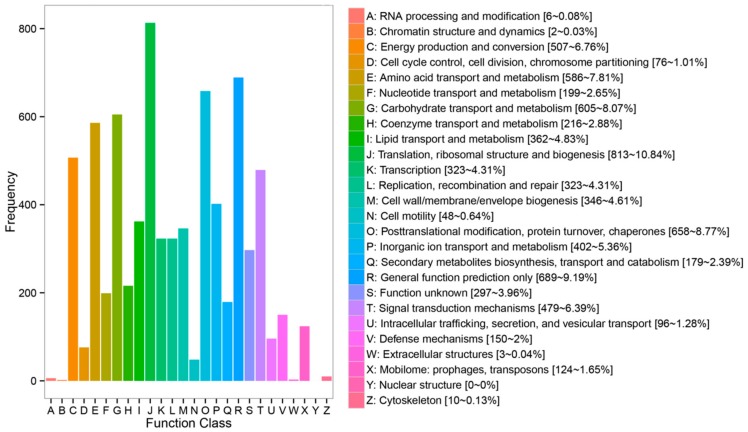
Figure 3.
COG (clusters of orthologous groups of proteins) classification. The name (including number and percentage present) for each class definition is also provided: A: RNA processing and modification (6, 0.08%), B: Chromatin structure and dynamics (2, 0.03%), C: Energy production and conversion (507, 6.76%), D: Cell cycle control, cell division, chromosome partitioning (76, 1.01%), E: Amino acid transport and metabolism (586, 7.81%), F: Nucleotide transport and metabolism (199, 2.65%), G: Carbohydrate transport and metabolism (605, 8.07%), H: Coenzyme transport and metabolism (216, 2.88%), I: Lipid transport and metabolism (362, 4.83%), J: Translation, ribosomal structure and biogenesis (813, 10.84%), K: Transcription (323, 4.31%), L: Replication, recombination and repair (323, 4.31%), M: Cell wall/membrane/envelope biogenesis (346, 4.61%), N: Cell motility (48, 0.64%), O: Posttranslational modification, protein turnover, chaperones (658, 8.77%), P: Inorganic ion transport and metabolism (402, 5.36%), Q: Secondary metabolites biosynthesis, transport and catabolism (179, 2.39%), R: General function prediction only (689, 9.19%), S: Function unknown (297, 3.96%), T: Signal transduction mechanisms (479, 6.39%), U: Intracellular trafficking, secretion and vesicular transport (96, 1.28%), V: Defense mechanisms (150, 2%), W: Extracellular structures (3, 0.04%), X: Mobilome: prophages, transposons (124, 1.65%), Y: Nuclear structure (0, 0%), Z: Cytoskeleton (10, 0.13%).

