Abstract
The ‘fate’ of growth plate hypertrophic chondrocytes has been long debated with two opposing theories: cell apoptosis or survival with transformation into osteogenic cells. This study was carried out on the proximal tibial growth plate of rabbits using light microscopy, scanning and transmission electron microscopy. We focused particularly on the orientation of the specimens included in order to define the mineral deposition and the vascular invasion lines and obtain histological and ultrastructural images at the corresponding height of the plate. Chondrocyte morphology transformation through the maturation process (characterized by vesicles and then large cytoplasmic lacunae before condensation, fragmentation and disappearance of the nuclear chromatin) did not correspond to that observed in the ‘in vitro’ apoptosis models. These findings rather suggested the passage of free water from the cartilage matrix into a still live cell (swelling). The level of these changes suggested a close relationship with the mineral deposition line. Furthermore, the study provided evidence that the metaphyseal capillaries could advance inside the columns of stacked hypertrophic chondrocytes (delimited by the intercolumnar septa) without the need for calcified matrix resorption because the thin transverse septa between the stacked chondrocyte (below the mineral deposition line) were not calcified. The zonal distribution of cell types (hypertrophic chondrocytes, osteoblasts, osteoclasts and macrophages) did not reveal osteoclasts or chondroclasts at this level. Morphological and morphometric analysis recorded globular masses of an amorphous, necrotic material in a zone 0–70 μm below the vascular invasion line occasionally surrounded by a membrane (indicated as ‘hypertrophic chondrocyte ghosts’). These masses and the same material not bound by a membrane were surrounded by a large number of macrophages and other blood cell precursors, suggesting this could be the cause of macrophage recall and activation. The most recent hypotheses based on genetic and lineage tracing studies stating that hypertrophic chondrocytes can survive and transform into osteoblasts and osteocytes (trans‐differentiation) were not confirmed by the ultrastructural morphology or by the zonal comparative counting and distribution of cell types below the vascular invasion line.
Keywords: endochondral ossification, growth plate cartilage, hypertrophic chondrocyte apoptosis, trans‐differentiation chondrocyte‐osteoblasts
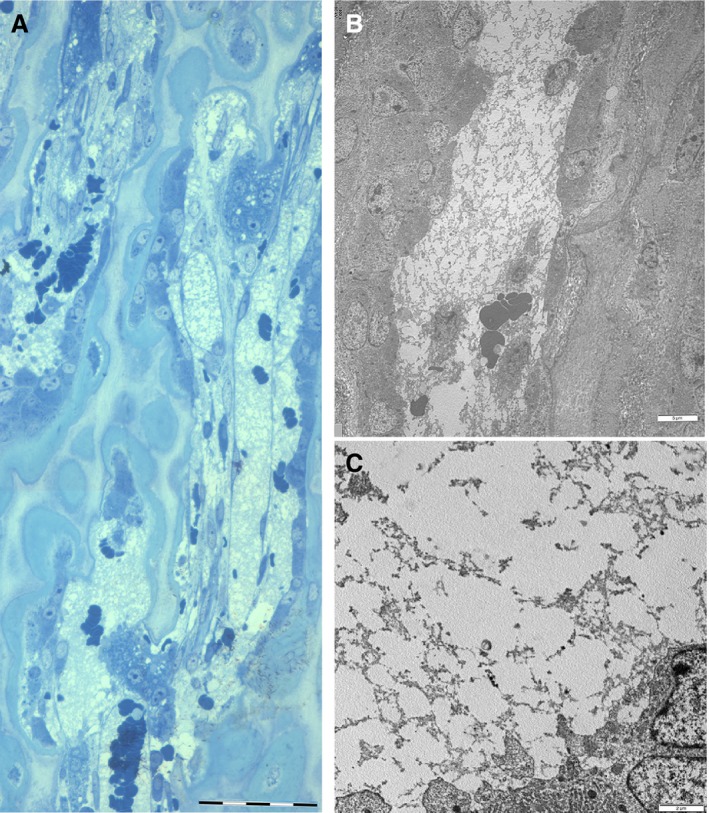
Necrotic cytoplasmic material from hypertrophic chondrocytes (in the figure still surrounded by the cellular membrane) below the vascular invasion line was documented. These ‘hypertrophic chondrocyte ghosts’ and the same material not bound to a membrane started the macrophagic reaction.

Introduction
In the classic description of endochondral ossification in the growth plate cartilage as presented in anatomy textbooks, hypertrophic chondrocytes are said to undergo a fate of death or apoptosis once they have fulfilled the function of providing the cartilage with a mineralized scaffold for osteoblast apposition. These cells are believed to derive from an independent cell lineage entering the lacunae left empty by hypertrophic chondrocytes from the capillary buds of the metaphyseal vessels (Trueta & Little, 1960; Stanka et al. 1991). This view has been supported by early histological studies of metaphyseal vascular tree injection (Morgan, 1959; Trueta & Morgan, 1960; Brookes & Landon, 1964) and later by the morphological documentation of the terminal microvasculature obtained using SEM after resin perfusion and corrosion casting (Stanka et al. 1991) and using transmission electron microscopy (Trueta & Little, 1960; Anderson & Parker, 1966; Schenk et al. 1968).
The structural organization of the metaphyseal growth plate where endochondral ossification occurs, provides clear evidence of a close spatial and temporal relationship among a series of cellular processes which include: (1) The chondrocyte maturation cycle leading to cell hypertrophy or swelling as far as to apoptosis; (2) mineral deposition in the cartilage matrix at the hypertrophic chondrocyte columns; (3) angiogenesis advancing from the diaphyseal front; (4) the differentiation of osteogenic cells starting to appose the bone matrix on the calcified intercolumnar septa (primary metaphyseal trabeculae).
The issue of the origin of osteogenic cells has already been discussed in early histological and histochemical studies that suggested possible hypertrophic chondrocyte survival with transformation into osteoblasts (Shoeney, 1876; Van der Stricht, 1890; Brachet, 1893). This hypothesis has been debated ever since, enriched by the application of several methods of study such as autoradiography (Kember, 1960; Crelin & Koch, 1967; Bentley & Greer, 1970) and chondrocyte in vitro or organ culture (Descalzi Cancedda et al. 1992; Gentili et al. 1993; Ishizeki et al. 1996; Erenpreisa & Roach, 1996; Bianco et al. 1988). More recently, genetic and lineage tracing studies have been applied, as reviewed by Tsang et al. (2015). The basic hypothesis is that hypertrophic chondrocytes can survive in the growth plate and make a transition to become osteoblasts and osteocytes: this process is indicated by the scientific term ‘trans‐differentiation’. The models used in these latter studies included embryonic cartilage anlagen, post‐natal growth plate cartilage and bone fracture healing (Yang et al. 2014; Zhou et al. 2014).
The trans‐differentiation hypothesis requires a set of structural changes of hypertrophic chondrocytes, which must gradually assume the osteoblast morphology; furthermore, this transformation must occur in a very limited space of the growth plate, just below the line of mineral deposition on the intercolumnar septa. Therefore, the aim of this study was to test the trans‐differentiation of chondrocytes into osteoblasts with the application of morphologic techniques. In this perspective, particular care was taken with the positioning of the ultrastructural fields so as to achieve a precise correlation between the TEM images and the hemi‐thin cross‐sections. The latter were also used for the morphometric analysis.
Materials and methods
Five male New Zealand white rabbits 3 months old (weight range 1.5–2 kg) were purchased from G. Bettinardi (Momo, Novara, Italy). Skeletal maturity with closure of all the physes is reached in this species at 8–10 months of age. The animals were housed in individual cages (320 × 180 × 160 cm) in a controlled environment (22 ± 1 °C, 55 ± 5% relative humidity, 12 h light/12 h dark cycle), with free access to standard commercial rabbit food and tap water. At least 7 days were allowed for animals to acclimatize before starting the experiment.
The experimental procedure was conducted according to the guidelines of the Italian Ministry of Health for the care and use of laboratory animals (approved for Valeria Sibilia by Italian Ministry of Health DGST 0024629) and by the Animal Ethics Committee of the University of Milan (reg. no. 18/2010) and undertaken in accordance with the Guide for the Care and Use of Laboratory Animals (NIH Publication no. 85‐23, revised 1996). Euthanasia was performed using an appropriate dose of ketamine chlorhydrate (Imagel, Mevial Italia SpA, Assago, Italy) and xylazine (Rompun, Bayer AG, Leverkusen, Germany). Only the proximal, tibial growth plate was used in the study because its regular and flat shape (perpendicular to the long tibial axis) made it easier to cut and position the small longitudinal parallelepipeds (3 × 1 × 1 mm) for the ultrastructural study.
Specimens processing
The tibial proximal meta‐epiphyses were separated from the soft tissue and split in the mid‐coronal plane with a thin chisel into a front and rear half. The specimens for light microscopy (undecalcified) were fixed in glutaraldehyde H2O solution (4% buffered at pH 7.4) for a week and embedded in paraffin: 7‐μm‐thick cross‐sections were cut with a sledge microtome in the frontal plane and stained with Von Kossa‐haematoxylin‐eosin.
The specimens for morphometric and ultrastructural study were reduced to a transverse band corresponding proximally to the sub‐chondral bone layer of the epiphyseal centre and distally to the metaphyseal trabeculae. These were fixed in a mixture of 2.5% glutaraldehyde and 2% paraformaldehyde in 0.1 m sodium cacodylate buffer at pH 7.4 and then divided in two groups: the first was decalcified in 10% ethylenediaminetetraacetic acid (EDTA) solution for a week, the second left undecalcified. Under the control of a stereomicroscope (Olympus SXZ 7) at an enlargement of 16×, in a bath of the buffered fixative solution, longitudinal parallelepipeds were prepared with a thin scalpel and then dehydrated and included in Epon 812 resin (EMS, Fort Washington, PA, USA). Thin and hemi‐thin cross‐sections were cut with an RtXL ultramicrotome (MRC, Tucson, AZ, USA). The structures were identified by their morphologic characteristics using light microscopy on hemi‐thin cross‐sections stained with toluidine blue. The ultra‐thin cross‐sections were collected on grids and contrasted with uranyl acetate and lead citrate and then observed with a Philips Morgagni transmission electron microscope (Philips, Eindhoven, The Netherlands).
Morphometry
The morphometric study was carried out on toluidine‐stained hemi‐thin cross‐sections, selecting those parallel to the longitudinal, tibial, axis. With reference to the lines of mineral deposition and vascular invasion defined by light microscopy cross‐sections stained with Von Kossa‐haematoxylin‐eosin (Fig. 1A,B). The morphometry fields at 400× magnification were randomly selected in the hemi‐thin cross‐sections (stained with toluidine blue). These were positioned at the following levels: (a) zone above the vascular invasion line for the counting and measurement of hypertrophic chondrocyte lacunae; (b) zone 0–70 μm below the vascular invasion line and (c) zone 70–150 μm below the vascular invasion line for counting and assessment of cell types of zonal distribution (Fig. 2A and 3A). The chondrocyte lacunae were largest at the bottom of the column and the chondrocyte inside displayed the higher degree of swelling, or occasionally appeared empty; in zones (b) and (c) (below the vascular invasion line) all the intercolumnar spaces contained capillaries and a mixed cell population which were classified according to their morphology. The rectangular fields (positioned perpendicular to the longitudinal axis) were taken at 400× magnification with an Olympus XT30 microscope, with a field area of 218.63 × 163.63 μm = 0.035 mm2. The classification of the perivascular cells of the advancing capillaries was based on the correspondence of the characteristics revealed by the higher definition given by the TEM ultrastructure of the corresponding thin cross‐sections. This allowed us in addition to hypertrophic chondrocytes to distinguish macrophages, osteoblasts and osteoclasts. Other blood cell precursors such as erythrocytes, megakaryocytes, platelets and granulocytes were not counted.
Figure 1.
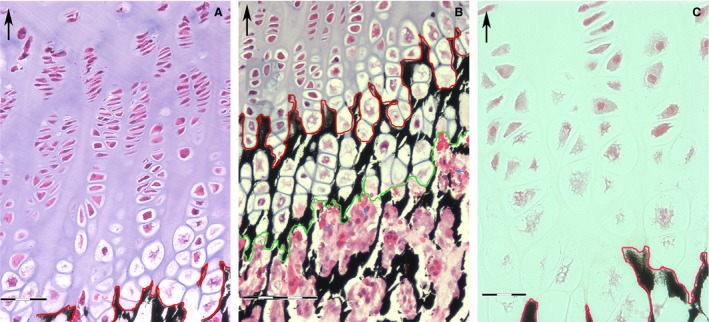
Undecalcified section, Von Kossa‐haematoxylin‐eosin. (Top, left corner arrow = longitudinal tibial axis). (A) Progression of chondrocyte maturation cycle in the rabbit tibia proximal growth plate. The red line marks the front of mineral deposition. The hypertrophy of chondrocytes starts about 50 μm above the line of mineral deposition. Scale bar: 60 μm. (B) Zone of endochondral ossification: the red line marks the mineral deposition line and the green marks the vascular invasion line: this band of tissue has a regular thickness of about 100 μm and at this level the hypertrophic lacunae reach the largest expansion. No hypertrophic chondrocyte is found below the vascular invasion line; the lacunar spaces are filled by a pool of densely packed cell; capillaries are recognizable by the presence of erythrocytes. Scale bar: 100 μm. (C) Structural changes with fragmentation of the chondrocyte nuclear chromatin start to be observed above the line of mineral deposition. Scale bar: 30 μm.
Figure 2.
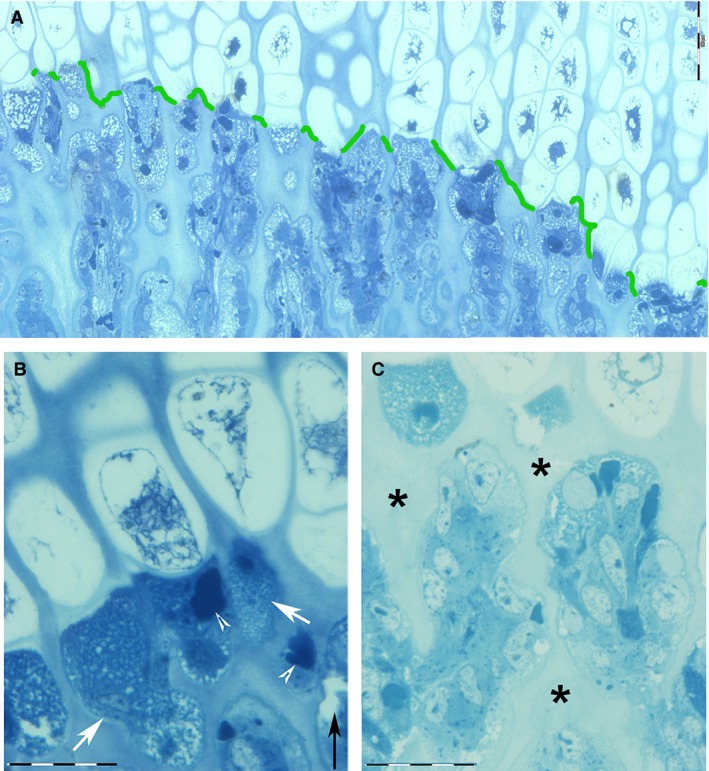
Decalcified, hemi‐thin section, toluidine blue. (A) Panoramic, transverse view of the band of tissue corresponding to the vascular invasion line (green): sharp separation between the hypertrophic chondrocyte zone (above) and the tunnels formed by old, vertically aligned chondrocyte lacunae (below), which are now invaded by capillaries and the accompanying cells. Scale bar: 100 µm. (B) Detail of the vascular invasion line documenting the more advanced stage of chondrocyte hypertrophization (above the vascular invasion line) and the small, rounded, vesicles (arrows) of the content of chondrocyte lacunae below, (whose nature is revealed by the high‐resolution TEM images in 3 B,C)..Scale bar: 20 µm).(B,C) The densely packed, small, rounded bodies (arrowheads) are red cells corresponding to capillaries. (C) Detail taken a little below the vascular invasion line (arrow), documenting the capillaries’ advancement between the intercolumnar septa (asterisks) and the densely packed cells, which are typified by the high‐resolution TEM images of Fig. 3C. Scale bar: 20 µm.
Figure 3.
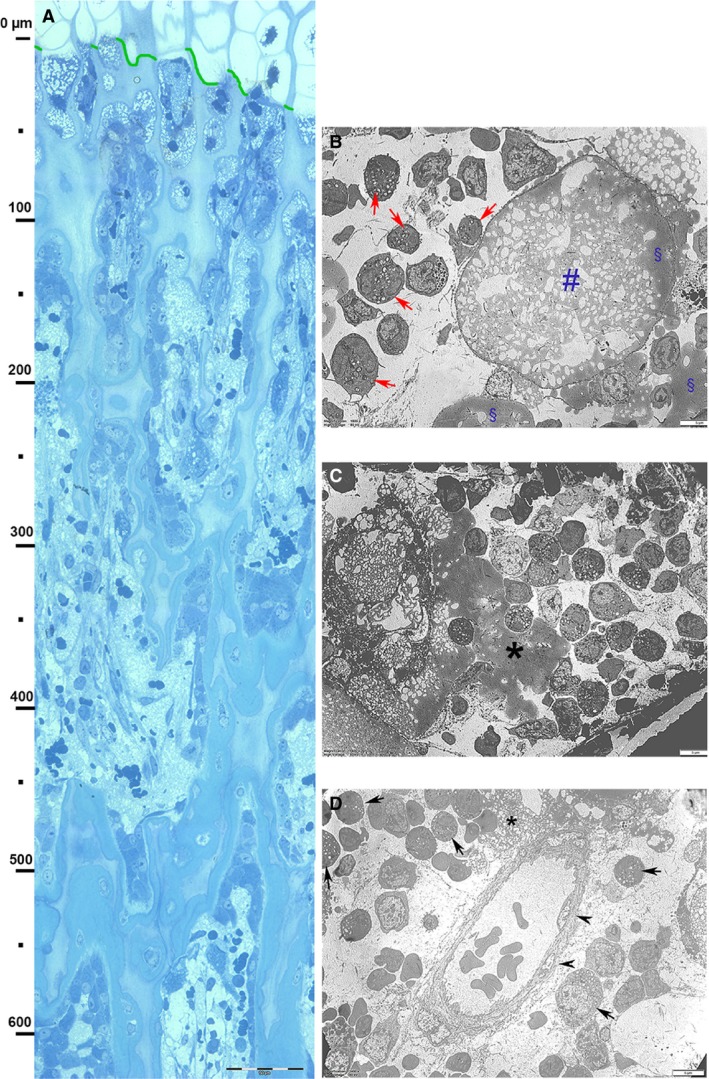
Decalcified, hemi‐thin section, toluidine blue. Vertical band from the vascular invasion line to the metaphyseal region and TEM details of the upper layer (level 0–70 µm below the vascular invasion line). (A) Panoramic view of the vertical band: aligned osteoblasts on the cartilage columnar septa can be observed from about 70 µm below the vascular invasion. A bone matrix layer on the columnar septa starts to be evident from the 150‐µm level and progressively increases toward the metaphysis. Scale bar: 100 µm. (B) Ultra‐thin TEM section contrasted with uranyl acetate and lead citrate below the vascular invasion line (level 0–70 lm). Necrotic, cytoplasmic material of a hypertrophic chondrocyte still surrounded by the cellular membrane ‘HC ghost’ (#). The prevailing cell types around it consists of macrophages (arrows), but blood cell precursors (both coming from capillaries) can also be observed. No evidence of differentiated osteoblasts at this transverse level. Scale bar: 5 µm. (C) More advanced phase of ‘HC ghost’ necrosis. The prevailing cell population surrounding the necrotic material (*) consists of macrophages and blood cell precursors (arrowheads). No evidence of differentiated osteoblasts at this transverse level. Scale bar: 5 µm. (D) At level 0–70 µm, the image shows a capillary with endothelial cells (arrowheads) and a well structured basal membrane: it is surrounded by a mixed population of macrophages (arrows) and blood cell precursors. Necrotic material is evident in the central top sector (*). Scale bar: 5 µm.
The following, morphometric parameters were assed in each field:
| 1. Number of hypertrophic chondrocyte lacunae | (n) | NHCL |
| 2. Total hypertrophic chondrocyte lacunae area | (μm2) | HCLTA |
| 3. Mean single chondrocyte lacunar area | (μm2) | MSCLA (HCLTA/NHCL) |
| 4. Density of hypertrophic chondrocyte lacunae | (n μm−2) | DHCL (NCHL/field area) |
| 5. Number of macrophages | (n) | NMph |
| 6. Macrophage density | (n μm−2) | DMph (NMph/field area) |
| 7. Number of osteoblasts | (n) | NOstb |
| 8. Osteoblast density | (n μm−2) | DOstb (NOstb/field area) |
| 9. Number of osteoclasts | (n) | NOstc |
The sectorial distribution of these cells in zones above and below the vascular invasion line (Fig. 2and 3A) prompted the statistical comparison of number/density between hypertrophic chondrocytes and structured osteoblasts and the semi‐quantitative evaluation of zonal distribution of the morphologically typified cells.
Digitation technique and measurement
The digital images of the microscopic field were obtained using a Color View IIIb camera (Soft Imaging System GmbH, Munster, Germany), processed with the program Adobe photoshop, outlining each chondrocyte lacuna: using the fill function (bucket), the area of the hypertrophic chondrocyte lacuna was stained in black. The total number of chondrocyte lacunae and their total lacunar area were assessed using the program imagej (Schneider et al. 2012) with the program's colour threshold function to distinguish the stained lacunae from the neighbouring matrix.
To get a more reliable assessment of the parameters of number, density and mean single hypertrophic lacunar area, a bias had to be considered, because the lacunae tangentially sectioned above or below the plane corresponding to the true (3‐D) major perimeter gave a lower lacunar area. As the smaller lacunae in the field appeared empty, they could be distinguished by the population of regular lacunae with the hypertrophic chondrocyte inside: the former represented 6.67 ± 0.39% of the latter and were not excluded from the computation of the parameters of number and density. On the other hand, the chondrocyte lacunae that were intersected by the field edge were excluded from morphometric assessment when only a marginal part was included in the field (less than two‐thirds of the widest lacuna in the field). These criteria introduced a mild overestimation of the parameters of hypertrophic chondrocyte number and density and a lower value for the mean single chondrocyte lacunar area, but were insignificant in the statistical comparison with macrophage/osteoblast number and density.
For macrophages, osteoblasts and osteoclasts, only the parameters of number and density were evaluated.
Statistical analysis
The accuracy of chondrocyte lacunar outline delimitation (performed manually) and the counting of cells was tested by comparing the repeated measurements obtained independently by two investigators (M.R. and L.C.) on a sample of 50% of the histological fields equally distributed above and below the vascular invasion line. The intra‐observer and interobserver variation (Bland & Altman, 2010) showed an acceptable degree of agreement (95% confidence interval).
The assessed morphometric parameters reported in Table 1 were represented as the mean ± standard error of the mean (SEM). Statistical analysis was performed using a statistic package (prism, Graph Pad Software, San Diego, CA, USA). Differences between groups were assessed by one‐way analysis of variance (ANOVA) followed by Dunnett's test; a probability of P < 0.05 was considered statistically significant.
Table 1.
(A) Morphometric parameters of hypertrophic chondrocyte lacunae with number of hypertrophic chondrocytes compared with the number of osteoblasts in microscopic fields (400x) aligned with the vascular invasion line. (B) Sectorial distribution of hypertrophic chondrocyte, macrophages, osteoblasts and osteoclasts: semi‐quantitative assessment in microscopic fields (200x) of the growth plate cartilage
| (A) | HCL | Ostb |
|---|---|---|
| Mean number (n) | 29.21 ± 0.60 | 51.91 ± 0.80*** |
| Mean density (n mm−2) | 854.6 ± 17.29 | 1483 ± 22.87*** |
| Mean single lacunar area (μm2) | 483.70 ± 6.24 | – |
| (B) | HCL | Mph | Ostb | Ostc |
|---|---|---|---|---|
| Above the vascular invasion line | ++ | 0 | 0 | 0 |
| Below the vascular invasion line | ||||
| Level: 0–50 μm | 0 | ++ | 0* | 0 |
| Level: metaphyseal trabeculae | 0 | 0 | +++ | + |
0, absent; +, >10/field; ++, >30/field; +++, >60/field.
***P < 0.001.
*Among class blood cells (not counted) morphology did not allow the latter to be distinguished from osteoblast precursors.
Scanning electron microscopy
Unstained, undecalcified paraffin glass slides were deparaffinized in xylol for 2 h, dehydrated in a series of increasingly concentrated ethanol solution, with a final stage in hexamethyldisilazane for 30 min before being left to dry at room temperature (24 °C) for 24 h. Other specimens were prepared from original meta‐epiphyses with a fracture in the frontal plane made with a chisel. These specimens were also processed as described earlier. The specimens and glass slides were secured on stubs with conducting tape, coated with a thin layer of gold in an Emitech K550 vacuum sputter (EMC, Fort Washington, PA, USA) and observed with a XL30 SEM (Philips, Eindhoven, The Netherlands) in the secondary electron image (SEI).
Results
Light microscopy morphology and morphometry
The growth cartilage above the vascular invasion line consisted exclusively of one cell type: the chondrocyte. The lacunar area increased from the germinative cell layer up to the invasion line, with an evident correlation with the changes in shape, varying progressively from small and globular to flattened and stacked and then to very large, globular lacunae (Fig. 1A). This topography of the lacunar pattern, common to the growth plate cartilage anatomy in all vertebrates, was closely linked to the transformations in the chondrocyte morphology. Small vesicles could already be observed inside the nuclear chromatin and the cytoplasm at the seriate cell layer: these increased in number and area together with cell enlargement. The transverse band delimited by the line of mineral deposition and line of vascular invasion with a height between 100 and 200 μm (Fig. 1B) represented the peak of this transformation, where the chondrocyte nuclei could seldom be identified by remnants of the nuclear membrane (Fig. 1C).
The progression of the chondrocyte changes and their relationship with the mineral deposition in the matrix, the vascular invasion of the cartilage and the beginning of endochondral ossification was well documented by the light microscopy slides. A first line could be traced following the outline of the matrix and the lacunar border where the mineral deposition started; a second line marked the edge of lacunae that were filled by capillaries and the perivascular cell (Fig. 1B). Neither line was straight, being formed by the sequence of lacunar arcs delimited by the mineralized matrix (line of mineral deposition) or by the profile of the invaded lacunae (line of vascular invasion). However, when considered on the full extension of the growth plate at low magnification, both the segmented profiles were almost parallel and aligned perpendicularly to the longitudinal tibial axis.
Mineral deposition occurred on the matrix of the intercolumnar septa, whereas the thin, transverse partitions between the overlapping lacunae remained uncalcified. This observation deserves attention because it is a factor relevant to the vascular invasion pattern: indeed, the metaphyseal capillaries can advance inside the tunnels delimited by the calcified intercolumnar septa without the need for calcified matrix resorption, and the stiff intercolumnar septa force the straight vascular advancement. Two constant features characterized the endochondral ossification of the growth plate: the vertical vascular axis, shown in light microscopy by the red cells and the perivascular cell types, and the alignment with the tunnel still occupied by hypertrophic chondrocytes above the vascular invasion line. These observations supported the fact that the vascular advancement in the growth plate made maximum use of pre‐formed tunnels, without implicating calcified matrix resorption.
With the exclusion of red cells, standard histology did not allow the perivascular cells to be typified, but toluidine blue‐stained, hemi‐thin cross‐sections gave a higher resolution of the morphology of these cells. Chondrocyte shrinkage with detachment of the cellular membrane from the matrix lacunar border was evident at all levels of the growth plate; however, this was clearly to a lesser degree in the germinative and seriate cell layers than in the hypertrophic chondrocytes. The cytoplasm of these cells featured large, empty vacuoles and lacunae, whereas at mineral deposition level, the position of the nucleus was suggested by a nuclear membrane ring without nuclear chromatin inside (Fig. 8C).
Figure 8.
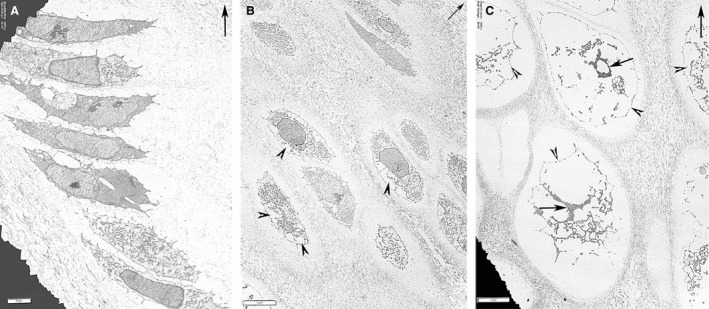
Ultra‐thin cross‐sections contrasted with uranyl‐acetate and lead‐citrate using TEM: fields of the growth plate cartilage above the vascular invasion line (top right arrow = longitudinal tibial axis). (A) (TEM) Growth plate cartilage and seriate chondrocyte cell layer show no evidence of nuclear or cytoplasmic apoptosis. Scale bar: 2 µm. (B) (TEM) Growth plate cartilage with chondrocyte volume increase and first signs of cytoplasmic lacunae (arrowheads). No changes to the nuclear chromatin. Scale bar: 5 µm. (C) (TEM) Hypertrophic chondrocytes with very large empty lacunae inside the cytoplasm; the cellular membrane is still continuous (arrowhead). The nuclear chromatin is fragmented and condensed (arrows), no nuclear membrane is recognizable. Scale bar: 5 µm.
Below the vascular invasion line, the observation of bunched red cells documented the vascular supply advancement (Fig. 2AB); a pool of cells, which varied in size and morphology in relation to the metaphyseal zone level, surrounded the capillaries (Fig. 3A).
Figure 5.
Decalcified, hemi‐thin section, (major magnification of Fig. 3 at about 500 µm below the vascular invasion line) and TEM details at the corresponding level. (A) Primary, metaphyseal trabeculae formed by a cartilage core and by a layer of bone matrix apposed by osteoblasts lined on the surface. A large, longitudinally oriented capillary is delimited by the endothelial cells and the basal membrane; other vascular lacunae fill the medullary spaces between the metaphyseal trabeculae. Erythrocytes and a fluffy, amorphous material fill the vascular spaces. Trabecular remodelling is performed by multinuclear osteoclasts. Scale bar: 50 µm. (B) (TEM) Detail of a vascular space without evidence of endothelial cell and basal membrane between the metaphyseal trabeculae lined by osteoblasts. The fluffy, amorphous material inside the vascular lacuna is the same as that observed inside capillaries. Scale bar: 6 µm. (C) (TEM) Detail at higher magnification of the amorphous material suggesting fibrin deposits. Scale bar: 2 µm.
There was a clear‐cut cell type distribution in the growth plate represented by the boundary of the vascular invasion line: there were no macrophage, osteoblast or other blood cell precursors above this line and no intact hypertrophic chondrocytes below (Figs 1A,B and 2A–C). The transition was clearly highlighted by the contextual observation below the vascular invasion line of masses of amorphous material (occasionally delimited by a membrane) surrounded by macrophages (Fig. 3B–D). Examination of the area above the vascular invasion line distinguished the hypertrophic chondrocyte lacunae from the empty lacunae: the latter were not excluded from determination of the parameters of number, density and mean single lacunar area. However, calculation did exclude those hypertrophic lacunae marginally intersected by the field border. No osteoclast was documented at the level of the vascular invasion line, but they were observed more distally at the metaphyseal trabeculae level (Fig. 3A).
The mean number and density of hypertrophic chondrocyte lacunae (= mean number of hypertrophic chondrocytes) were significantly lower than that of osteoblasts (P < 0.001; Table 1A). The semi‐quantitative evaluation of cell distribution (Table 1B) confirmed the sectorial distribution of the cell types with no chondrocytes below the vascular invasion line and a concentration of macrophages in zone 0–70 μm below the line.
SEM morphology
The unstained, deparaffinized glass slides and the fractured meta‐epiphyses processed as described in Materials and Methods allowed us to observe the cut surface of the chondrocyte inside the corresponding lacunae. The first confirmed the change in shape and volume from the germinative to the hypertrophic cell layer (Fig. 6A). The cytoplasm was dense and compact in the germinative layer with a limited detachment from the border of the lacunar wall due to processing shrinkage (Fig. 6B). At the level of the calcified intercolumnar septa, very large vacuoles and tears filled the cell without distinction between the nucleus and the cytoplasm of figure 7. The slides provided a 3‐D image of the tunnels’ inner surface opened by the fracture plane: above the line of vascular invasion, the stacked lacunae divided by the thin, transverse septum were still evident after removal of the chondrocyte, below the advancing capillary with the associated cells (Fig. 7A). At the level of the secondary, metaphyseal trabeculae, one side of the fractured surface exposed the sheet of osteoblasts actively deposing bone matrix on the calcified cartilage core of the trabecula (Fig. 7B).
Figure 6.
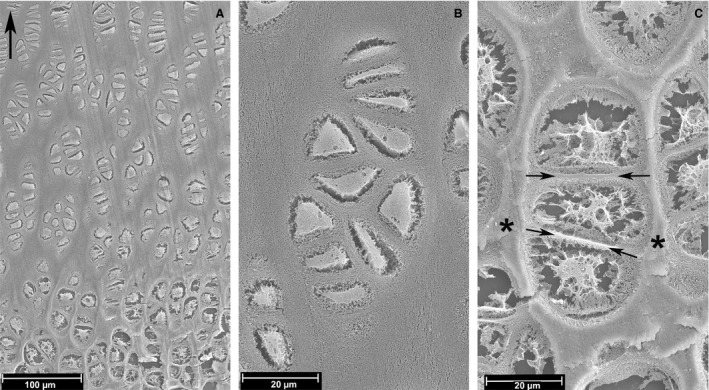
Unstained, paraffin section, 10 µm thick, gold‐coated and observed with SEM (top left corner arrow = longitudinal tibial axis). (A) (SEI) Decalcified section. Low‐power view of the growth plate cartilage. Chondrocyte shrinkage that detaches the cell membrane from the lacunar border is found in all the cells, independently of the maturation phase; it represents a processing artefact; no relevant cytoplasmic vacuoles and large lacunae up to about 100 µm above the line of mineral deposition. Scale bar: 100 µm. (B) (SEI) Decalcified section. Seriate chondrocyte cell layer with shrinkage and few, small intracytoplasmic cysts. The protoplasm appears compact. Scale bar: 20 µm. (C) (SEI) Undecalcified section. Hypertrophic chondrocyte cell layer with nuclear vacuolization and even larger cytoplasmic lacunae. The intercolumnar septa matrix is calcified (asterisk), whereas the thin, transverse septa between the stacked lacunae and the layer of cartilage surrounding the group of cells are not calcified (arrows). Scale bar: 20 µm.
Figure 7.
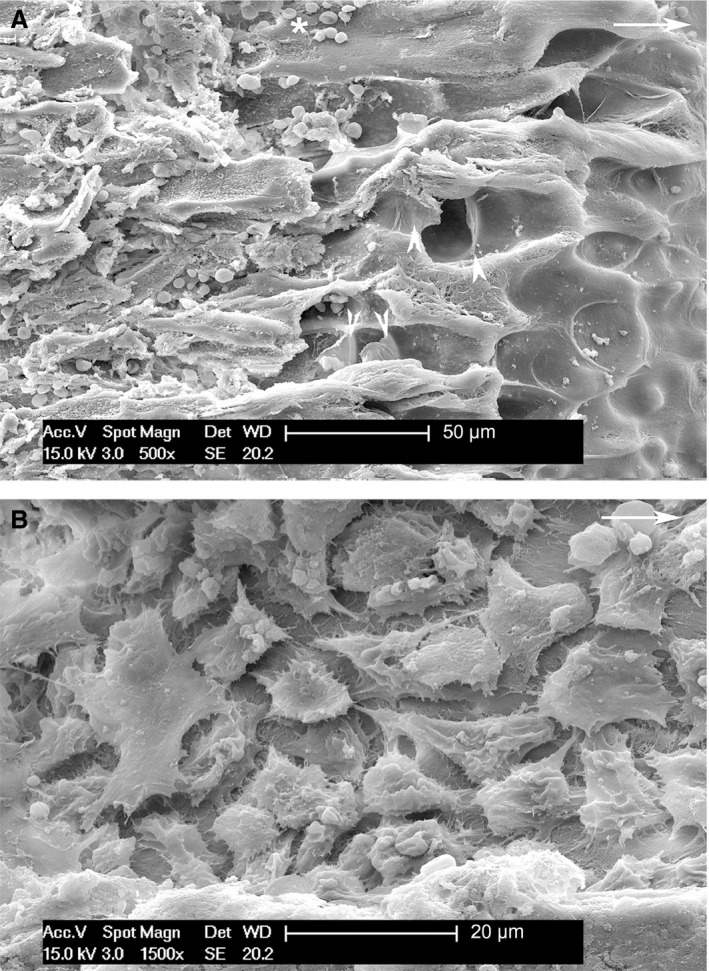
Longitudinal, fractured growth plate specimen processed for SEM (top right arrow = longitudinal tibial axis). (A) (SEI) The fractured surface exposed on the right‐hand side of the figure shows the tunnels of hypertrophic chondrocytes with the thin transverse septa (arrowheads). The left‐hand side shows the upper, vascular invasion zone (level 0–70 µm below the vascular invasion line) with erythrocytes from the torn capillaries (arrows). No osteoblasts are present on the intercolumnar septa surface. Scale bar: 50 µm. (B) (SEI) Fractured surface (level about 400–500 µm below the vascular invasion line) showing sheet of osteoblasts spreading on the surface of the calcified cartilage septa beginning to form the bone matrix layer of the primary metaphyseal trabeculae. Scale bar: 20 µm.
TEM morphology
As regards the seriate cell layer, the flattened chondrocytes had a compact nuclear chromatin, nucleoli and developed cytoplasmic organelle (Fig. 8A). The progression of chondrocyte enlargement started with an increase of the lacunar spaces inside the cytoplasm that did not contain electron‐dense material and the endoplasmic reticulum was well represented and most nuclei still had a regular appearance (Fig. 8B). Below the line of mineral deposition, the hypertrophic chondrocytes reached the widest expansion, with the cellular membrane delimiting wide, empty intracellular spaces with scattered fragments of denser cytoplasmic material, structurally not recognizable as mitochondria, ribosomes, endoplasmic reticulum or Golgi apparatus. The nuclei underwent a similar transformation with fragmented or dispersed chromatin or occasionally leaving an empty ring enclosed by the nuclear membrane (Fig. 8C).
Below the line of vascular invasion, the intercolumnar spaces were occupied by capillaries and by a pool of cells already identified in hemi‐thin cross‐sections): the thin cross‐sections gave a higher resolution that was useful for more accurate recognition and confirmation of cell types (Fig. 3B–D): erythrocytes inside the capillary lumen and a sheet of macrophages were associated with marrow progenitor cells of the haemopoietic and osteoblastic lineage in the perivascular space.
The images of globular masses of an amorphous, grey, electron density material, filled by irregular bubbles and occasionally delimited by a membrane (the latter the same size as hypertrophic chondrocytes) were observed exclusively in the 0–70 μm zone and are indicated by the term ‘hypertrophic chondrocyte ghost’. These and other deposits of the same material non‐bound to a peripheral membrane (Fig. 3B–D) appeared to be the cause of the macrophage recall at the site where endochondral ossification starts. The macrophage lysosomes had a clear or a high‐density lipid content (Fig. 4). We interpreted these features as necrotic material derived from the hypertrophic chondrocyte degeneration. To the best of our knowledge, there has been no previous morphological documentation of the advanced phase of chondrocyte protoplasm degradation in the growth plate and of the role of macrophages as opposed to chondroclasts (Lewinson & Silberman, 1992).
Figure 4.
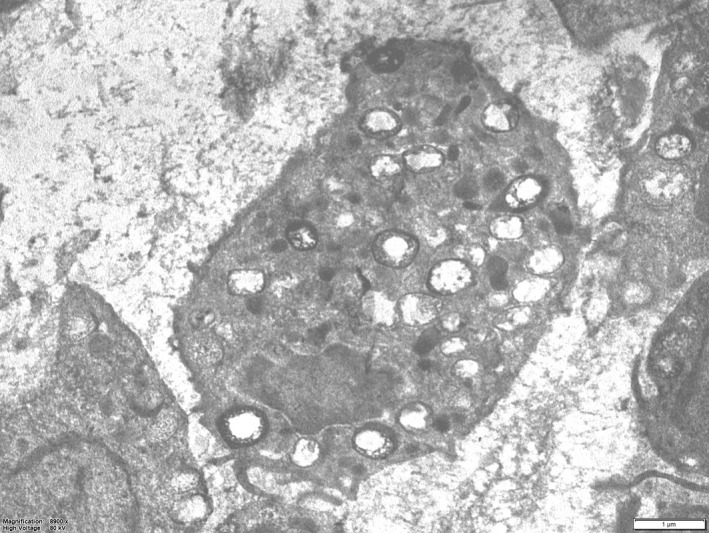
(TEM) Detail of a macrophage (at level 0–70 µm of Fig. 2A). The cell cytoplasm is loaded by lysosomes: these may display a clear content or may be partially filled by vesicular or amorphous material (secondary lysosomes). Scale bar: 1 µµm)
Discussion
Programmed cell death (apoptosis) has a relevant role in tissue regulation and homeostasis, as well as in organ development and growth in multicellular organisms (Willie et al. 1980). A large amount of evidence has been collected in support of the fact that different pathways lead to cell death in terms of distinguished, causal factors and environmental conditions (Kumar et al. 2017). Experimental models with cultured cells were characterized not only by the different mechanisms and biochemical pathways of programmed cell death, but also by the ultrastructural changes corresponding to the cell apoptosis type and phase. The following morphological figures were recorded: DNA cleavage, apoptotic chromatin condensation, nuclear break‐down, cell shrinkage, membrane blebbing, membrane‐enclosed cell portions (apoptotic bodies) (Willie, 1987; Lucchetti et al. 2004; Burattini et al. 2009; Salucci et al. 2010).
The growth plate chondrocytes belong to the ‘organ development’ category from the programmed cell death perspective, and the question of hypertrophic chondrocyte survival has been long debated and is still discussed today. The complexity of the methodological approach that this specific topic raised was due to the consequential nature of the chondrocyte maturation cycle, with calcification and the start of endochondral ossification with a structural layout. This made it difficult to adapt the techniques currently applied in programmed cell death studies and limited the approach to morphology alone. Nevertheless, the regular geometry of the growth plate favoured the ultrastructural study ‘in vivo’ of the hypertrophic chondrocyte transformations and allowed us to clarify the connections with the related phenomena calcification and endochondral ossification. The regular and flat and transverse layout of the rabbit proximal tibia growth plate provided an optimal model for the morphological approach to the chondrocyte ‘fate’ study, because it allowed the orientation and sufficiently careful topography of hemi‐thin and thin cross‐sections, as required for more accurate morphometry, to be validated by the higher resolution of ultrastructural morphology. In this paper, the term ‘hypertrophic’ currently used for chondrocytes was maintained, but it was certainly misleading because in the specific context it represented the cell volume increase that did not correspond to an increase in biosynthesis.
Early studies using transmission microscopy did not clarify the question of the ‘fate’ of hypertrophic chondrocytes (Cameron, 1963; Buckwalter et al. 1986; Farnum & Wilsman, 1989a,b), whereas more recent ultrastructural data indicated that these cells underwent apoptosis, to then be engulfed by chondroclasts and endothelial cells (Lewinson & Silberman, 1992), or at least showed a variant of apoptotic cells, indicated by the term ‘chondroptosis’ (Roach et al. 2004; Almonte‐Becerril et al. 2010). On the basis of immunocytochemical characterization in vitro (Roach, 1992; Gentili et al. 1993; Roach & Erenpreisa, 1996; Erenpreisa & Roach, 1996; Bianco et al. 1988) and more recent genetic/lineage tracing studies, the hypothesis has been advanced of hypertrophic chondrocyte survival and transformation into osteoblast (trans‐differentiation) (Yang et al. 2014; Zhou et al. 2014; Tsang et al. 2015), with recorded estimated trans‐differentiation of up to 60% of all mature osteogenic cells in 1‐month‐old mice (Zhou et al. 2014). These conclusions rested on the identification and counting of chondrocyte‐derived osteogenic cells and were achieved through labelling with fluorescent markers at a magnification of 20× or less, and no structural detail and reliable morphology of the transformation were given that could be associated with the fluorescent cell identification.
In this study, the TEM ultrastructure of hypertrophic chondrocytes did not provide evidence in the expanded cytoplasm of mitochondria, ribosomes, endoplasmic reticulum or Golgi apparatus (basic conditions for cell metabolic activity, but also for survival). Furthermore, these were associated first with fragmentation and then with disappearance of the nuclear chromatin. These findings corresponded to the apoptotic features of nuclear break‐down and membrane blebbing reported in studies of apoptotic cultured cells. DNA cleavage, chromatin condensation and cell shrinkage were not observed, suggesting a different type of cellular apoptosis starting with cytoplasmic swelling, incompatible with an increase in biosynthesis and leading at least to the complete destruction of the cell structure. The particular environmental conditions in the growth plate can explain the differences compared with the other models of apoptosis studied. The morphological and ultrastructural analysis carried out in this study also suggested consideration of the ‘secondary necrosis’ hypothesis of hypertrophic chondrocytes, because when the cartilage matrix calcifies around the chondrocyte, it strongly inhibits cell metabolic exchanges. In the same calcified environment, osteocytes can survive because of the well developed canalicular network, which provides connections for the metabolic exchange between the cell and the interstitial fluid circulation (Pazzaglia & Congiu, 2013). Furthermore, this hypothesis indicates ‘the level’ at which hypertrophic chondrocytes are no longer alive, i.e. between the mineral deposition and the vascular invasion line.
There is a clear relationship between the chondrocyte maturation cycle and mineral deposition on the intercolumnar septa matrix. Different mechanisms of cartilage matrix calcification induction have been suggested (Mwale et al. 2002; Bonucci, 2007). However, the ultrastructural evidence of hypertrophic chondrocyte apoptosis and the environmental conditions of the growth plate in the layer between the mineral deposition and vascular invasion line are consistent with the hypothesis of the passage of free cartilage matrix water into the swelling cells (Pazzaglia et al. 2016). On the basis of morphological data, this hypothesis was supported by the reduction in matrix interfibrillar spaces and by the absence of any evidence of organic content (biosynthetic product) in the lacunae of the hypertrophic cells. The passage of water can be explained by osmotic equilibrium between the matrix surrounding the cell and the hypertrophic chondrocyte (Maroudas, 1976; Maroudas & Schneiderman, 1987; Maroudas et al. 1991) and does not require active transport through the membrane of the apoptotic cell. This results in the concentration of Ca and PO4 ions in the matrix, reaching the critical threshold for mineral precipitation. The question could arise why calcification did not occur in the transverse septa dividing the stacked, hypertrophic chondrocyte as highlighted by this study: one explanation could be that the extreme thinness and the low mass of these septa made the ion concentration mechanism ineffective at these sites.
Below the vascular invasion line (level 0–70 μm), the ultrastructural morphology shown in this paper documented degenerated material derived from the hypertrophic chondrocytes which can trigger the macrophagic reaction. The mixed cell pool at this level certainly included progenitor cells of both the haemopoietic and osteoblastic lineage; however, the macrophagic population was of higher density. The first differentiated osteoblasts which could be recognized with the applied morphological techniques were observed from about 70 μm below the vascular invasion line. The absence of osteoclasts at the top of the vascular invasion zone was consistent with the function of these cells, which was expressed at a lower level (about 150 μm below the vascular invasion line) where the secondary metaphyseal trabeculae remodelling occurs (Schenk et al. 1973; Pazzaglia et al. 1993) and was confirmed by this study. To the best of our knowledge, the observations of macrophages, their number and position at the top of the vascular cones and around the ‘HC ghosts’ of degenerated material have not been presented so far and they complete the knowledge of the hypertrophic chondrocyte cycle in the growth plate of vertebrates.
Considering that a consistency of over 60% of hypertrophic chondrocyte‐derived osteoblasts has been stated (Yang et al. 2014; Zhou et al. 2014), we should expect to find a trace of a phenotypic transformation at the site where trans‐differentiation occurs, namely in the band of tissue corresponding to the vascular invasion line examined in this study. On the basis of the morphometric data, relevant changes are needed to balance the documented difference: (1) the size of surviving hypertrophic chondrocytes should shrink by about 10 times (size of osteoblast between 10 and 20 μm) and (2) the mismatch between the number and density of hypertrophic chondrocytes and trans‐differentiated osteoblasts implies a high number of mitoses close to the vascular invasion line. No evidence of the latter transformations was found in this study, nor, to the best of our knowledge, has such evidence been reported before. Moreover, the evidence of chondrocyte‐derived traces below the vascular invasion line (advanced by the genetic mediated lineage tracing studies) did not consider that parts or unstructured substance of the apoptotic chondrocytes were still present until cleared by the macrophages and that these could account for the positive fluorescent labelling revealed by the studies of Zhou et al. (2014) and Yang et al. (2014).
On a morphological and ultrastructural basis, the zonal distribution and density of hypertrophic chondrocytes, macrophages and osteoblasts were consistent with a committed function for each of them in the general layout of the growth plate, which can be summarized in the following points: hypertrophic (swollen) chondrocytes for the control of mineral deposition on intercolumnar septa cartilage matrix; macrophages for the enzymatic digestion and clearance of the necrotic cell remains; osteoblasts for building the primary and secondary metaphyseal trabeculae. In conclusion, the hypothesis of chondrocyte‐osteoblast trans‐differentiation was not confirmed by this ultrastructural and morphometric study.
Conflict of interests
None of the authors had any conflict of interests.
Acknowledgements
The study was carried out using SEM and TEM microscopes from the University of Insubria and the light microscopy facilities at the University of Brescia, thanks to a scientific research agreement between the two Universities. The study was supported by current research funds of DSMC of the University of Brescia. The senior author is a retired professor of Orthopaedic Surgery from the University of Brescia. The authors acknowledge the contribution of the Committee of the Mario Boni Foundation of Pavia and the valuable support of Francesca Pagani (Biol. Dr. at University of Milan) in statistical analysis and criticism at all stages of the drafting this paper. The two anonymous reviewers are greatly appreciated for their valuable comments and suggestions in the revision of the manuscript.
References
- Almonte‐Becerril M, Navarro‐Garcia F, Gonzalez‐Robles A, et al. (2010) Cell death of chondrocytes is a combination between apoptosis and autophagy during the pathogenesis of osteoarthritis within experimental model. Apoptosis 15, 631–638. [DOI] [PubMed] [Google Scholar]
- Anderson CE, Parker J (1966) Invasion and resorption in enchondral ossification. An electron microscopic study. J Bone Joint Surg Am 48, 899–914. [PubMed] [Google Scholar]
- Bentley G, Greer RB (1970) The fate of chondrocytes in endochondral ossification. J Bone Joint Surg Br 52, 517–7. [PubMed] [Google Scholar]
- Bianco P, Cancedda FD, Riminucci M, et al. (1988) Bone formation via cartilage models: the ‘borderline’ chondrocyte. Matrix Biol 17, 185–192. [DOI] [PubMed] [Google Scholar]
- Bland JM, Altman DG (2010) Statistical methods for assessing agreement between two methods of clinical measurement. Int J Nurs Stud 47, 931–936. [PubMed] [Google Scholar]
- Bonucci E (2007) Biological Calcification, pp. 261–301. Berlin: Springer–Verlag. [Google Scholar]
- Brachet A (1893) Etude sur la resorption des cartilages e le developement des os long chez les oiseaux. Int Monatschr Anat Physiol 10, 391–417. [Google Scholar]
- Brookes M, Landon DN (1964) The juxta‐epiphyseal vessels in the long bones of foetal rats. J Bone Joint Surg Br 46, 336–345. [PubMed] [Google Scholar]
- Buckwalter JA, Mower D, Ungar R, et al. (1986) Morphometric analysis of chondrocyte hypertrophy. J Bone Joint Surg Am 68, 243–255. [PubMed] [Google Scholar]
- Burattini S, Ferri P, Battistelli M, et al. (2009) Apoptotic DNA fragmentation can be revealed in situ: an ultrastructural approach. Microsc Res Tech 72, 913–923. [DOI] [PubMed] [Google Scholar]
- Cameron DA (1963) The fine structure of bone and calcified cartilage. A critical review of the contribution of electron microscopy to the understanding of osteogenesis. Clin Orthop Rel Res 26, 199–228. [PubMed] [Google Scholar]
- Crelin ES, Koch WE (1967) An autoradiographic study of chondrocyte transformation into chondroclasts and osteocytes during bone formation in vitro. Anat Rec 158, 473–483. [DOI] [PubMed] [Google Scholar]
- Descalzi Cancedda F, Gentilini C, Manduca P, et al. (1992) Hypertrophic chondrocytes undergo further differentiation in culture. J Cell Biol 117, 427–435. [DOI] [PMC free article] [PubMed] [Google Scholar]
- Erenpreisa J, Roach HI (1996) Epigenetic selection as a possible component of transdifferentiation. Further study on the commitment of hypertrophic chondrocyte to become osteocytes. Mech Ageing Dev 87, 165–182. [DOI] [PubMed] [Google Scholar]
- Farnum CE, Wilsman NJ (1989a) Condensation of hypertrophic chondrocytes at the chondro‐osseous junction of growth plate cartilage in Yucatan swine: relationship to long bone growth. Am J Anat 186, 346–358. [DOI] [PubMed] [Google Scholar]
- Farnum CA, Wilsman NJ (1989b) Cellular turnover at the chondro‐osseous junction of growth plate cartilage: analysis by serial sections at the light microscopical level. J Orthop Res 7, 654–666. [DOI] [PubMed] [Google Scholar]
- Gentili C, Bianco P, Neri M, et al. (1993) Cell proliferation, extracellular matrix mineralization and ovotransferrin transient expression during in vitro differentiation of chick hypertrophic chondrocytes into osteoblastic-like cells. J Cell Biol 122, 703–12. [DOI] [PMC free article] [PubMed] [Google Scholar]
- Ishizeki K, Takigawa M, Nawa T, et al. (1996) Mouse Meckel's cartilage chondrocytes evoke bone‐like matrix and further transform into osteocyte‐like cells in culture. Anat Rec 245, 25–35. [DOI] [PubMed] [Google Scholar]
- Kember NF (1960) Cell division in endochondral ossification. A study of cell proliferation in rat bones by the method of tritiated thymidine autoradiography. J Bone Joint Surg Br 42B, 824–839. [PubMed] [Google Scholar]
- Kumar V, Abbas AK, Aster JC, et al.. (2017) Robbins and Cotram Pathological Basis of Disease, 9th ed. Elsevier. ISBN: 978-1-4557-2613-4. [Google Scholar]
- Lewinson D, Silberman M (1992) Chondroclasts and endothelial cells collaborate in the process of cartilage resorpion. Anat Rec 233, 504–514. [DOI] [PubMed] [Google Scholar]
- Lucchetti F, Mannello F, Canonico B, et al. (2004) Integrin and cytoskeleton behaviour in human neuroblastoma cell during hyperthermia‐related apoptosis. Apoptosis 9, 635–648. [DOI] [PubMed] [Google Scholar]
- Maroudas A (1976) Transport of solutes through cartilage: permeability to large molecules. J Anat 122, 335–347. [PMC free article] [PubMed] [Google Scholar]
- Maroudas A, Schneiderman R (1987) ‘Free’ and ‘exchangeable’ or ‘trapped’ and ‘non‐exchangeble’ water in cartilage. J Orthop Res 5, 133–138. [DOI] [PubMed] [Google Scholar]
- Maroudas A, Wachtel E, Grushko G, et al. (1991) The effect of osmotic and mechanical pressure on water portioning in articular cartilage. Biochim Biophys Acta 1073, 285–294. [DOI] [PubMed] [Google Scholar]
- Morgan JD (1959) Blood supply of growing rabbit's tibia. J Bone Joint Surg Br 41B, 185–203. [DOI] [PubMed] [Google Scholar]
- Mwale F, Tchetina E, Wu CW, et al. (2002) The assembling and remodelling of the extracellular matrix in the growth plate cartilage in relationship to mineral deposition and cellular hypertrophy: an in situ study of collagens II and IX and proteoglycan. J Bone Min Res 17, 275–283. [DOI] [PubMed] [Google Scholar]
- Pazzaglia UE, Congiu T (2013) The cast imaging of the osteon lacunar canalicular system and the implications with functional models of intracanalicular flow. J Anat 222, 193–202. [DOI] [PMC free article] [PubMed] [Google Scholar]
- Pazzaglia UE, Zatti G, Di Nucci A, et al. (1993) Experimental model in vivo for quantitative assessment of bone resorption inhibition. J Orthop Res 11, 892–896. [DOI] [PubMed] [Google Scholar]
- Pazzaglia UE, Congiu T, Sibilia V, et al. (2016) Relationship between chondrocyte maturation cycle and the endochondral ossification in the diaphyseal and epiphyseal ossification centers. J Morphol 277, 1187–1198. [DOI] [PubMed] [Google Scholar]
- Roach HI (1992) Trans‐differentiation of hypertrophic chondrocytes into cells capable of producing a mineralized bone matrix. Bone Miner 19, 1–20. [DOI] [PubMed] [Google Scholar]
- Roach HI, Erenpreisa J (1996) The phenotypic switch from chondrocytes to bone‐forming cells involves asymmetric cell division and apoptosis. Connect Tissue Res 35, 85–91. [DOI] [PubMed] [Google Scholar]
- Roach HI, Aigner T, Kouri JB (2004) Chondroptosis: a variant of apoptotic cell death in chondrocytes? Apoptosis 9, 265–277. [DOI] [PubMed] [Google Scholar]
- Salucci S, Battistellin M, Burattini S, et al. (2010) C2 C12 myoblast sensitivity to different apoptotic chemical triggers. Micron 41, 966–973. [DOI] [PubMed] [Google Scholar]
- Schenk RK, Wiener J, Spiro D (1968) Fine structural aspects of vascular invasion of the tibial epiphyseal plate of growing rats. Acta Anat 69, 1–17. [DOI] [PubMed] [Google Scholar]
- Schenk R, Merz WA, Muhlbauer R, et al. (1973) Effect of ethane‐1‐hydroxy‐1,1‐diphosphonate (EHDP) and dichloromethylene diphosphonate (Cl2MDP) on the calcification and resorption of cartilage and bone in the tibial epiphysis and metaphysic of rats. Calcif Tissue Res 11, 196–214. [DOI] [PubMed] [Google Scholar]
- Schneider CA, Rasband WS, Eliceiri KW (2012) NIH Image to ImageJ: 25 years of image analysis. Nat Methods 9, 671–675. [DOI] [PMC free article] [PubMed] [Google Scholar]
- Shoeney L (1876) Uber den Ossificationsprocesses bei Vogel und die Neubildung von Rothen Blutkoerperchen an der Ossificationgrenze. Arch Mikroskop Anat 12, 243–254. [Google Scholar]
- Stanka P, Bellack U, Lindner A (1991) On the morphology of the terminal microvasculature during endochondral ossification in rats. Bone Miner 13, 93–101. [DOI] [PubMed] [Google Scholar]
- Trueta J, Little K (1960) The vascular contribution to osteogenesis. II. Studies with the electron microscope. J Bone Joint Surg Br 42B, 367–376. [DOI] [PubMed] [Google Scholar]
- Trueta J, Morgan JD (1960) The vascular contribution to osteogenesis. I. Studies by the injection method. J Bone Joint Surg Br 42B, 97–109. [DOI] [PubMed] [Google Scholar]
- Tsang KY, Chan D, Cheah KS (2015) Fate of growth plate hypertrophic chondrocyte: death or lineage extension? Dev Growth Differ 57, 179–192. [DOI] [PubMed] [Google Scholar]
- Van der Stricht O (1890) Recherches sur le cartilage articulaire des oiseaux. Arch Biol 10, 1–41. [Google Scholar]
- Willie AH (1987) Apoptosis: cell death in tissue regulation. J Pathol 153, 313–316. [DOI] [PubMed] [Google Scholar]
- Willie AH, Kerr JF, Currie AR (1980) Cell death: the significance of apoptosis. Int Rev Cytol 68, 251–306. [DOI] [PubMed] [Google Scholar]
- Yang L, Tsang KY, Tang HC, et al. (2014) Hypertrophic chondrocytes can become osteoblasts and osteocytes in endochondral bone formation. PNAS 111, 12097–12102. [DOI] [PMC free article] [PubMed] [Google Scholar]
- Zhou X, von der Mark K, Henry S, et al. (2014) Chondrocytes transdifferentiate in osteoblasts in endochondral bone during development, postnatal growth and fracture healing in mice. PLoS Genet 10, 1–20. [DOI] [PMC free article] [PubMed] [Google Scholar]


