

Abstract
CCN2 is best known as a promoter of chondrocyte differentiation among the CCN family members, and its null mice display skeletal dysmorphisms. However, little is known concerning roles of the other CCN members in chondrocytes. Using both in vivo and in vitro approaches, we conducted a comparative analysis of CCN2‐null and wildtype mice to study the roles of CCN2 and the other CCN proteins in cartilage development. Immunohistochemistry was used to evaluate the localization of CCN proteins and other chondrocyte‐associated molecules in the two types of mice. Moreover, gene expression levels and the effects of exogenous CCN proteins on chondrocyte proliferation, differentiation, and the expression of chondrocyte‐associated genes in their primary chondrocytes were evaluated. Ccn3 was dramatically upregulated in CCN2‐null cartilage and chondrocytes. This upregulation was associated with diminished cell proliferation and delayed differentiation. Consistent with the in vivo findings, CCN2 deletion entirely retarded chondrocyte terminal differentiation and decreased the expression of several chondrocyte‐associated genes in vitro, whereas Ccn3 expression drastically increased. In contrast, the addition of exogenous CCN2 promoted differentiation strongly and induced the expression of the associated genes, whereas decreasing the Ccn3 expression. These findings collectively indicate that CCN2 induces chondrocyte differentiation by regulating the expression of chondrocyte‐associated genes but that these effects are counteracted by CCN3. The lack of CCN2 caused upregulation of CCN3 in CCN2‐null mice, which resulted in the observed phenotypes, such as the resultant delay of terminal differentiation. The involvement of the PTHrP‐Ihh loop in the regulation of CCN3 expression is also suggested.
Keywords: CCN2/connective tissue growth factor, CCN3/nephroblastoma overexpressed, CCN family, mutant, chondrocyte differentiation
INTRODUCTION
Endochondral bone formation involves highly organized steps. Several molecules controlling endochondral bone formation have been defined, such as PTH, PTH‐related protein (PTHrP), Indian hedgehog (Ihh),3, 4 and bone morphogenetic proteins (BMPs). However, the detailed characterization of the genetic control of endochondral bone formation remains to be elucidated.
CCN2/connective tissue growth factor (CTGF) is composed of four modules that interact with a variety of molecules such as growth factors, extracellular matrix (ECM) components, and membrane receptors in a way that can result in modifying their actions, suggesting that this factor acts, so to say, as a “signal conductor” in the microenvironment. CCN2 is one of the important factors expressed during endochondral bone formation.6, 7, 8, 9, 10 Our previous studies have shown the critical roles of CCN2 throughout this process.6, 11, 12, 13, 14, 15, 16 CCN2 is a member of the CCN (CCN1/Cyr61, CCN2/CTGF,6, 7, 8, 9, 10, 11, 12, 13, 14, 15, 16, 18 and CCN3/NOV ) family, which also includes CCN4/WISP1/Elm1, CCN5/WISP2/rCop‐1, and CCN6/WISP3.20, 21, 22 These members share a high degree of structural homology, thus suggesting that they may have similar or redundant functions. In addition, members such as CCN1, CCN3, CCN4, and CCN6 have been occasionally detected in chondrocytes,22, 23, 24, 25, 26 thus suggesting the contribution of the entire CCN family to the process of cartilage formation in vivo. In this study, to further characterize the comprehensive roles of CCN family members, we comparatively analyzed the gene expression and protein production patterns of them in the developing cartilage and in chondrocytes isolated from CCN2‐null (CCN2‐KO) versus those in wildtype (WT) mice. Among the CCN proteins, CCN3, a powerful suppressor of cell proliferation,27, 28 has been reported to be downregulated by PTHrP, an essential regulator of endochondral bone formation.3, 4 Therefore, particular attention was focused on CCN2 and CCN3 in this study. As a result, the critical and differential involvement of these CCN family proteins during chondrocyte differentiation was shown.
MATERIALS AND METHODS
Mice and tissue preparation
The CCN2‐KO mice used in this study were previously described. Hind limbs removed at embryonic day (E)14.5–E18.5 were fixed with 4% paraformaldehyde (PFA) in 0.1 M PB (pH 7.4) for 24 h. The samples were decalcified with 10% EDTA for 3–7 days, depending on their age before embedment in paraffin. Paraffin sections, after immunostaining and/or staining with HE, Masson‐Goldner, or Safranin‐O staining, were examined under a Microphoto FXA light microscope equipped with a DXM1200 digital camera (Nikon, Kawasaki, Japan). All animal experiments in this study were conducted according to the Guidelines for Animal Research of the Okayama University and were approved by the animal committee.
Antibodies
The mouse monoclonal antibody against human proliferating cell nuclear antigen (PCNA) was purchased from DAKO. Rabbit polyclonal antibody against human type II collagen was purchased from Chemicon International and that against rat type X collagen from LSL Co. (Tokyo, Japan). For the specific detection, of the six CCN family proteins, we collected 27 different antibodies, some of which were described previously,29, 30 and the others were purchased from Abcam, Santa Cruz Biotechnology, and Gene Teqand R&D. All of them were evaluated for specificity by Western blotting, using recombinant human CCN proteins described below. Eventually, we selected six antibodies that did not cross‐react with the other CCN proteins: SC‐13100 (lot. J2105) for CCN1 (Santa Cruz), SC‐ab6992‐50 (lot. 314202) for CCN2 (Abcam), K‐19M for CCN3, SC‐25441 (lot. B2806) for CCN4, SC‐25442 (lot. K0805) for CCN5, and SC‐25443 (lot. A2604) for CCN6 (Santa Cruz). Rabbit polyclonal antibody against human PTHrP, goat polyclonal antibody against human Ihh, and mouse monoclonal antibody against human PTH/PTHrP receptor were also purchased from Santa Cruz.
Recombinant CCN proteins
Recombinant human CCN2 (rCCN2) and CCN3 (rCCN3) were prepared as described previously.12, 16, 31 Apart from these recombinant CCNs (rCCNs), all of the CCN members were commercially obtained. Bacterially derived rCCN1, 3, 4, 5, and 6 were purchased from PeproTech EC (London, UK). The remaining bacterially derived one, rCCN2, was purchased from Bio Vender Laboratory (Heidelberg, Germany). These rCCNs were diluted with 0.1% BSA‐PBS to a concentration of 50 μg/ml for use as stock solutions.
Cell isolation and culture condition
Primary murine chondrocytes were isolated from rib cartilage at E18.5 by digestion with 0.1% collagenase A (Roche) for 4 h after complete elimination of contaminating soft tissues by preliminary digestion with 0.25% trypsin for 30 min at 37°C. Chondrocytes were inoculated into culture dishes or plates (Greiner) in α‐MEM (Sigma) supplemented with 10% FBS (Invitrogen). All of these chondrocytes were used fresh in primary cultures without undergoing any further passage to avoid possible dedifferentiation.
RNA extraction and reverse transcription
Total cellular RNA was isolated from primary chondrocytes at confluence in culture derived from CCN2‐KO or WT mice by using an RNeasy Mini Kit according to the manufacturer's instructions (Qiagen, Hilden, Germany). Chondrocytes from both types of mice were inoculated at a density of 1 × 10⁵/dish into 3.5‐cm culture dishes and were grown to confluence. WT chondrocytes reached confluence on day 6 or 7, whereas CCN2‐KO chondrocytes took ∼2 more days to reach it. RNA samples from eight WT and eight CCN2‐KO littermates were examined.
Total RNA was also extracted from WT and CCN2‐KO rib cartilage of embryos at E14.5, E16.5, and E18.5. The samples were processed with a FastRNA Pro Green Kit (Qbiogene, Irvine, CA, USA) and FastPrep 24 Instrument (MP Biomedicals, Solon, OH, USA) according to the manufacturer's protocol. Thereafter, extracted total RNA was purified with an RNeasy Mini Kit (Qiagen). RNA samples from four WT and four CCN2‐KO littermates were examined.
For the long‐term culture experiment, chondrocytes from either type of mice were inoculated at a density of 1 × 10⁵/dish into 3.5‐cm culture dishes and then grown to confluence. At confluence, the initial RNA sample was prepared; and, thereafter, cells were processed every 7 days. RNA samples from chondrocytes from four WT and four CCN2‐KO littermates were examined.
For the evaluation of the effects of exogenous rCCN2 and rCCN3 on the expression of chondrocyte‐associated genes, WT or CCN2‐KO chondrocytes seeded at a density of 2.5 × 10⁵/ 3.5‐cm dish were grown to confluence, requiring 3 or 4 days. Thereafter, the cells were maintained for 24 h in α‐MEM containing 0.5% FBS before treatment and were further incubated for 6, 12, 24, or 48 h in the same medium containing 50 ng/ml of rCCNs or an equal volume of 0.1% BSA‐PBS. RNA samples from eight WT and eight CCN2‐KO littermates were examined.
Quantitative real‐time PCR
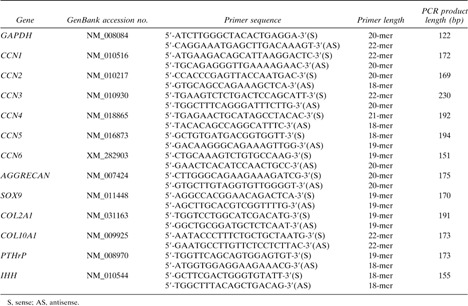
One microgram of total RNA of each sample was reverse‐transcribed with avian myeloblastosis virus (AMV) reverse transcriptase (Takara Bio, Otsu, Japan) at 42°C for 30 min. Thereafter, real‐time PCR was performed as described earlier. Sequences of primer sets are shown in Table 1.
Table Table 1.
primers used for real‐time rt‐pcr experiments
|
|
Western blotting
Chondrocytes were seeded at a density of 1 × 10⁵/dish in 3.5‐cm dishes. Total cellular proteins were prepared by lysing cells in CelLytic‐M lysis reagent (Sigma) at confluence. Thirty micrograms of the proteins were separated by SDS‐PAGE using a 12.5% polyacrylamide gel, and the proteins were subsequently transferred onto a PVDF membrane (Bio‐Rad). Nonspecific binding was blocked by incubating the membrane in Casein Buffer (Vector Laboratories) for 1 h at room temperature, after which it was incubated overnight at 4°C with a primary antibody specific for each CCN member at the supplier's recommended concentration. The membrane was washed with TBS containing 0.1% Tween 20 (TBS‐T) and further incubated with a biotinylated secondary antibody and then with Avidin‐Biotin Complexes (Vectastain Elite ABC kit; Vector). The signal was developed using an enhanced chemiluminescence (ECL) kit (GE Healthcare).
Immunohistochemistry
Paraffin‐embedded sections were processed for immunohistochemistry for PCNA, CCN family members, PTHrP, PTH/PTHrP receptor, and Ihh. Deparaffined sections were immersed in methanol containing 0.3% H2O2 for 30 min to block endogenous peroxidase activity. For antigen activation, they were immersed in Antigen Retrieval Reagent (DAKO) and microwaved for 30 s in a 700‐W microwave oven twice. For the detection of collagens, enzymatic digestion with 0.1% pepsin (Sigma) was performed at 37°C for 30 min. To reduce nonspecific binding, Histofine Blocking Reagent (Nichirei Bioscience, Tokyo, Japan) was applied to the sections for 60 min. They were incubated with the primary antibodies described above in blocking reagent at the suppliers recommended concentration at 4°C overnight. Positive signals were visualized by using a Histofine Mouse Stain Kit (for mouse primary antibodies), Histofine Simple Stain Mouse MAX‐PO(R) (for rabbit primary antibodies), or Histofine Simple Stain Mouse MAX‐PO(G) (for goat primary antibodies), all from the same vender (Nichirei Bioscience), and 3,3‐diaminobenzidine tetrachloride (DAB: Sigma). Finally, the sections were counterstained with methyl green.
Alizarin red staining
Chondrocytes in 3.5‐cm dishes were grown to confluence, requiring ∼7 days. They were fixed with 4% PFA‐PBS for 10 min. After several washes with PBS, the samples were stained with Alizarin Red S solution (Sigma) for 30 min at room temperature. Both WT and CCN2‐KO chondrocytes were further cultured for 35 days, with some cultures being fixed every 7 days and then stained with the dye. The images were captured by using a CanoScan D 2400U digital camera (Canon, Tokyo, Japan).
Cell proliferation assay
For the evaluation of cell proliferation, the 3‐[4,5‐dimethylthiazol‐2‐yl]‐2,5‐diphenyltetrazolium (MTT) method was used. In this study, 2 days after chondrocytes had been seeded into 48‐well plates at a density of 2 × 10⁴/well, the concentration of FBS in the medium was reduced to 0.5%; and the cells were preincubated for 24 h and further incubated for 24 h in the same medium containing 50 ng/ml of a given rCCN or an equal volume of 0.1% BSA‐PBS. Thereafter, the lysates were analyzed as previously described.
Evaluation of proteoglycan synthesis
Chondrocytes were seeded at a density of 5 × 10⁴/well and grown to confluence in 48‐well plates, which required 3 days. The cells were preincubated in α‐MEM containing 0.5% FBS for 24 h and further incubated in the same medium with 50 ng/ml of rCCN2 and/or rCCN3 or an equal volume of 0.1% BSA‐PBS for 5 h. Next, [35S] sulfate was added to the cultures at a final concentration of 370 kBq/ml, and incubation was continued for another 17 h. The radioactivity in the proteoglycan fraction in both the cell layer and culture medium was measured according to a previously described procedure.
Maturation and matrix calcification assay
The WT chondrocytes were seeded at a density of 2 × 10⁴/well and grown in 48‐well plates for 7 days to reach confluence. Next, the concentration of FBS was reduced to 5% with 50 ng/ml of each rCCN or an equal volume of 0.1% BSA‐PBS, 50 μg/ml ascorbic acid was added, and the cells were further cultured for 10 days, with the medium being replaced every 3 days. One day after the fourth medium change, the cells were fixed. Samples were stained with Alizarin Red S solution or Alcian Blue solution (pH 2.5; Nakarai Tesque, Kyoto, Japan) for 30 min. Macroscopic images were captured, and the alizarin red–stained matrix was extracted with 200 μl/well of CelLytic‐M lysis reagent for the measurement at a wave length of 492 nm. The Alcian blue–stained proteoglycan was extracted with 200 μl/well of 6 M guanidine‐HCl and measured at a wave length of 620 nm.
Small interfering RNA and RNA transfection
To knockdown Ccn3 expression, we used an RNA interference method. The small interfering RNA (siRNA) directed against mouse Ccn3 (S70714) were designed and purchased from Ambion. The nucleotide sequences were 5′‐CAAGAGCCCGAGGAAGUAAtt‐3′ (sense), and 5′‐UUACUUCCUCGGGCUCUUGtt‐3′ (antisense). Nonsilencing oligonucleotide (4390843) was also purchased from Ambion and used. Chondrocytes from WT and CCN2‐KO mice were plated at 3.0 × 10⁵ in 3.5‐cm culture dishes containing DMEM supplemented with 10% FBS. At 24 h after seeding, the cells were treated with 0.1% collagenase A (Roshe) and 0.1 U/ml chondroitinase (Sigma) at 37°C for 30 min for WT or with 0.05% collagenase A and 0.05 U/ml chondroitinase at 37°C for 20 min for CCN2‐KO. Thereafter, the FBS concentration was reduced to 5%; cells were transfected with siRNA (75 nM) with the aid of RNAiFect transfection reagent (Qiagen) used according to the manufacturer's instructions. Forty‐eight hours after transfection, total cellular RNA was harvested and evaluated for the expression of chondrocyte‐associated genes. RNA samples from four WT and four CCN2‐KO littermates were examined.
Statistical analysis
Unless otherwise specified, all experiments were repeated at least twice, and similar results were obtained. The data were analyzed by using GraphPad Prism Software with the Mann‐Whitney's U test. All p values were obtained from two‐sided tests, and p < 0.05 was considered statistically significant.
RESULTS
To analyze the morphological differences between WT and CCN2‐KO mice in detail, we compared histological findings to evaluate the integrity of cartilage ECM components. The hypertrophic zone in the CCN2‐KO tibia at E18.5 appeared enlarged (black bidirectional arrows in Figs. 1A and 1B). In contrast, Masson‐Goldner staining showed that the ossified area in the CCN2‐KO tibia was shorter than that in the WT one (Figs. 1C and 1D). No conspicuous difference in the total length existed between WT and CCN2‐KO at E18.5. A previous study reported that proteoglycan levels were apparently normal in the CCN2‐KO tibia at P0. However, because another study showed that the mRNA level of Aggrecan was prominent at E13.5 and decreased as gestation continued, we found it appropriate to study the effect of Ccn2 deletion on proteoglycan synthesis by examining mice around E14. Safranin‐O staining showed a lower level of proteoglycan in CCN2‐KO mice than in WT mice (Figs. 1E and 1F) at E14.5. The WT mice showed intense immunoreactivity for type II collagen throughout the cartilage matrix (Fig. 1G). In contrast, CCN2‐KO mice showed a remarkable faint immunoreaction (Fig. 1H). In the CCN2‐KO tibia, the intensity of the immunoreaction for type X collagen was also reduced significantly (Figs. 1I and 1J). Previous studies showed that CCN2 promotes chondrocyte proliferation in vitro.6, 12, 13, 14, 15 Therefore, immunostaining for PCNA was used to compare the proliferative activities between WT and CCN2‐KO chondrocytes. PCNA immunopositivity was found in the nuclei of almost all of the chondrocytes in the proliferating zone of E16.5 and E18.5 WT cartilage of tibias (Figs. 1K and 1M). However, in the E16.5 CCN2‐KO tibias, the immunoreaction was reduced (Figs. 1L and 1O). At E18.5, very few PCNA+ cells were recognizable in these tibias (Figs. 1N and 1O). There was no significant difference in the number of chondrocytes in both types of mice at E16.5. However, at E18.5, the number of chondrocytes present in the same area was markedly decreased in the CCN2‐KO mice (Fig. 1P), and the size of these cells appeared to be slightly larger.
Figure FIG. 1.
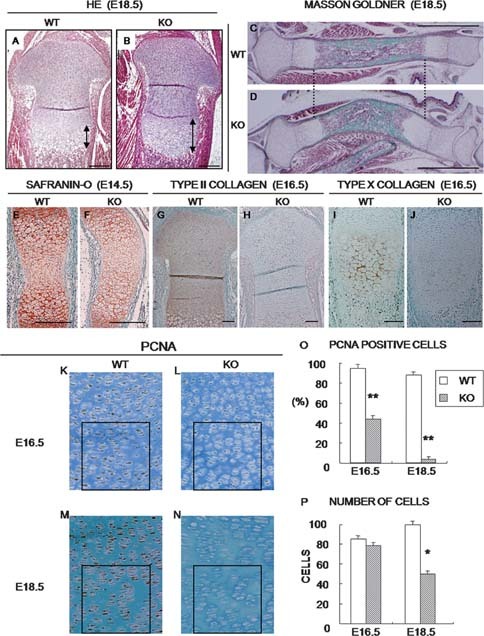
Histological examination and immunostaining for collagens and PCNA of WT and CCN2‐KO mice. (A and B) HE‐stained proximal end of tibias. (C and D) Masson Goldner–stained sections of tibias. (E and F) Safranin‐O–stained developing tibial growth plates. (G–N) Immunoreaction for type II and type X collagens and PCNA in the tibial growth plates. (O and P) Quantification of PCNA+ cells with values in the graphs expressed as percent positive cells and total number of cells in the same area. The cells in four adjacent sections (black boxes, 200 × 200‐μm area/section) were scored by an analyst blinded to the genotype. Data are the mean ± SE. *p < 0.05, **p < 0.001, significantly different from WT. Scale bar: 200 μm (A and B), 2 mm (C and D), and 100 μm (E–J).
By performing microarray analysis (mouse Panorama Micro Array; Sigma) of the RNA collected under the same conditions as used for the experiments whose results are shown in Figs. 2A–2D, we identified many genes that were either upregulated or downregulated in the CCN2‐KO chondrocytes in comparison with their expression in WT chondrocytes (data not shown). Among them, upregulated Ccn3 and downregulated Aggrecan genes were of particular interest. To confirm and expand these findings quantitatively, we subsequently evaluated the alterations in gene expression of the other Ccn family members including Ccn3 and chondrocyte‐specific genes in the CCN2‐KO mice by using quantitative real‐time PCR analysis. As a result, the mRNAs of all of the Ccn members were detectable in WT chondrocytes at confluence in regular cultures (Fig. 2A). Interestingly, CCN2 deletion caused upregulation of Ccn3 and downregulation of Ccn6 mRNA levels (Fig. 2B). In addition, the deletion also caused a significant reduction in the expression of Sox9, Aggrecan, and Col2a1 mRNAs (Fig. 2C). The more striking difference at the RNA level than was found in the qualitative immunostaining (Fig. 1) suggests the possible regulation of these genes at the translation level. There was no remarkable difference in the mRNA levels of other Ccn family members or Col10a1. The levels of CCN member proteins were also studied. The production of CCN3 protein increased and that of CCN6 protein decreased in the CCN2‐KO chondrocytes (Fig. 2D). No significant differences were observed in the other CCN members. In addition, we examined the localization pattern of CCN family proteins in cartilage. At E14.5, each member showed its own characteristic distribution pattern (Fig. 2E). The CCN1 immunopositive area was broadly discernible over the proliferating and prehypertrophic zones in the WT tibias. Immunoreactions for CCN2, 3, and 6 were found in the proliferating and prehypertrophic zones and in the region where angiogenesis would occur (black arrows in Fig. 2E). The hypertrophic zone had immunoreactivity for CCN4 and 5. In the CCN2‐KO mice, immunopositivities for CCN1, 4, 5, and 6 showed almost the same localization patterns as those in WT mice, despite the reduction in their immunointensity. Of note, CCN2‐KO mice exhibited a remarkable enlargement of their CCN3‐immunopositive area. Moreover, to further confirm the in vitro findings (Figs. 2A–2C), we directly extracted RNA from rib cartilage at several developmental stages and quantified the mRNA levels of the relevant genes. As shown in Figs. 2F–2I, the induction of Ccn3 and repression of Aggrecan, Col2a1, and Col10a1 genes were clearly observed, supporting the results obtained in vitro. Of note, strong expression of Aggrecan was detected at E14.5 in the rib cartilage and then decreased as gestation continued, where the effect of the CCN2 deletion was most evident at E14.5 (Fig. 2G). Interestingly, the expression level of Ccn3 in the CCN2‐KO rib cartilage showed a fluctuation pattern opposite to that for the WT (Fig. 2F).
Figure FIG. 2.
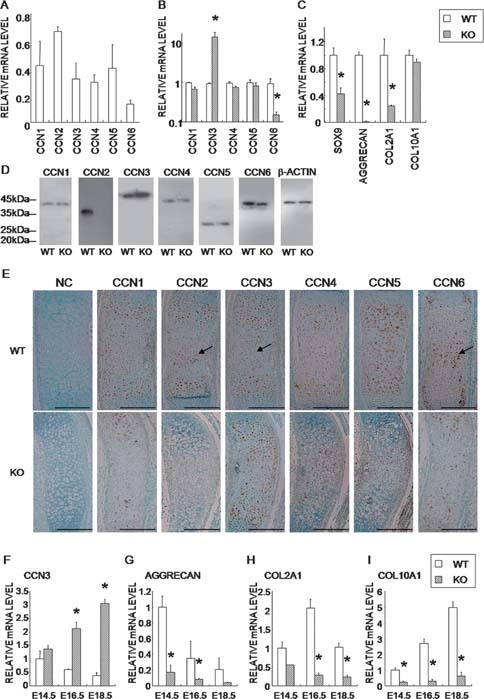
Effect of the CCN2 deletion on the expression of Ccn family members and chondrocyte marker genes in vitro and immunohistochemical localization of CCN family proteins in vivo. (A) The mRNA expression profile of Ccn family members in WT chondrocytes at confluence. (B) The mRNA expression profile of Ccn family members in CCN2‐KO chondrocytes vs. WT ones. Data from CCN2‐KO were standardized against the respective expression levels in WT. (C) Comparison of mRNA levels of chondrocyte marker genes; Sox9, Aggrecan, Col2a1, and Col10a1. Data are means ± SE of eight samples from eight littermates. (D) Western immunoblot analysis of the CCN proteins in WT vs. CCN2‐KO chondrocyte cell lysates. (E) Immunolocalization of each CCN member at E14.5. Negative control (NC) sections were incubated with 5 μg/ml of normal rabbit and goat antibodies. (F–I) The mRNA expression profile of Ccn3 and chondrocyte marker genes in CCN2‐KO cartilage from embryonic rib cage in comparison with that of WT. Data are means ± SE of four samples from each of four litter mates. *p < 0.05, significantly different from WT.
Next we performed alizarin red staining on primary cultures every 7 days after they had become confluent to evaluate calcification (Fig. 3A). On day 21, the calcification of CCN2‐KO chondrocytes was remarkably delayed, although there was no morphological difference at confluence between WT and CCN2‐KO cells. On day 42, the CCN2‐KO chondrocytes showed a drastic reduction in calcification. The changes over time in the mRNA expression of the Ccn family members and chondrocyte marker genes during terminal differentiation of WT and CCN2‐KO chondrocytes in vitro were also studied. The mRNA samples were collected every 7 days and evaluated for the gene expression. First of all, the gene expression profile of the marker genes firmly supports the proper differentiation of these chondrocytes in vitro. Ccn1, Ccn2, and Ccn6 mRNA levels reached their peak on day 28 in WT chondrocytes (Figs. 3B, 3C, and 3G). The Col2a1 mRNA level showed a pattern similar to that of these 3 Ccn members (Fig. 3I). In contrast, in CCN2‐KO chondrocytes, the onset of the increase in the Ccn1 mRNA level was delayed, and Ccn6 and Col2a1 mRNA levels did not increase significantly. In the WT chondrocytes, the expression of Ccn3 and Aggrecan mRNA levels reached its peak on day 21, whereas Ccn3 expression was remarkably enhanced and Aggrecan expression was entirely repressed in the CCN2‐KO chondrocytes (Figs. 3D and 3H). In addition, Ccn4 and Ccn5 mRNA levels increased from day 14 and continued to increase in WT chondrocytes, whereas CCN2‐KO chondrocytes did not show such a remarkable increase (Figs. 3E and 3F). The increase in the Col10a1 mRNA level was delayed in the CCN2‐KO chondrocytes (Fig. 3J).
Figure FIG. 3.
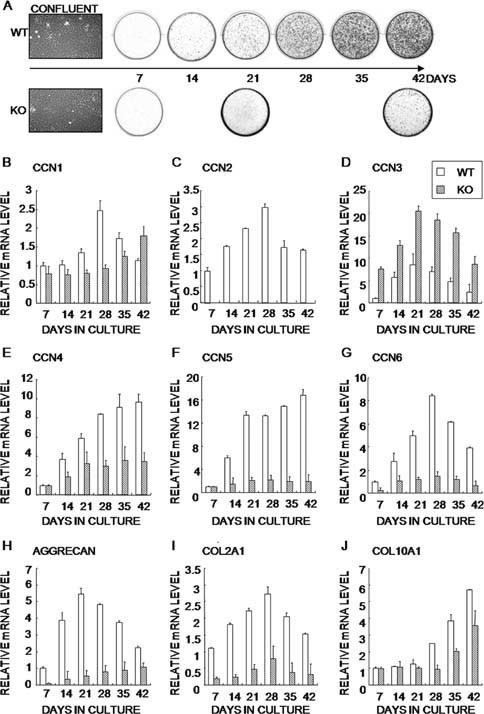
Time course of calcification and differential expression of Ccn family members and chondrocyte marker genes during terminal differentiation of WT and CCN2‐KO chondrocytes in vitro. (A) Phase‐contrast views at the initial confluence (day 7) and culture dishes showing mineral deposition by both types of chondrocytes during long‐term culture. (B–J) The gene‐expression profile during terminal differentiation. Data are mean ± SD of three independent determinations of triplicate examinations. Samples were collected from four WT and four CCN2‐KO mice from four litter mates for each type.
After a series of comprehensive analyses, we focused on two particular CCN members, CCN2 and CCN3. A previous study reported that rCCN2 promotes the proliferation of several types of chondrocytes.6, 12, 13, 14, 15 In contrast, CCN3 was reported to restrict the growth of other types of cells.6, 28 Therefore, the effect of these proteins on WT and CCN2‐KO chondrocytes was evaluated. Without the addition of an exogenous factor, the proliferative activity of CCN2‐KO chondrocytes was ∼40% less than that of WT chondrocytes (Fig. 4A). As expected, rCCN2 promoted the proliferative activity in both types of chondrocytes. The proliferative activity of the CCN2‐KO chondrocytes recovered to the WT level. In contrast, rCCN3 inhibited the proliferation of WT chondrocytes, whereas it had no effect on the proliferation of CCN2‐KO chondrocytes under this condition. Of note, rCCN3 did not counteract the rCCN2 activity toward the cell proliferation at the same concentration. The effects of rCCN2 and rCCN3 on proteoglycan synthesis in murine chondrocytes were also examined (Fig. 4B). Proteoglycan synthesis in CCN2‐KO chondrocytes was also ∼40% less than that of WT chondrocytes. As expected, rCCN2 induced proteoglycan synthesis in both WT and CCN2‐KO chondrocytes. In contrast, rCCN3 diminished the proteoglycan synthesis level of WT chondrocytes down to that of CCN2‐KO chondrocytes. Interestingly, rCCN3 exerted no inhibitory effect on the proteoglycan synthesis promoted by rCCN2 at the same concentration. Next, long‐term chondrocyte maturation and matrix calcification assays were performed (Figs. 4C–4E). The rCCN2 dramatically induced proteoglycan accumulation (positive for Alcian blue staining) and calcification (positive for alizarin red staining). However, rCCN3 significantly inhibited both maturation and calcification. Phase‐contrast images showed numerous developing cartilage nodules in the presence of rCCN2. In contrast, rCCN3 significantly repressed the formation of nodules, although it did not inhibit rCCN2 activity at the same concentration.
Figure FIG. 4.
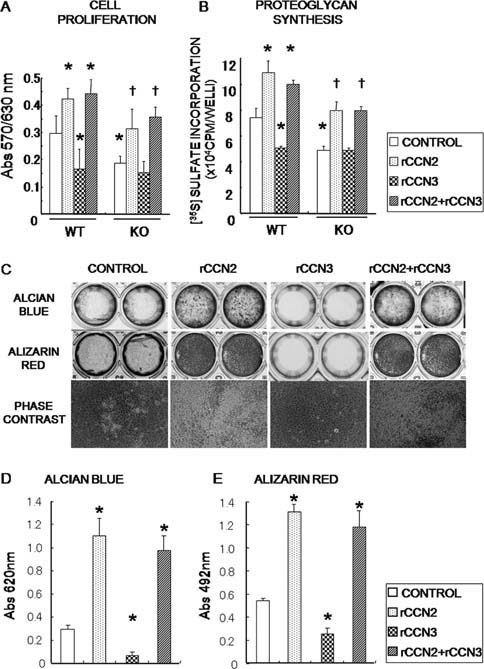
Effect of exogenous rCCN2 and rCCN3 on the proliferation, proteoglycan synthesis/maturation, and calcification of chondrocytes. (A and B) A comparative analysis of effects of rCCN2 and rCCN3 on the proliferation and proteoglycan synthesis between CCN2‐KO and WT chondrocytes. (C) Effects of rCCN2 and rCCN3 on the morphology, ECM accumulation, and mineral deposition of WT chondrocytes was evaluated. (D and E) A quantitative data of C is shown in graphic form. Data are the mean ± SE of two independent experiments. Chondrocytes were harvested from eight WT and eight CCN2‐KO mice. *p < 0.05, significantly different from WT control. † p < 0.05, significantly different from CCN2‐KO control.
To uncover the molecular background supporting such biological functions of CCN3 as well as CCN2, we studied the effects of exogenous CCN2 and CCN3 on the expression of chondrocyte‐associated genes in both types of chondrocytes by performing a time‐course experiment. The results showed that rCCN2 induced its own mRNA expression in WT chondrocytes up to 3‐fold at 6 h after addition. In contrast, rCCN3 reduced Ccn2 mRNA expression after 12 h (Fig. 5A). Interestingly, rCCN2 significantly reduced Ccn3 expression after 24 h in both chondrocytes, which reduction became much more prominent after 48 h (Figs. 5B and 5C). In contrast to CCN2, rCCN3 had no effect on its own mRNA expression (Figs. 5B and 5C). Rapid induction of Aggrecan and Sox9 gene expression by rCCN2 was observed in both chondrocytes. The effect was relatively stable in WT chondrocytes, whereas it was sharper and transient in CCN2‐KO chondrocytes. Contrarily, rCCN3 reduced it after 6 h (Figs. 5D–5G). Col2a1 and Col10a1 were dramatically induced by rCCN2 in both types of chondrocytes, whereas rCCN3 caused a reduction in Col2a1 and Col10a1 gene expression in WT chondrocytes after 24 h (Figs. 5H–5K). According to a recent study, exogenous rCCN3 upregulated Col10a1 gene expression at a concentration of 500 ng/ml or 5 μg/ml in both ATDC5 cells and murine primary chondrocytes. However, these experiments showed that the minimal and effective dose of rCCN3 reduced Col10a1 gene expression. Moreover, rCCN2 treatment also rapidly induced Sox9 mRNA expression, whereas rCCN3 reduced it.
Figure FIG. 5.
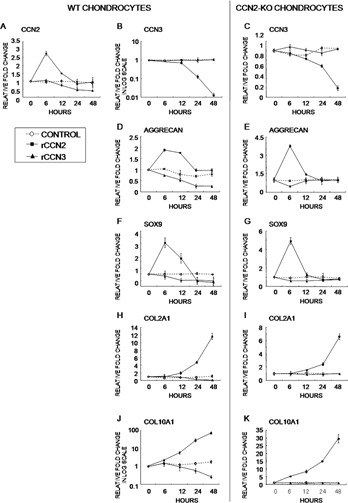
Effect of exogenous CCN2 and rCCN3 on the gene expression of their own and other chondrocyte differentiation‐associated genes. (A–C) Expression of Ccn2 and Ccn3. (D–K) Expression of chondrocyte marker genes. Changes in mRNA expression levels of Ccn2 (A), Ccn3 (B and C), Aggrecan (D and E), Sox9 (F and G), Col2a1 (H and I), and Col10a1 (J and K) in WT (WT in parentheses: A, B, D, F, H, J) and CCN2‐KO (KO in parentheses: C, E, G, I, K) chondrocytes after addition of rCCN2 or rCCN3 were evaluated. All of the data were standardized against the value of the control at each time point. Data are the mean ± SD of four independent sets of duplicate samples from eight WT and eight CCN2‐KO mice.
To assess the mechanism of CCN2 control of chondrocyte differentiation, the expression of PTHrP, PTH/PTHrP receptor, and Ihh was examined. PTHrP protein was broadly and abundantly distributed in the resting and prehypertrophic chondrocytes in the WT tibia (Fig. 6A). However, the CCN2‐KO tibia showed significantly reduced production of PTHrP (Fig. 6B). No remarkable difference existed in the PTH/PTHrP receptor or Ihh immunopositive area between WT and CCN2‐KO tibias (Figs. 6C–6F). In addition, CCN2‐KO chondrocytes always maintained a lower level of Pthrp mRNA expression during their terminal differentiation (Fig. 6G). Moreover, the induction of Ihh was delayed, and its expression level was consistently lower than that in WT chondrocytes (Fig. 6H). To clarify the effect of CCN2 and CCN3 on Pthrp and Ihh gene expression in chondrocytes, rCCN2 or rCCN3 was added to both types of chondrocyte cultures. The Pthrp expression was rapidly increased after 6 h by rCCN2, and the effect continued after 12 h in the WT chondrocytes (Fig. 6I). In the CCN2‐KO chondrocytes, the Pthrp expression was increased after 6 h as in the WT chondrocytes, although the effect did not continue as long (Fig. 6J). The rCCN2 rapidly induced and maintained the Ihh mRNA expression in the WT chondrocytes up to >10‐fold after 6 h, whereas its expression was decreased by rCCN3 after 24 h in these cells (Fig. 6K). In the CCN2‐KO chondrocytes, rCCN2 induced transient Ihh expression (Fig. 6L).
Figure FIG. 6.
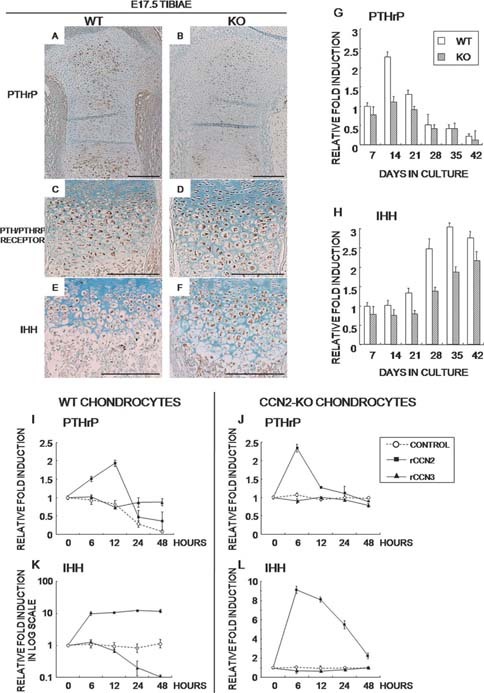
Immunohistochemical and in vitro gene expression analysis of PTHrP and Ihh in CCN2‐KO vs. WT mice. (A–F) E17.5 tibias from WT and MT mice immunostained with anti‐PTHrP, anti‐PTH/PTHrP receptor, or anti‐Ihh antibody. (G and H) Pthrp and Ihh mRNA expression levels in WT and CCN2‐KO chondrocytes during terminal differentiation evaluated from the samples used in Figs. 3B–3J. (I–L) Effects of rCCN2 or rCCN3 on the mRNA level of Pthrp (I and J) and Ihh (K and L) in WT and CCN2‐KO chondrocytes evaluated by using the samples used for Fig. 5. Data are the mean ± SD of four independent sets of duplicate samples from eight WT and eight CCN2‐KO mice.
Among all of the genes evaluated, Ccn3 was most strikingly modulated by the CCN2 deletion. To estimate the role of CCN3 in the endochondral bone formation, we knocked down Ccn3 expression in both types of chondrocytes by using siRNAs and evaluated the biological outcome. Approximately 70% and 90% inhibition of Ccn3 expression was achieved in the WT and CCN2‐KO chondrocytes, respectively (Fig. 7A). By Ccn3 knockdown, Ccn2, Aggrecan, Sox9, Col2A1, Col10A1, Pthrp, and Ihh mRNA levels were all increased in the WT chondrocytes (Figs. 7B–7H), whereas the other Ccn members were not affected (data not shown). It is of particular note that the mRNA levels of Sox9, Col2A1, and Pthrp were not increased in the CCN2‐KO chondrocytes, whereas those of Aggrecan, Col10a1, and Ihh were upregulated.
Figure FIG. 7.
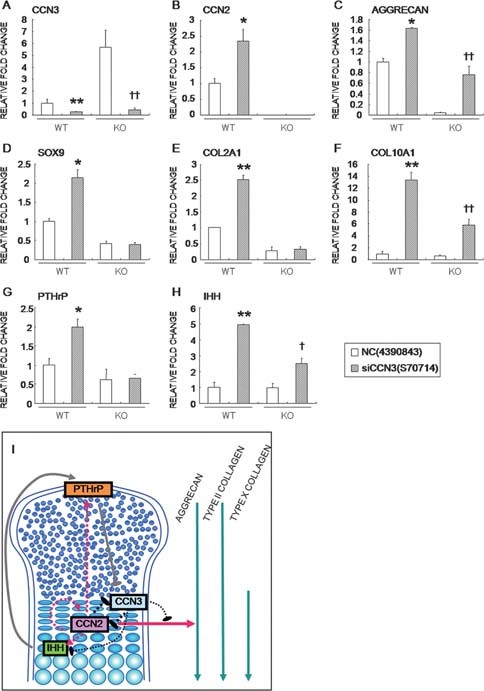
Mechanism of action of CCN2 and CCN3 in regulatory endochondral bone formation. (A–H) Effect of Ccn3 knockdown on the expression of chondrocyte‐associated genes in WT and CCN2‐KO chondrocytes in culture. Data are the mean ± SE of four independent sets of duplicate samples from four WT and four CCN2‐KO mice. *p < 0.05, **p < 0.01, significantly different from WT control. † p < 0.05, †† p < 0.01, significantly different from CCN2‐KO control. (I) Possible scheme of the cooperative regulation of chondrocyte differentiation by the counteracting functions of CCN2 and CCN3 under interaction with the PTHrP‐Ihh network. Dotted lines indicate the hypothetical pathways.
DISCUSSION
This study showed that CCN2 deletion caused striking upregulation of Ccn3 expression and a remarkable reduction in chondrocyte proliferation, ECM synthesis, and delayed calcification in vivo and in vitro. In addition, a significant reduction in Pthrp expression was found during chondrocyte differentiation in CCN2‐KO mice. In these mice, a loss of the repression by CCN2 caused overproduction of CCN3, thereby suppressing the proliferation and maturation of chondrocytes and eventually delaying terminal differentiation. This indicates that CCN2 may induce chondrocyte differentiation by regulating the expression of chondrocyte differentiation‐associated genes, such as Sox9, Pthrp, Ihh, and ECMs, whereas it may reduce the CCN3 production that counteracts CCN2 at each step of differentiation. Indeed, this hypothesis was supported by the in vitro data showing the molecular and cell biological effects of CCN2 and CCN3 on chondrocytes.
A previous study showed that bent bones, enlarged hypertrophic zones, and delayed calcification in the growth plates of long bones were the major abnormal skeletal phenotypes in CCN2‐KO mice. These findings were also observed in CCN2‐KO tibias at E18.5. In addition, CCN2 deletion caused a significant reduction in the amount of ECM components such as aggrecan and type II and type X collagens in vivo and in vitro, although such reduction might be less prominent at a late stage of development. Collagens are the major proteins in cartilage and bone matrices and play important roles in determining the size, shape, and strength of these connective tissues.1, 35, 36 Therefore, bent cartilage/bone in CCN2‐KO mice probably results from the physical weakness caused by, at least in part, the decreased synthesis of these collagens. In addition, the Aggrecan mRNA expression level and proteoglycan synthesis in CCN2‐KO mice were also impaired both in vivo and in vitro, and this impairment was recovered by the addition of exogenous rCCN2 in vitro. These data further show that CCN2 is essential for efficient ECM construction by chondrocytes to provide the physical stiffness to support long bone growth.
CCN2 promotes the proliferation of certain types of chondrocytes in vitro.6, 12, 13, 14, 15 As expected, the proliferative ability of CCN2‐KO chondrocytes was found to decrease. Nevertheless, it should be noted that not only the cell growth but also the terminal differentiation was affected by the CCN2 deletion in chondrocytes. Because the cells supplied by proliferation and those removed by terminal differentiation and mineralization are both decreased, the total length of long bones in CCN2‐KO mice could be comparable to those in WT mice. This idea is phenotypically supported by the enlarged growth plate, particularly the hypertrophic layer, and impaired ossification in this tissue. It should be also noted that the primary shape and size of bones are genetically programmed in the network of relevant genes. In fact, in CCN2‐KO tibias, their cortical bone seems to follow the programmed size in WT.
To further characterize the CCN2 deletion phenotype, the gene expression and distribution pattern of the CCN family members was analyzed in WT versus CCN2‐KO chondrocytes in vivo and in vitro. The mRNA expression patterns during terminal differentiation in Fig. 3 were supported by the histochemical analyses and the data obtained with RNA directly extracted from tissues (Figs. FIG. 1., FIG. 2.). Indeed, CCN2 deletion caused a drastic upregulation of Ccn3 mRNA expression and CCN3 production. The findings that the Ccn3 mRNA level reached a peak earliest among the Ccn members in vitro suggest that CCN3 plays a role in an earlier phase of differentiation than the other CCN proteins. In addition, a somewhat overlapping distribution of CCN2, 3, and 6 may represent their redundant or counteracting roles. CCN3 plays its role during the proliferative and early maturation steps; CCN1, 2, and 6 act during the late proliferative, maturation, and early calcification steps; and CCN4 and 5 are involved in maturation and calcification. Next, because striking upregulation of CCN3 was observed by CCN2 deletion in vivo and in vitro, these two proteins were further studied. Initially, effects of rCCN2 and rCCN3 on chondrocyte‐associated gene expression were studied. The rCCN2 induced its own gene expression and chondrocyte differentiation‐associated gene expression. In contrast, rCCN3 reduced the expression of a number of these genes. These results indicate that CCN2 is an important inducer of chondrocyte proliferation and differentiation and suggest that CCN3 plays suppressive roles against CCN2. Considering the structural similarity, CCN2 is thought to share common receptors/functional counterparts with CCN3 that antagonizes CCN2 and vice versa. Interestingly, the same concentration of rCCN2 could overcome the inhibitory effects of rCCN3, thus suggesting that CCN2 is dominant in interacting with certain receptors/counterparts. However, CCN3 potently exerts its functions, if the CCN2 level is relatively low enough, as represented by the data in Fig. 1. In any case, their expression level precisely regulates the amount of product corresponding to the stage of differentiation.
To further clarify the mechanism of action of CCN2 and CCN3 in cartilage, we knocked down Ccn3 by using an RNAi strategy. Consequently, we found that regulation of Aggrecan, Col10a1, and Ihh was mediated by CCN3, whereas other associated genes might be regulated by CCN2 independently from CCN3. According to previous reports, PTHrP and Ihh form a negative feedback loop regulating the onset of hypertrophy of chondrocytes. A disruption of this signaling pathway can result in abnormal chondrocyte differentiation.3, 4, 37, 38, 39 In this study, the lack of CCN2 altered the PTHrP‐Ihh loop in CCN3‐dependent and ‐independent fashions, deregulating these two molecules, which resulted in the downregulation of Pthrp expression and delayed Ihh upregulation. Previous studies showed that PTHrP null, PTH/PTHrP receptor–null, and Ihh‐null mice developed chondrodysplasia because of premature hypertrophic differentiation, leading to shorter bones than those in WT littermates. Interestingly, PTHrP‐null mice were reported to show a domed skull, shortened mandibles, and fewer trabeculae in long bones.37, 40 These phenotypes were also observed in CCN2‐KO mice as well, although these mice were distinctively characterized by premature mineralization of the hypertrophic layer.10, 16 Indeed, the hypertrophic zones increased in size in CCN2‐KO mice, and downregulation of PTHrP was observed, which is thought to cause a reduction in cell number and shortened limbs. However, upregulation of CCN3, which delays the induction of Ihh to inhibit hypertrophic differentiation, and removal of these chondrocytes may have maintained the regular length of CCN2‐KO long bones. This hypothesis is favored, because expansion of the CCN3‐positive area was actually observed in the tibial cartilage of the CCN2‐KO mice. Therefore, the lower proliferation rate of chondrocytes and the delay in chondrocyte maturation and calcification in CCN2‐KO embryos may result from the distortion of the signaling network composed of CCN2, CCN3, PTHrP, and Ihh molecules (Fig. 7I).
In summary, this study showed that CCN2 promotes chondrocyte proliferation and differentiation at all steps, whereas CCN3 strongly inhibits them. In the CCN2‐KO embryo, upregulated CCN3 and reduced PTHrP seem to cause delay in each step of chondrocyte differentiation. As a result, CCN2‐KO long bones were so fragile that they were found to be bent in vivo. Therefore, CCN2 plays a fundamental role in skeletal development by regulating and coordinating chondrocyte differentiation to form endochondral bones of the appropriate strength and shape, and CCN3 cooperates with CCN2 mainly at an earlier stage with its counteracting effects. The critical involvement of the PTHrP‐Ihh feed‐back loop was also suggested in the CCN2‐CCN3 cooperative network. Further characterization of this network is currently underway.
Acknowledgements
The authors thank Drs Takako Hattori, Takashi Nishida, Tomoichiro Yamaai, and Tsuyoshi Shimo for helpful suggestions; Kazumi Oyama and Tomoko Yamamoto for technical assistance; and Yuki Nonami for valuable secretarial assistance. This work was supported by grants from the program Grants‐in‐Aid for Scientific Research (S) (to MT) and (C) (to SK), Japan Society for the Promotion of Science, and Exploratory Research (to MT) from the Ministry of Education, Culture, Sports, Science, and Technology of Japan; and a grant from the Foundation of Sanyo Broadcasting (to SK). HK is a recipient of an Iwadare Scholarship from the Iwadare Educational Association for Dental Graduate Students. The work performed in Prof Perbal's laboratory was supported by the French Ministry of Education and Research and by European Union (Prothets grant; Contract LSHC‐CT‐2004‐5030306). NL is supported by the European Prothets grant.
The authors state that they have no conflicts of interest.
REFERENCES
- 1. Erlebacher A, Filvaroff EH, Gitelman SE, Derynck R 1995. Toward a molecular understanding of skeletal development. Cell 80: 371–378. [DOI] [PubMed] [Google Scholar]
- 2. Takigawa M, Takano T, Suzuki F 1981. Effects of parathyroid hormone and cyclic AMP analogues on the activity of ornithine decarboxylase and expression of the differentiated phenotype of chondrocytes in culture. J Cell Physiol 106: 259–268. [DOI] [PubMed] [Google Scholar]
- 3. Lanske B, Karaplis AC, Lee K, Luz A, Vortkamp A, Pirro A, Karperien M, Defize LH, Ho C, Mulligan RC, Abou‐Samra AB, Juppner H, Segre GV, Kronenberg HM 1996. PTH/PTHrP receptor in early development and Indian hedgehog‐regulated bone growth. Science 273: 663–666. [DOI] [PubMed] [Google Scholar]
- 4. Kobayashi T, Chung UI, Schipani E, Starbuck M, Karsenty G, Katagiri T, Goad DL, Lanske B, Kronenberg HM 2002. PTHrP and Indian hedgehog control differentiation of growth plate chondrocytes at multiple steps. Development 129: 2977–2986. [DOI] [PubMed] [Google Scholar]
- 5. Yoon BS, Lyons KM 2004. Multiple functions of BMPs in chondrogenesis. J Cell Biochem 93: 93–103. [DOI] [PubMed] [Google Scholar]
- 6. Perbal B, Takigawa M 2005. CCN Proteins: A New Family of Cell Growth and Differentiation Regulators Imperial College Press, London, UK. [Google Scholar]
- 7. Moussad EE, Brigstock DR 2000. Connective tissue growth factor: What's in a name? Mol Genet Metab 71: 276–292. [DOI] [PubMed] [Google Scholar]
- 8. Shimo T, Koyama E, Sugito H, Wu C, Shimo S, Pacifici M 2005. Retinoid signaling regulates CTGF expression in hypertrophic chondrocytes with differential involvement of MAP kinases. J Bone Miner Res 20: 867–877. [DOI] [PubMed] [Google Scholar]
- 9. Song JJ, Aswad R, Kanaan RA, Rico MC, Owen TA, Barbe MF, Safadi FF, Popoff SN 2007. Connective tissue growth factor (CTGF) acts as a downstream mediator of TGF‐beta1 to induce mesenchymal cell condensation. J Cell Physiol 210: 398–410. [DOI] [PubMed] [Google Scholar]
- 10. Ivkovic S, Yoon BS, Popoff SN, Safadi FF, Libuda DE, Stephenson RC, Daluiski A, Lyons KM 2003. Connective tissue growth factor coordinates chondrogenesis and angiogenesis during skeletal development. Development 130: 2779–2791. [DOI] [PMC free article] [PubMed] [Google Scholar]
- 11. Nakanishi T, Kimura Y, Tamura T, Ichikawa H, Yamaai Y, Sugimoto T, Takigawa M 1997. Cloning of a mRNA preferentially expressed in chondrocytes by differential display‐PCR from a human chondrocytic cell line that is identical with connective tissue growth factor (CTGF) mRNA. Biochem Biophys Res Commun 234: 206–210. [DOI] [PubMed] [Google Scholar]
- 12. Nakanishi T, Nishida T, Shimo T, Kobayashi K, Kubo T, Tamatani T, Tezuka K, Takigawa M 2000. Effects of CTGF/Hcs24, a product of a hypertrophic chondrocyte‐specific gene, on the proliferation and differentiation of chondrocytes in culture. Endocrinology 141: 264–273. [DOI] [PubMed] [Google Scholar]
- 13. Nishida T, Kubota S, Nakanishi T, Kuboki T, Yosimichi G, Kondo S, Takigawa M 2002. CTGF/Hcs24, a hypertrophic chondrocyte‐specific gene product, stimulates proliferation and differentiation, but not hypertrophy of cultured articular chondrocytes. J Cell Physiol 192: 55–63. [DOI] [PubMed] [Google Scholar]
- 14. Takigawa M, Nakanishi T, Kubota S, Nishida T 2003. Role of CTGF/HCS24/ecogenin in skeletal growth control. J Cell Physiol 194: 256–266. [DOI] [PubMed] [Google Scholar]
- 15. Nishida T, Kubota S, Kojima S, Kuboki T, Nakao K, Kushibiki T, Tabata Y, Takigawa M 2004. Regeneration of defects in articular cartilage in rat knee joints by CCN2 (connective tissue growth factor). J Bone Miner Res 19: 1308–1319. [DOI] [PubMed] [Google Scholar]
- 16. Kawaki H, Kubota S, Suzuki A, Yamada T, Matsumura T, Mandai T, Yao M, Maeda T, Lyons KM, Takigawa M 2008. Functional requirement of CCN2 for intramembranous bone formation in embryonic mice. Biochem Biophys Res Commun 366: 450–456. [DOI] [PMC free article] [PubMed] [Google Scholar]
- 17. Lau LF, Lam SC 2000. The CCN family of angiogenic regulators: The integrin connection. Exp Cell Res 248: 44–57. [DOI] [PubMed] [Google Scholar]
- 18. Brigstock DR 1999. The connective tissue growth factor/cysteine‐rich 61/nephroblastoma overexpressed (CCN) family. Endocr Rev 20: 189–206. [DOI] [PubMed] [Google Scholar]
- 19. Perbal B 2004. CCN proteins: Multifunctional signalling regulators. Lancet 363: 62–64. [DOI] [PubMed] [Google Scholar]
- 20. Hashimoto Y, Shindo‐Okada N, Tani M, Nagamachi Y, Takeuchi K, Shiroishi T, Toma H, Yokota J 1998. Expression of the Elm1 gene, a novel gene of the CCN (connective tissue growth factor, Cyr61/Cef10, and neuroblastoma overexpressed gene) family, suppresses In vivo tumor growth and metastasis of K‐1735 murine melanoma cells. J Exp Med 187: 289–296. [DOI] [PMC free article] [PubMed] [Google Scholar]
- 21. Zhang R, Averboukh L, Zhu W, Zhang H, Jo H, Dempsey PJ, Coffey RJ, Pardee AB, Liang P 1998. Identification of rCop‐1, a new member of the CCN protein family, as a negative regulator for cell transformation. Mol Cell Biol 18: 6131–6141. [DOI] [PMC free article] [PubMed] [Google Scholar]
- 22. Hurvitz JR, Suwairi WM, Van Hul W, El‐Shanti H, Superti‐Furga A, Roudier J, Holderbaum D, Pauli RM, Herd JK, Van Hul EV, Rezai‐Delui H, Legius E, Le Merrer M, Al‐Alami J, Bahabri SA, Warman ML 1999. Mutations in the CCN gene family member WISP3 cause progressive pseudorheumatoid dysplasia. Nat Genet 23: 94–98. [DOI] [PubMed] [Google Scholar]
- 23. Wong M, Kireeva ML, Kolesnikova TV, Lau LF 1997. Cyr61, product of a growth factor‐inducible immediate‐early gene, regulates chondrogenesis in mouse limb bud mesenchymal cells. Dev Biol 192: 492–508. [DOI] [PubMed] [Google Scholar]
- 24. Yu C, Le AT, Yeger H, Perbal B, Alman BA 2003. NOV (CCN3) regulation in the growth plate and CCN family member expression in cartilage neoplasia. J Pathol 201: 609–615. [DOI] [PubMed] [Google Scholar]
- 25. Yanagita T, Kubota S, Kawaki H, Kawata K, Kondo S, Takano‐Yamamoto T, Tanaka S, Takigawa M 2007. Expression and physiological role of CCN4/Wnt‐induced secreted protein 1 mRNA splicing variants in chondrocytes. FEBS J 274: 1655–1665. [DOI] [PubMed] [Google Scholar]
- 26. Sen M, Cheng YH, Goldring MB, Lotz MK, Carson DA 2004. WISP3‐dependent regulation of type II collagen and aggrecan production in chondrocytes. Arthritis Rheum 50: 488–497. [DOI] [PubMed] [Google Scholar]
- 27. Perbal B, 2006. NOV story: The way to CCN3. Cell Commun Signal 4: 3 (20 February) [serial online]. Available at http://www.biosignaling.com/content/4/1/3. [DOI] [PMC free article] [PubMed] [Google Scholar]
- 28. Bleau AM, Planque N, Lazar N, Zambelli D, Ori A, Quan T, Fisher G, Scotlandi K, Perbal B 2007. Antiproliferative activity of CCN3: Involvement of the C‐terminal module and post‐translational regulation. J Cell Biochem 101: 1475–1491. [DOI] [PubMed] [Google Scholar]
- 29. Kawaki H, Kubota S, Minato M, Moritani NH, Hattori T, Hanagata H, Kubota M, Miyauchi A, Nakanishi T, Takigawa M 2003. Novel enzyme‐linked immunosorbent assay systems for the quantitative analysis of connective tissue growth factor (CTGF/Hcs24/CCN2): Detection of HTLV‐I tax‐induced CTGF from a human carcinoma cell line. DNA Cell Biol 22: 641–648. [DOI] [PubMed] [Google Scholar]
- 30. Chevalier G, Yeger H, Martinerie C, Laurent M, Alami J, Schofield PN, Perbal B 1998. novH: Differential expression in developing kidney and Wilm's tumors. Am J Pathol 152: 1563–1575. [PMC free article] [PubMed] [Google Scholar]
- 31. Li CL, Martinez V, He B, Lombet A, Perbal B 2002. A role for CCN3 (NOV) in calcium signalling. Mol Pathol 55: 250–261. [DOI] [PMC free article] [PubMed] [Google Scholar]
- 32. Kubota S, Kawaki H, Kondo S, Yosimichi G, Minato M, Nishida T, Hanagata H, Miyauchi A, Takigawa M 2006. Multiple activation of mitogen‐activated protein kinases by purified independent CCN2 modules in vascular endothelial cells and chondrocytes in culture. Biochimie 88: 1973–1981. [DOI] [PubMed] [Google Scholar]
- 33. Wang Y, Nishida S, Sakata T, Elalieh HZ, Chang W, Halloran BP, Doty SB, Bikle DD 2006. Insulin‐like growth factor‐I is essential for embryonic bone development. Endocrinology 147: 4753–4761. [DOI] [PMC free article] [PubMed] [Google Scholar]
- 34. Lafont J, Jacques C, Le Dreau G, Calhabeu F, Thibout H, Dubois C, Berenbaum F, Laurent M, Martinerie C 2005. New target genes for NOV/CCN3 in chondrocytes: TGF‐beta2 and type X collagen. J Bone Miner Res 20: 2213–2223. [DOI] [PubMed] [Google Scholar]
- 35. Bell DM, Leung KK, Wheatley SC, Ng LJ, Zhou S, Ling KW, Sham MH, Koopman P, Tam PP, Cheah KS 1997. SOX9 directly regulates the type‐II collagen gene. Nat Genet 16: 174–178. [DOI] [PubMed] [Google Scholar]
- 36. Lefebvre V, Huang W, Harley VR, Goodfellow PN, de Crombrugghe B 1997. SOX9 is a potent activator of the chondrocyte‐specific enhancer of the pro alpha1(II) collagen gene. Mol Cell Biol 17: 2336–2346. [DOI] [PMC free article] [PubMed] [Google Scholar]
- 37. Karaplis AC, Luz A, Glowacki J, Bronson RT, Tybulewicz VL, Kronenberg HM, Mulligan RC 1994. Lethal skeletal dysplasia from targeted disruption of the parathyroid hormone‐related peptide gene. Genes Dev 8: 277–289. [DOI] [PubMed] [Google Scholar]
- 38. Lanske B, Divieti P, Kovacs CS, Pirro A, Landis WJ, Krane SM, Bringhurst FR, Kronenberg HM 1998. The parathyroid hormone (PTH)/PTH‐related peptide receptor mediates actions of both ligands in murine bone. Endocrinology 139: 5194–5204. [DOI] [PubMed] [Google Scholar]
- 39. St‐Jacques B, Hammerschmidt M, McMahon AP 1999. Indian hedgehog signaling regulates proliferation and differentiation of chondrocytes and is essential for bone formation. Genes Dev 13: 2072–2086. [DOI] [PMC free article] [PubMed] [Google Scholar]
- 40. Amizuka N, Warshawsky H, Henderson JE, Goltzman D, Karaplis AC 1994. Parathyroid hormone‐related peptide‐depleted mice show abnormal epiphyseal cartilage development and altered endochondral bone formation. J Cell Biol 126: 1611–1623. [DOI] [PMC free article] [PubMed] [Google Scholar]