

Abstract
Whereas there is clear evidence for a strong influence of bone quantity (i.e., bone mass or bone mineral density) on vertebral mechanical behavior, there are fewer data addressing the relative influence of cortical and trabecular bone microarchitecture. The aim of this study was to determine the relative contributions of bone mass, trabecular microarchitecture, and cortical thickness and curvature to the mechanical behavior of human lumbar vertebrae. Thirty‐one L3 vertebrae (16 men, 15 women, aged 75 ± 10 years and 76 ± 10 years, respectively) were obtained. Bone mineral density (BMD) of the vertebral body was assessed by lateral dual energy X‐ray absorptiometry (DXA), and 3D trabecular microarchitecture and anterior cortical thickness and curvature was assessed by micro‐computed tomography (µCT). Then compressive stiffness, work to failure, and failure load were measured on the whole vertebral body. BMD was correlated with compressive stiffness (r = 0.60), failure load (r = 0.70), and work to failure (r = 0.55). Except for the degree of anisotropy, all trabecular and cortical parameters were correlated with mechanical behavior (r = 0.36 to 0.58, p = .05 to .001, and r = 0.36 to 0.61, p = .05 to .0001, respectively). Stepwise and multiple regression analyses indicated that the best predictor of (1) failure load was the combination of BMD, structural model index (SMI), and trabecular thickness (Tb.Th) (R = 0.80), (2) stiffness was the combination of BMD, Tb.Th, and curvature of the anterior cortex (R = 0.82), and (3) work to failure was the combination of anterior cortical thickness and BMD (R = 0.68). Our data imply that measurements of cortical thickness and curvature may enhance prediction of vertebral fragility and that therapies that improve both vertebral cortical and trabecular bone properties may provide a greater reduction in fracture risk. © 2010 American Society for Bone and Mineral Research
Keywords: osteoporosis, bone biomechanics, bone µCT, trabecular bone microarchitecture, cortical shell
Introduction
Vertebral fracture is one of the major adverse consequences of osteoporosis because it is associated with back pain, disability, and impairment in health‐related quality of life1, 2 In Europe, the incidence of new vertebral osteoporotic fracture at the ages of 50 to 79 years was 1.1% per year in women and 0.6% per year in men on radiographic evaluation.3 With demographic changes toward an older population, early identification and treatment of patients at risk are required to reduce the burden of osteoporotic vertebral fracture. Measurement of areal bone mineral density (aBMD) employing dual‐energy X‐ray absorptiometry (DXA) is the most widely used index of bone strength, and a low aBMD is among the strongest risk factors for vertebral fracture.4, 5 However, approximately 50% of osteoporotic fractures occur in patients with an aBMD above the World Health Organization (WHO) diagnosis threshold of osteoporosis (T‐score ≤ −2.5).6, 7, 8, 9 In addition to aBMD, incorporation of trabecular microarchitecture improves the prediction of the mechanical behavior of vertebral trabecular bone.10, 11, 12 A few studies have examined the contribution of the cortex to vertebral mechanical behavior.13, 14, 15 However, these studies have been performed using finite‐element analysis (FEA) or 2D histomorphometry without direct mechanical testing on the whole vertebral body. Altogether, the respective contribution of trabecular and cortical bone to whole vertebral strength is still controversial.
Thus the aim of this ex vivo study was to assess the respective contributions of bone mass and trabecular and cortical bone microarchitecture to the mechanical behavior of human lumbar vertebrae.
Materials and Methods
Bone specimens
Lumbar vertebrae (L3) were harvested fresh from 31 human donors, including 16 men and 15 women. Age of the donors ranged from 54 to 93 years (75 ± 10 years for men and 76 ± 10 years for women). The absence of prevalent fractures or significant bone diseases (i.e., bone metastasis, Paget's disease, major osteoarthritis) involving the lumbar spine was assessed by high‐resolution lateral radiographs of the whole vertebra (Faxitron X‐Ray Corporation, Lincolnshire, IL, USA). Bone mineral content (BMC, g) and lateral areal bone mineral density (aBMD, g/cm2) of the vertebral body were measured using dual‐energy X‐ray absorptiometry (DXA, Delphi W, Hologic, Waltham, MA, USA). Volumetric BMD (vBMD, g/cm3) was calculated using the following formula: BMC/vertebral volume measured according to Archimedes' method after soft tissues and posterior arches removal. Bone specimens were maintained frozen at −20°C wrapped with gauze in saline solution until micro‐computed tomographic (µCT) image acquisition and mechanical testing.16
µCT image acquisition
After thawing at room temperature (20°C), image acquisition was performed in Ashman's solution. Ashman's solution was used to minimize changes in the mechanical properties of bone.16, 17 Image acquisition of the whole vertebral body was performed using a µCT device (Skyscan 1076, Aartselaar, Belgium). A nominal isotropic voxel size of 35 µm was used (field of view 70 mm, 2000 × 2000 pixels; X‐ray source: 100 kV, 100 µA). 2D to 3D processing, analysis, and visualization were performed using Skyscan Ant software (Fig. 1). The following 3D trabecular microarchitectural parameters were assessed: bone volume per tissue volume (BV/TV, %), direct trabecular thickness (Tb.Th, µm), degree of anisotropy (DA, n), and structural model index (SMI, n). DA corresponds to a measure of preferential alignment of the trabeculae along a directional axis (0 = isotropic; 1 = anisotropic). SMI reflects the rod‐ versus platelike nature of the structure (0 = platelike; 3 = rodlike). Since wedge vertebral fractures are the most prevalent fracture type,18 we measured features of the anterior cortex, including cortical thickness (Ct.Th, µm) and cortical radius of curvature (Ct.Curv, mm). Ct.Curv measurement was expressed by the mean of three 2D slice‐scans using Morpho Expert Explora Nova software (La Rochelle, France) (Fig. 2).
Figure 1.
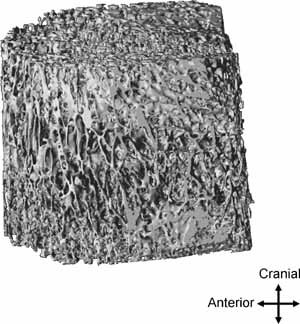
Vertebral trabecular bone compartment of a 75‐year‐old mane (BV/TV = 13.58%).
Figure 2.
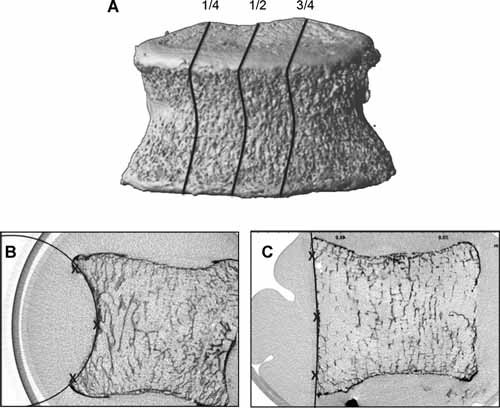
(A ) Three 2D slices were selected for measurement of the radius of curvature (1/4, 1/2, and 3/4 positions). The radius of curvature on the anterior cortical was expressed by the mean of these three measures. B, C. Anterior cortical radius of curvature measurement. Three points (superior, middle, and inferior) were positioned on the anterior cortex, and then a circle was automatically defined. (B) A 54 year‐old female, radius of curvature = 29.18 mm. (C ) An 86 year‐old female, radius of curvature = 70.09 mm.
Mechanical testing
After µCT acquisition, vertebral bodies were kept moist at 4°C with Ashman's solution until mechanical tests. Before testing, a polyester resin interface (Soloplast V11, Vosschemie, Saint‐Egrève, France) with a quick‐setting polymerization at low temperature was applied to each endplate of the vertebral body to achieve parallel surfaces for load application. Then quasi‐static uniaxial compressive testing was performed on the whole vertebral body submerged in Ashman's solution at controlled 37°C with a screw‐driven machine (Schenck RSA‐250, Darmstadt, Germany) under displacement control at 0.5 mm/s until failure. The compressive load and displacement were assessed by 5000 N load cell (TME, F 501 TC) and a displacement transducer mounted directly on the vertebral resin endplates (Mécanium, Lyon, France). Preconditioning was performed prior to testing (10 cycles with loading at 100 N and unloading at 50 N). The following parameters were measured from the load‐displacement data: failure load (N), defined by the force at the maximum on the load‐displacement curve; compressive stiffness (N/mm), defined by the linear part of the load‐displacement curve slope between 25% and 75% of the failure load; and work to failure (N‐mm), defined by the area under the load‐displacement curve to the failure load. Because of the vertebral shape, the measurement of cross‐sectional area was unreliable, and therefore, adjusted parameters (i.e., ultimate stress and Young's modulus) were not used in this study.
Statistical analysis
Shapiro‐Wilk tests were used to assess the normality of the distributions. For cortical radius of curvature, cortical thickness, and compressive work, distributions were normalized using logarithmic transformation. Data were presented as the mean, standard deviation, and range. The following tests were used: (1) paired t test for the comparison between gender, (2) Pearson coefficients of correlation for the analysis of the relationships between two variables, and (3) stepwise forward multiple regression models including part correlation coefficients (semipartial) for the selection of variables explaining mechanical testing. Results were considered significant if p < .05. All statistical analyses were performed using SPSS 16.0 (SPSS, Inc., Chicago, IL, USA).
Results
Means, standard deviations, and range of DXA, µCT, and mechanical test parameters are shown in Table 1. No effect of sex was found except for BMC, which was significantly higher in males than in females (7.18 g ± 1.88 versus 5.99 g ± 1.25, p = .048). No effect of age was found except for failure load (r = −0.37, p = 0.04).
Table 1.
Descriptive Statistics of Measured Parameters
| Mean ± SD | Range | |
|---|---|---|
| DXA measurements | ||
| BMC (g) | 6.6 ± 1.69 | 2.96–9.68 |
| BMD (g/cm2) | 0.62 ± 0.11 | 0.36–0.80 |
| vBMD (g/cm3) | 0.13 ± 0.03 | 0.06–0.20 |
| µCT measurements | ||
| BV/TV (%) | 15.31 ± 5.05 | 7.17–25.85 |
| Tb.Th (µm) | 224 ± 44 | 160–330 |
| DA (n) | 0.44 ± 0.04 | 0.36–0.51 |
| SMI (n) | 1.83 ± 0.24 | 1.26–2.25 |
| Ct.Th (µm) | 641 ± 400 | 206–1983 |
| Ct.Curv (mm) | 33 ± 15 | 12–70 |
| Mechanical tests | ||
| Failure load (N) | 2644 ± 1012 | 651–5481 |
| Compressive stiffness (N/mm) | 3072 ± 1545 | 663–6741 |
| Work to failure (N/mm) | 1640 ± 978 | 453–4158 |
DXA = dual energy X‐ray absorptiometry; BMC = bone mineral content; BMD = bone mineral density; vBMD = volumetric bone mineral density; µCT = micro‐computed tomography; BV/TV = bone volume/tissue volume; Tb.Th = trabecular thickness; DA = degree of anisotropy; SMI = structure model index; Ct.Th = anterior cortical thickness; Ct.Curv = anterior cortical radius of curvature.
Effect of bone mass and trabecular bone microarchitecture on mechanical behavior
Bone mass parameters (i.e., BMD, vBMD, and BV/TV) were strongly correlated with failure load, compressive stiffness, and work to failure (range, r = 0.47 to 0.70, p = .007 to .0001) except vBMD and BV/TV, which were not correlated with work to failure (Table 2).
Table 2.
Pearson Correlation Coefficients Between Bone Mass Parameters, Trabecular Microarchitecture Parameters, Cortical Parameters, and Mechanical Behavior
| BMC | BMD | vBMD | BV/TV | Tb.Th | DA | SMI | Ct.Th | Ct.Curv | Failure load | Stiffness | |
|---|---|---|---|---|---|---|---|---|---|---|---|
| BMD (g/cm2) | 0.86*** | ||||||||||
| vBMD (g/cm3) | 0.51** | 0.64*** | |||||||||
| BV/TV (%) | 0.34 | 0.58*** | 0.70*** | ||||||||
| Tb.Th (µm) | 0.42* | 0.35 | 0.08 | 0.37* | |||||||
| DA (n) | –0.11 | –0.18 | –0.34 | –0.59*** | –0.42* | ||||||
| SMI (n) | –0.27 | –0.47** | –0.45* | –0.80*** | –0.35 | 0.21 | |||||
| Ct.Tha (µm) | 0.61*** | 0.46** | 0.09 | 0.29 | 0.68*** | –0.09 | –0.35 | ||||
| Ct.Curva (mm) | –0.60*** | –0.50** | –0.27 | –0.03 | –0.36* | 0.09 | –0.14 | –0.41* | |||
| Failure load (N) | 0.56*** | 0.70*** | 0.50** | 0.47** | 0.08 | 0.09 | –0.58*** | 0.36* | –0.16 | ||
| Stiffness (N/mm) | 0.45* | 0.60*** | 0.61*** | 0.48** | –0.22 | –0.02 | –0.43* | 0.01 | 0.06 | 0.75*** | |
| Work to failurea (N/mm) | 0.45* | 0.55*** | 0.17 | 0.27 | 0.44* | 0.07 | –0.36* | 0.61*** | –0.36* | 0.67*** | 0.14 |
BMC = bone mineral content; BMD = bone mineral density; vBMD = volumetric bone mineral density; BV/TV = bone volume/tissue volume; Tb.Th = trabecular thickness; DA = degree of anisotropy; SMI = structure model index; Ct.Th = anterior cortical thickness; Ct.Curv = anterior cortical radius of curvature.
Logarithmic transformation.
p < .05;
p < .01;
p < .001.
Trabecular microarchitecture variables were correlated with mechanical behavior, except for DA (see Table 2). Specifically, failure load was correlated with BV/TV and SMI (r = 0.47, p = .007 and r = –0.58, p = .001 respectively), compressive stiffness with BV/TV and SMI (r = .48, p = .006 and r = –0.43, p = .017, respectively), and work to failure with SMI and Tb.Th (r = –0.36, p = .046 and r = .44, p = .014, respectively). Stepwise regression analyses indicated that among the trabecular microarchitecture variables, SMI was the best predictor of the mechanical behavior of the whole vertebrae.
Effect of cortical bone on mechanical behavior
Failure load was positively correlated with Ct.Th (r = 0.36, p = .046). Work to failure was positively correlated with Ct.Th and negatively correlated with Ct.Curv (r = .61, p < .0001 and r = −0.36, p = .049, respectively; see Table 2). Stiffness was not related to either cortical parameter.
Combined effects of trabecular and cortical bone on mechanical behavior
Stepwise regression analyses were performed to assess the best association between bone mass (i.e., BMD and BV/TV), trabecular microarchitectural (Tb.Th, DA, and SMI), and cortical (Ct.Th and Ct.Curv) parameters (Table 3). To explain failure load, the introduction of BMD (first step; p < .0001), SMI (second step; p = .007), and Tb.Th (third step; p = .04) in a multiple regression model was significant. Therefore, the combination of BMD, SMI, and Tb.Th was found as the best predictor of failure load (R = 0.80, p < .0001).
Table 3.
Multiple Regression Analysis Including the Coefficient of Determination (R2), the P value, and the Part Correlation (Semipartial Correlation r2) for Each Variable Included in the Models
| Variables | ||||
|---|---|---|---|---|
| Dependent | Independent | Final R2 | Part correlation (r2) | p value |
| Failure load | ||||
| BMD | 0.28 | <.0001 | ||
| SMI | 0.11 | .007 | ||
| Tb.Th* | 0.06 | .039 | ||
| 0.64 | <.0001 | |||
| Stiffness | ||||
| BMD | 0.62 | <.0001 | ||
| Tb.Th* | 0.13 | .003 | ||
| Ct.Curv | 0.10 | .008 | ||
| 0.67 | <.0001 | |||
| Work to failure | ||||
| BMD | 0.09 | .038 | ||
| Ct.Th | 0.16 | .008 | ||
| 0.46 | <.0001 | |||
To explain compressive stiffness, the introduction of BMD (first step; p < .0001), Tb.Th (second step; p = .003), and Ct.Curv (third step; p = .008) in a multiple regression model was significant. Therefore, the combination of BMD, Tb.Th, and Ct.Curv was found as the best predictor of compressive stiffness (R = 0.82, p < .0001).
To explain work to failure, the introduction of Ct.Th (first step; p = .008) and BMD (second step; p = .04) in a multiple regression model was significant. Therefore, the combination of Ct.Th and BMD was found as the best predictor of work to failure (R = 0.68, p < .0001).
In addition, the correlation between work to failure with Ct.Th remained significant after adjustment for BMD (p = .005, partial correlation).
Discussion
The aim of this study was to determine the relative contributions of bone mass, trabecular microarchitecture, and cortical thickness and curvature to mechanical behavior of human lumbar vertebrae. Our study showed that bone mass parameters (BMC, BMD, vBMD, and BV/TV) were strongly correlated with vertebral compressive stiffness and failure load, whereas only BMC and BMD were associated with work to failure.
It is important to note that we performed a structural test of the whole vertebral body, and thus one would predict that size‐ and mass‐related variables would be associated with the structural properties. BMD and BMC measurements include both trabecular and cortical compartments, whereas BV/TV only assesses trabecular bone. This may explain the observation that BV/TV was not correlated with work to failure, although BMD was, because energy absorption (evaluated by work to failure) seemed to be largely dissipated by the cortical shell, as assessed by the significant correlation between cortical parameters and work to failure. Although previous studies have shown that trabecular bone mainly dissipates energy,19, 20 discrepancy with our results can be explained by our elderly population with a very low BV/TV giving a preponderant role to the cortical shell.
Some, but not all, features of trabecular and cortical microarchitecture were correlated with mechanical behavior. Among trabecular bone parameters, SMI was the strongest predictor of mechanical behavior. This may be because SMI reflects both bone mass and trabecular architecture.21
Fractures can occur because bones are too flexible, too weak, do not absorb enough energy, and/or are not resistant to repetitive loading. Our stepwise and multiple regression analyses indicated that the best predictor of failure load was the combination of BMD, SMI, and Tb.Th, whereas stiffness was best predicted by the combination of BMD, Tb.Th, and curvature of the anterior cortex. Work to failure was best predicted by the combination of BMD and anterior cortical thickness. Taken together, our results indicate that the cortical shell determines flexibility and energy absorption, whereas the trabecular bone features seem to affect the load‐bearing capacity. Since our study had a relatively small sample size for conducting multiple regression analyses, it would be important to validate these patterns in future larger studies.
The contribution of the cortex to vertebral strength and to vertebral fractures remains a topic of keen interest. The so‐called cortical shell of the vertebral body is thin and porous and perhaps is better thought of as a thin membrane of fused trabeculae than as a true cortex. Thus one difficulty in sorting out the role of the vertebral cortex, particularly in aged individuals, is that the extreme thinness of the cortex makes it difficult to measure with most nondestructive techniques. Previous studies using 2D histomorphometry reported that values of Ct.Th ranged from 180 to 600 µm.14, 15, 22 In this study we found values of Ct.Th that were slightly higher (mean value 641 µm) than the histomorphometric estimates and thus may have been slightly overestimated because of µCT resolution. Overestimation was reported previously by Cendre and colleagues and was attributed to a partial volume effect.23
Nonetheless, although most studies have emphasized the rapid loss of trabecular bone mass following menopause as a primary determinant of vertebral fragility, both old and new studies point to an important role for the cortex, particularly when trabecular bone volume is low. Despite a significant age‐related decrease in lumbar vertebra cortical thickness,14 there is a great deal of evidence indicating that the relative contribution of the shell to vertebral strength increases with age.24, 25, 26 With cadaver studies reporting that the cortical shell accounts for anywhere from 10% to 75% of the vertebral strength,24, 27, 28 differences in these estimates of trabecular versus cortical load sharing are most likely due to differences in experimental methods for specimen preparation (cortical shell removal) and mechanical testing (loading conditions). Because of the technical difficulty of precisely removing the thin cortical shell using experimental methods, finite‐element analysis (FEA) modeling has been used to study cortical versus trabecular load sharing.13, 29, 30 Using µCT‐based FEA, Eswaran and colleagues found that the proportion of bone mass attributable to the cortical shell (excluding the endplates) was large, ranging from 21% to 39% across vertebrae, even though the average shell thickness was only on the order of 380 µm. The fraction of load taken by this thin shell was maximal at midsection, where it varied between 38% and 54%. In contrast, the fraction of load carried by the cortical shell was minimal near the endplates, on average only 15%. Moreover, the contribution of the cortical shell varies with trabecular bone volume both within a given vertebra (i.e., along the superoinferior axis) and among subjects with different trabecular densities. Indeed, one FEA study estimated that the relative contribution of the shell to vertebral strength was 12% in normal subjects but 56% in older osteoporotic subjects.30 Taken together, these FEA studies, along with our experimental data, confirm that the role of the vertebral cortex shell is substantial and may be very important in the etiology and prevention of vertebral fractures.
Our study had several limitations worth mentioning. The loading mode used was uniaxial uniform compression. Because most osteoporotic vertebral fractures are wedge fractures.18 the response to combined compression and anteroposterior bending is of clinical interest. Although the role of the shell under such loading conditions is unclear, it is possible that the shell may play a more important role under such loading conditions because peripheral bone has a greater structural role in bending behavior for the vertebra.31 Activities that require forward bending of the upper body may cause up to 10‐fold higher compressive forces on the vertebra compared with standing upright.32 Moreover, this study did not take into account other determinants of fracture risk such as bone composition (i.e., mineral content, crystal size and perfection, and collagen maturity).33
In conclusion, our data imply that measurements of cortical thickness and curvature may enhance predictions of vertebral fragility and that therapies that improve both vertebral cortical and trabecular bone properties of vertebrae may provide a greater reduction in fracture risk.
Disclosures
The authors state that they have no conflicts of interest.
Acknowledgements
We would like to thank Mr. Patrice Clerc (Mecanium, INSA, Lyon, France) for his precious collaboration to mechanical tests. This study was supported in part by an unrestricted research grant from Eli‐Lilly to INSERM. JPR and JW contributed equally to this work.
References
- 1. Ettinger B, Black DM, Nevitt MC, et al. Contribution of vertebral deformities to chronic back pain and disability. J Bone Miner Res. 1992; 7: 449–456. [DOI] [PubMed] [Google Scholar]
- 2. Oleksik A, Lips P, Dawson A, et al. Health‐related quality of life in post‐menopausal women with low BMD with or without prevalent vertebral fracture. J Bone Miner Res. 2000; 15: 1384–1392. [DOI] [PubMed] [Google Scholar]
- 3. Felsenberg D and the European Prospective Osteoporosis Study (EPOS) Group . Incidence of vertebral fracture in Europe: results from the European Prospective Osteoporosis Study (EPOS). J Bone Miner Res. 2002; 17: 716–7124. [DOI] [PubMed] [Google Scholar]
- 4. Marshall D, Johnell O, Wedel H. Meta‐analysis of how well measures of bone mineral density predict occurrence of osteoporotic fractures. BMJ. 1996; 312: 1254–1259. [DOI] [PMC free article] [PubMed] [Google Scholar]
- 5. World Health Organization . Assessment of Fracture Risk and Its Application to Screening for Post‐menopausal Osteoporosis. Geneva: WHO; 1994. [Google Scholar]
- 6. McDonnell P, McHugh PE, O'Mahoney D. Vertebral osteoporosis and trabecular bone quality. Ann Biomed Eng. 2007; 35: 170–189. [DOI] [PubMed] [Google Scholar]
- 7. Sornay‐Rendu E, Munoz F, Garnero P, Duboeuf F, Delmas PD. Identification of osteopenic women at high risk of fracture: the OFELY study. J Bone Miner Res. 2005; 20: 1813–1819. [DOI] [PubMed] [Google Scholar]
- 8. Siris ES, Chen YT, Abbott TA, et al. Bone mineral density thresholds for pharmacological intervention to prevent fractures. Arch Intern Med. 2004; 164: 1108–1112. [DOI] [PubMed] [Google Scholar]
- 9. Schuit SCE, van der Klift M, Weel AEAM, et al. Fracture incidence and association with bone mineral density in elderly men and women: the Rotterdam study. Bone. 2004; 34: 195–202. [DOI] [PubMed] [Google Scholar]
- 10. Hulme PA, Boyd SK, Ferguson SJ. Regional variation in vertebral bone morphology and its contribution to vertebral fracture strength. Bone. 2007; 41: 946–957. [DOI] [PubMed] [Google Scholar]
- 11. Buckley JM, Loo K, Motherway J. Comparison of quantitative computed tomography‐based measures in predicting vertebral compressive strength. Bone. 2007; 40: 767–774. [DOI] [PMC free article] [PubMed] [Google Scholar]
- 12. Ebbesen EN, Thomsen JS, Beck‐Nielsen H, Nepper‐Rasmussen HJ, Mosekilde L. Lumbar vertebral body compressive strength evaluated by dual‐energy X‐ray absorptiometry, quantitative computed tomography and ashing. Bone. 1999; 25: 713–724. [DOI] [PubMed] [Google Scholar]
- 13. Eswaran SK, Gupta A, Adams MF, Keaveny TM. Cortical and trabecular load sharing in the human vertebral body. J Bone Miner Res. 2006; 21: 307–314. [DOI] [PubMed] [Google Scholar]
- 14. Ritzel H, Amling M, Pösl M, Hahn M, Delling G. The thickness of human vertebral cortical bone and its changes in aging and osteoporosis: a histomorphometric analysis of the complete spinal column from thirty‐seven autopsy specimens. J Bone Miner Res. 1997; 12: 89–95. [DOI] [PubMed] [Google Scholar]
- 15. Silva MJ, Wang C, Keaveny TM, Hayes WC. Direct and computed tomography thickness measurements of the human vertebral shell and endplate. Bone. 1994; 15: 409–414. [DOI] [PubMed] [Google Scholar]
- 16. Martin RB, Sharkey NA. Mechanical effects of post‐mortem changes, preservation, and allograft bone treatments In: Cowin SC, ed. Bone Mechanics Handbook 2nd ed Boca Raton, FL: CRC Press, 2001; 20.1–20.24. [Google Scholar]
- 17. Ashman RB, Donofrio M, Cowin SC, van Buskirk WC. Postmortem changes in the elastic properties of trabecular bone. Trans Orthop Res Soc. 1982; 7: 63–67. [Google Scholar]
- 18. Eastell R, Cedel SL, Wahner HW, Riggs BL, Melton LJ. Classification of vertebral fractures. J Bone Miner Res. 1991; 6: 207–215. [DOI] [PubMed] [Google Scholar]
- 19. Seeman E, Delmas PD. Bone quality: the material and structural basis of bone strength and fragility. N Engl J Med. 2006; 354: 2250–2261. [DOI] [PubMed] [Google Scholar]
- 20. Keaveny TM, Hayes WC, A 20‐year perspective on the mechanical properties of trabecular bone. J Biomech Eng. 1993; 115: 534–542. [DOI] [PubMed] [Google Scholar]
- 21. Stauber M, Muller R. Volumetric spatial decomposition of trabecular bone into rods and plates‐a new method for local bone morphometry. Bone. 2006; 38: 475–484. [DOI] [PubMed] [Google Scholar]
- 22. Vesterby A, Mosekilde L, Gundersen HJG, Melsen F, Holme K, Sorensen S. Biomechanically meaningful determinants of the in vitro strength of lumbar vertebrae. Bone. 1991; 12: 219–224. [DOI] [PubMed] [Google Scholar]
- 23. Cendre E, Mitton D, Roux JP, et al. High‐resolution computed tomography for architectural characterization of human lumbar cancellous bone: relationships with histomorphometry and biomechanics. Osteoporos Int. 1999; 10: 353–360. [DOI] [PubMed] [Google Scholar]
- 24. Rockoff SD, Sweet E, Bleustein J. The relative contribution of trabecular and cortical bone to the strength of human lumbar verterbrae. Calcif Tissue Res. 1969; 3: 163–175. [DOI] [PubMed] [Google Scholar]
- 25. Mosekilde L. Vertebral structure and strength in vivo and in vitro. Calcif Tissue Int. 1993; 53: S121–S126. [DOI] [PubMed] [Google Scholar]
- 26. Riggs BL, Melton LJ. Involutions osteoporosis. N Engl J Med. 1986; 314: 1676–1686. [DOI] [PubMed] [Google Scholar]
- 27. Andresen R, Werner HJ, Schober HC. Contribution of the cortical shell of vertebrae to mechanical behavior of the lumbar vertebrae with implications for predicting fracture risk. Br J Radiol. 1998; 71: 759–765. [DOI] [PubMed] [Google Scholar]
- 28. McBroom RJ, Hayes WC, Edwards WT, Goldberg RP, White AA. Prediction of vertebral body compressive fracture using quantitative computed tomography. J Bone Joint Surg Am. 1985; 67: 1206–1214. [PubMed] [Google Scholar]
- 29. Homminga J, van Rietbergen B, Lochmuller E, Weinans H, Eckstein F, Huiskes R. The osteoporotic vertebral structure is well adapted to the loads of daily life, but not to infrequent “error” loads. Bone. 2004; 34: 510–516. [DOI] [PubMed] [Google Scholar]
- 30. Faulker KG, Cann CE, Hasegawa BH. Effect of bone distribution on vertebral strength: assessment with a patient‐specific non linear finite element analysis. Radiology. 1991; 179: 669–674. [DOI] [PubMed] [Google Scholar]
- 31. Crawford RP, Keaveny TM. Relationship between axial and bending behaviors of the human thoracolumbar vertebra. Spine. 2004; 29: 2248–2255. [DOI] [PubMed] [Google Scholar]
- 32. Duan Y, Seeman E, Turner CH. The biomechanical basis of vertebral body fragility in men and women. J Bone Miner Res. 2001; 12: 2276–2283. [DOI] [PubMed] [Google Scholar]
- 33. Gourion‐Arsiquaud S, Faibish D, Myers E, et al., Use of FTIR spectroscopic imaging to identify parameters associated with fragility fracture. J Bone Miner Res. 2009; 24: 1565–1571. [DOI] [PMC free article] [PubMed] [Google Scholar]