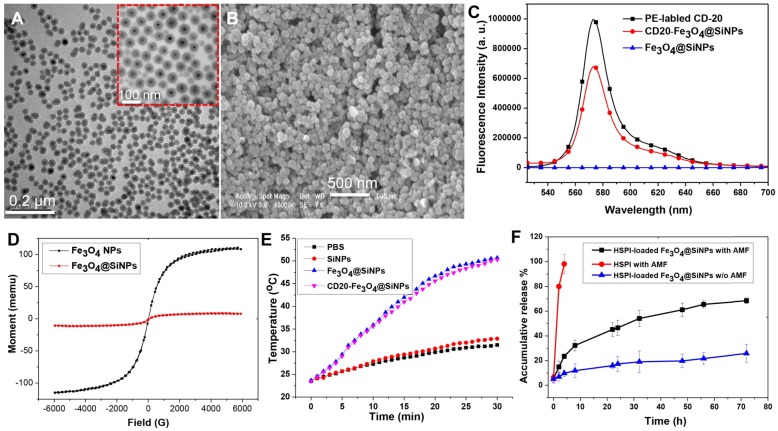
Figure 2.
Characterization of MNPs. (A) The core/shell structure of MNPs is shown in TEM image and enlarged image. (B) SEM of the MNPs. (C) Fluorescent spectra of CD20-Fe3O4@SiNPs. (D) Magnetic hysteresis loops of Fe3O4@SiNPs and Fe3O4 NPs. (E) The increased temperature of PBS, SiNPs, Fe3O4@SiNPs, and CD20-Fe3O4@SiNPs under AMF. (F) In vitro drug release of HSPI/Fe3O4@SiNPs under AMF. Data are performed three times as the mean ± SD.

