Abstract
Although databases are available that provide mass spectra and chromatographic retention information for small-molecule metabolites, no publicly available database provides electrophoretic mobility for common metabolites. As a result, most compounds found in electrophoretic-based metabolic studies are unidentified and simply annotated as “features”. To begin to address this issue, we analyzed 460 metabolites from a commercial library using capillary zone electrophoresis coupled with electrospray mass spectrometry. To speed analysis, a sequential injection method was used wherein six compounds were analyzed per run. An uncoated fused silica capillary was used for the analysis at 20 °C with a 0.5% (v/v) formic acid and 5% (v/v) methanol background electrolyte. A Prince autosampler was used for sample injection and the capillary was coupled to an ion trap mass spectrometer using an electrokinetically-pumped nanospray interface. We generated mobility values for 276 metabolites from the library (60% success rate) with an average standard deviation of 0.01 × 10⁻⁸ m2V−1s−1. As expected, cationic and anionic compounds were well resolved from neutral compounds. Neutral compounds co-migrated with electro-osmotic flow. Most of the compounds that were not detected were neutral and presumably suffered from adsorption to the capillary wall or poor ionization efficiency.
Keywords: Capillary electrophoresis, Metabolite database, Sequential injection
1. Introduction
The metabolome consists of small molecules, typically less than 1000 Da, present in a biological system [1]. The metabolome provides information on an organism's phenotypic response to a range of genetic and environmental factors [2,3]. Untargeted metabolic profiling provides an overview of metabolites in a sample. Liquid chromatography coupled with mass spectrometry (LC/MS) has been the standard analytical tool for these investigations [4]. These studies are challenging [5]; thousands of peaks observed are unidentified and simply annotated as “features”. In response, the Metabolomics Standards Initiative has proposed standardized reporting format for metabolomics studies [6]. That group defines Level 1 identifications as being based on co-characterization with authentic standards; identification at level 1 is laborious and time consuming.
Level 2 identifications are based on comparison with spectral libraries. Mass spectrometry libraries can be very large with data for thousands of compounds [7-9]. To aid level 2 analyses, databases have been developed that provide chromatographic retention information for hundreds of compounds [10-12].
As an alternative to chromatographic retention, we propose the use of capillary zone electrophoresis (CZE) mobilities to strengthen confidence in identification of charged metabolites; CZE is much less useful for neutral compounds, which co-migrate. There have been a number of applications of CZE to untargeted metabolomics [13], including applications in clinical analysis [14], in embryology [15], in the study of the placenta's metabolome in preeclampsia [16], and for screening of neonates for inborn errors of metabolism [17]. However, we are not aware of a published database of metabolite mobilities.
In this paper, we tabulate the electrophoretic mobility of 276 compounds from a commercial metabolite library. We report the first use of a multiple injection protocol to increase the sample throughput in the characterization of a metabolite library, and we use a published two-marker normalization method for reproducible mobilities [18].
2. Materials & methods
2.1. Materials
The Mass Spectrometry Metabolite Library (IROA Technologies), spermidine, guanosine 5′-monophosphate, and formic acid (FA) were purchased from MilliporeSigma (Burlington, MA). Hydrofluoric acid (HF) was purchased from Fisher Scientific (Pittsburgh, PA). Methanol and water were purchased from Honeywell Burdick & Jackson (Wicklow, Ireland).
2.2. Metabolite library sample preparation
Compounds were reconstituted according to the manufacturer's specifications in 5% methanol. After reconstitution, samples were acidified by adding an ammonium formate buffer (pH 2.7) to a final concentration of 10 mM.
2.3. CZE-ESI-MS analysis
Samples were injected using a PrinCE Next 840 capillary electrophoresis injection system (Prince Technologies, Emmen, Netherlands). CZE separation was performed using an uncoated fused silica capillary (50 μm i.d. × 360 μm o.d. × 70 cm length, Polymicro Technologies, Phoenix, AZ). The distal end of the capillary was etched using hydrofluoric acid to reduce its outer diameter to ~50 μm, which results in improved sensitivity [19]. APPROPRIATE SAFETY PRECAUTIONS SHOULD BE USED WHEN HANDLING HF. The temperatures of the capillary (20 °C), buffer (20 °C), and sample trays (10 °C) were controlled during experiments. The background electrolyte for the separation was 0.5% (v/v) FA and 5% (v/v) methanol. The capillary was preconditioned by rinsing with 0.5% (v/v) FA and 50% (v/v) methanol followed by the background electrolyte at 50 psi for 10 min.
CZE was coupled to ESI-MS via a third generation electrokinetically pumped sheath-flow nanospray interface [19,20]. An electrospray emitter was prepared from a borosilicate glass tube (0.75mm i.d. × 1.0mm o.d. × 10 cm length). The tubing was pulled to a 10–12 μm outer diameter tip using a P-1000 flaming/brown micropipette puller (Sutter Instruments, Novato, CA) and mounted in the interface. The sheath electrolyte was the same as the background electrolyte used for the separation. During separation, 30 kV was applied at the injection end of the capillary and 1.45 kV was applied at the sheath buffer reservoir to maintain a stable spray using a Bertan Series 230 high-voltage power supply.
An LTQ XL mass spectrometer (Thermo Fisher Scientific, Waltham, MA) was operated in positive ion mode. A full scan MS was acquired from m/z 60 to 950, followed by two data-dependent MS/MS events on the two most intense ions. The scan range was modified for compounds that fell outside the specified range. One micro scan was set for each MS and MS/MS scan. The dynamic exclusion function was set as follows: repeat count, 1 s; repeat duration, 5 s; exclusion duration, 5 s. The target value was 3.00 × 10⁴ with a 50 ms maximum injection time. Collision-induced dissociation (CID) was performed at the normalized collision energy of 35% and the activation time was set as 30 ms. To minimize the fragmentation of metabolites, the mass spectrometer was operated at the following parameters: the ion transfer capillary temperature was 325 °C, and the capillary and tube lens voltages were 5 V and 40 V, respectively.
To reduce analysis time, six metabolites were analyzed in one run by a sequential injection method using the autosampler for hydrodynamic injection. A set of six analyte was sequentially injected with 1.0 psi, 5 s pressure pulses; the capillary tip was washed in background electrolyte between each injection to minimize sample cross-contamination. After injection of samples, a mixture of two mobility markers (spermidine and guanosine 5′-monophosphate) was injected. If a metabolite was not detected, a separate run was performed with an increased injection time up to 60 s.
To obtain the migration times for individual metabolites, the electropherograms were fit using the bigaussian function in OriginPro software (OriginLab Corporation, Northampton, MA) to correct for peak asymmetry and identify the peak apex. To ensure migration time reproducibility of the individual metabolites between the experiments, two migration markers were used to correct for run-to-run variations in electroosmotic and electrophoretic mobilities [18].
3. Results & discussion
Approximately 460 compounds from a commercially available library were available for MS analysis (Table S2). Of those, 276 metabolites were successfully analyzed using the sequential injection CZE-MS method. Compounds and mobilities are listed in Table S1.
3.1. CE optimization: Background electrolyte (BGE) and sample buffer conditions
The ionization efficiency of electrospray ionization depends on spray composition [21], and both pH and the presence of organic solvents have a significant impact on ESI/MS sensitivity [22]. We evaluated background electrolyte compositions including ammonium formate buffers at pH 2.7, 3.5, 4,5 with methanol concentrations of 0, 5%, and 10%. We found a combination of 0.5% formic acid and 5% methanol provided optimal signal-to-noise ratio and run-to-run reproducibility for the metabolites in our library.
To improve the detection limit, sample stacking was used to concentrate the injected analyte [23]. Sample stacking was executed by introducing a sample at a different pH than the BGE to exploit the difference in sample mobility between the different zones.
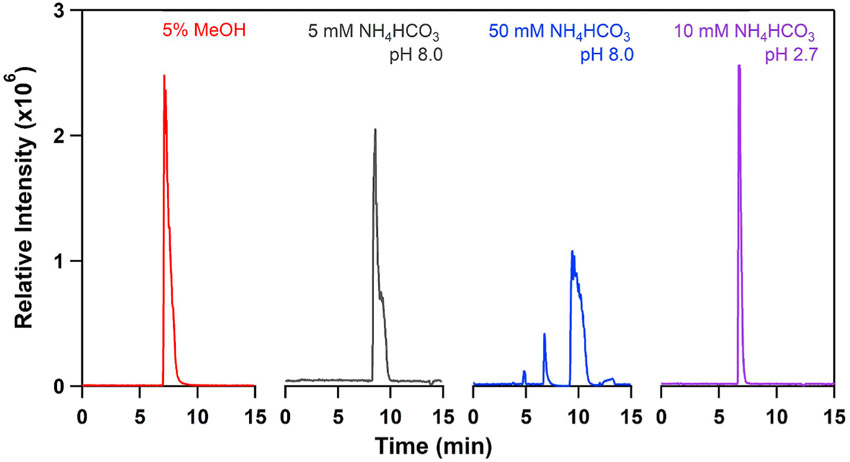
We performed an optimization of the sample solution using l-histidine as a model analyte. Injecting l-histidine in a basic solution resulted in significant peak broadening, Fig. 1, and offered no advantage over introducing the sample in 5% methanol. Increasing the pH of the solution only exacerbated the situation. The best result was obtained using 10mM ammonium formate buffer, which resulted in sample stacking and a much narrower peak.
Fig. 1.
Effect of the sample solution composition on histidine peak shape in CZE.
3.2. Mass spectrometer tuning
One of the issues in small molecule mass spectrometry analysis is the tendency for the molecular ion to undergo complex fragmentation. While fragmentation provides information about the molecule's structure, the absence of the molecular ion as a reference peak makes it very difficult to interpret the spectra. This problem is exacerbated in untargeted metabolomics studies, where compounds often produce overlapping peaks during separation [5].
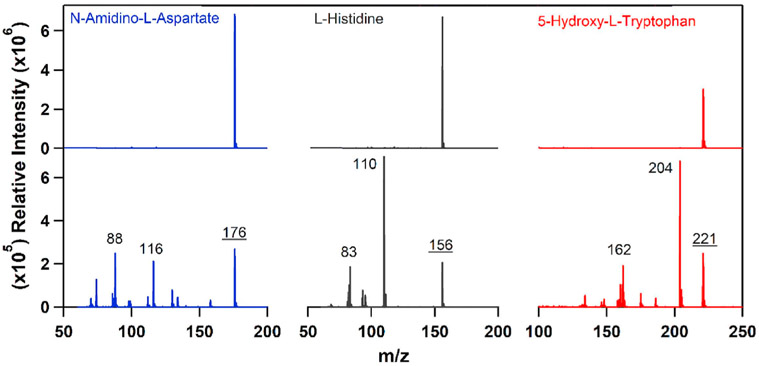
To minimize the fragmentation, we screened three representative compounds (N-amidino-l-aspartate, l-histidine, and 5-hydroxyl-l-tryptophan) under different acquisition settings. As expected, under unoptimized conditions, the compounds show a complex fragmentation pattern with the molecular ion not being the base peak (Fig. 2). We varied the temperature of the ion transfer capillary, capillary voltage, and tube lens voltage until we obtained molecular ions for the three target compounds. The optimized conditions are presented in the experimental section of this paper.
Fig. 2.
Comparison of optimized (top) and non-optimized (bottom) mass spectra.
3.3. Sample multiplexing using sequential injections
Although the commercial library is specified to contain over 600 compounds, a set of wells was empty, leaving 460 compounds for analysis. A typical electrophoretic separation requires roughly half an hour, and it would be very tedious to analyze the metabolites one by one. Pooling of several compounds before injection is an obvious way to increase analysis throughput, where compounds are mixed before injection and mass spectrometry provides identification of the compounds after separation. This simple strategy has two disadvantages. First, mixing of components leads to component dilution. Second, the mixed compounds are no longer available for other use. To address these issues, we developed a sequential injection multiplexing approach. Samples are placed into the autoinjector in separate vials and are sequentially injected into the capillary. In this case, the samples are not diluted, are recoverable, and can be reanalyzed individually if required or used for further analysis using a different method.
Sequential injection can introduce migration time bias. During the injection process, the analytes that are injected first are located further from the capillary injection site than the analytes that are injected last, and thus start migrating during the separation from a different position in the capillary, leading to inaccurate mobility values.
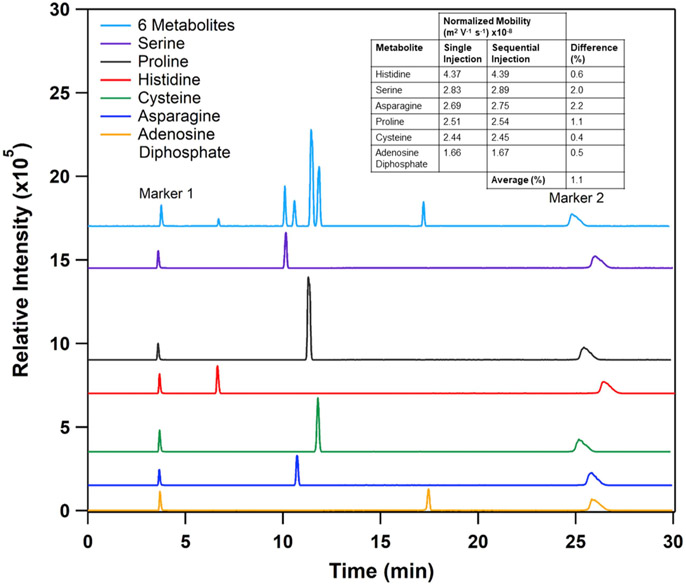
To determine the effect of the sequential injection approach on the accuracy of migration times of individual compounds, we selected six representative compounds from the library (adenosine diphosphate, asparagine, cysteine, histidine, proline, and serine). The selected compounds were premixed with mobility markers (spermidine and guanosine 5′-monophosphate) and were separately injected into a capillary (Fig. 3). In a subsequent experiment, the selected analytes were sequentially injected into a capillary followed by a single injection of marker mix (Fig. 3). The migration time was again measured and compared with the migration times of the analytes from the single injection experiments. We found that the average difference between the mobilities measured by the individual and sequential injections methods was around 1% (Fig. 3), which is similar to the precision in our mobility measurements and is comparable with HPLC-based methods.
Fig. 3.
Comparison between the sequential and individual injection methods. Top trace – sequential injection of six metabolites. Bottom six traces – electropherogram generated for each compound. Traces are offset for clarity.
3.4. Database generation
We generated a database of the mobility of the library of metabolites. Compound screening was first performed using sequential injection. Selected ion electropherograms were generated using the molecular weight of the compounds as provided by the manufacturer. If the compounds were not detected in the sequential injection protocol, they were reanalyzed with an increased injection time up to 60 s. Mobilities obtained from duplicate runs were averaged and are presented in supporting information Table S1.
We obtained mobility data for 276 compounds (Table S1), yielding a 60% success rate for the entire reference library. Migration times were corrected based on a two-point normalization process that compares the analyte's migration time with two internal standards [18]. This process resulted in an average standard deviation in mobility of 0.01 × 10⁻⁸ m2V−1s−1, and the data in Table S1 are truncated at that value.
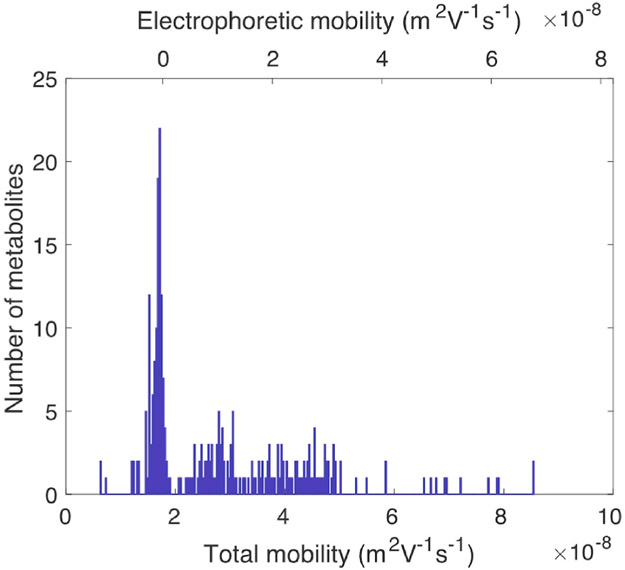
The use of an uncoated capillary resulted in significant electroosmotic flow, and the total mobility is the sum of electroosmotic mobility plus the analyte's electrophoretic mobility, μtotal = μelectroosmosis + μelectrophoresis· Fig. 4 presents a histogram of the mobility for the set of metabolites. The total mobilities (bottom axis) are distributed from 6.2 × 10⁻⁹ to 8.6 × 10⁻⁸m2/V. The lowest mobility is observed for nicotinamide hypoxanthine dinucleotide, which is an anion at the pH of our background electrolyte and has negative electrophoretic mobility. The highest mobility is observed for spermine, which is a dication at the pH of the background electrolyte.
Fig. 4.
Total mobility (bottom axis) and electrophoretic mobility (top axis) determined for 276 metabolites. The average standard deviation in mobility is ~0.01 × 10⁻⁸ m2V−1s−1.
There is a cluster of metabolites with total mobility near 1.7 × 10⁻⁸m2/V. This cluster is dominated by neutral metabolites that act as markers for electroosmosis. The electrophoretic mobility is determined by subtracting the electroosmotic mobility from the total mobility, and is shown in the top axis of Fig. 4.
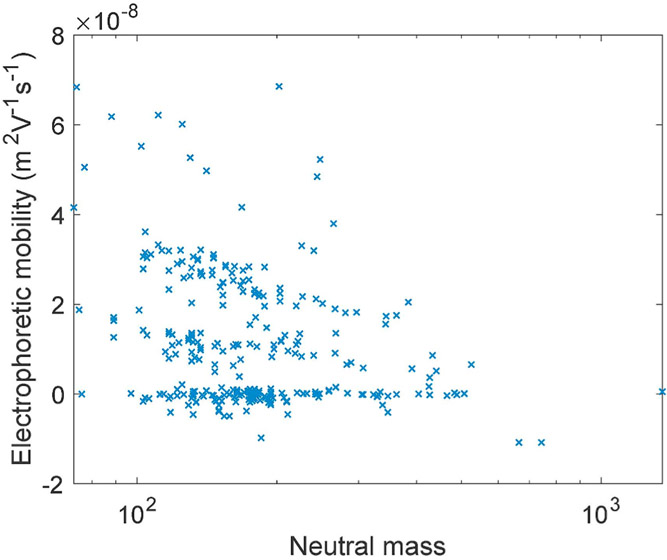
Fig. 5 presents a plot of electrophoretic mobility as a function of the metabolites' neutral mass. Models for mobility are functions of the analyte's solution-phase charge-to-size ratio [24]. Uncharged metabolites have zero electrophoretic mobility, irrespective of their mass. The mobility of charged metabolites in Fig. 5 tends to decrease with the metabolites' mass, but the relationship is complex due to the complicated relationships of solution-phase charge and hydrodynamic radius on the metabolites' mass.
Fig. 5.
Relationship between electrophoretic mobility and metabolites' mass. Note that mass is plotted on a logarithmic scale.
4. Conclusion
W have introduced a CZE method for the efficient processing of metabolite libraries. We have demonstrated that the sequential injection method has comparable migration time accuracy to a single compound analysis approach, while offering significant time-savings compared to a one-by-one analysis of the library. We have screened a commercially available library and report electrophoretic mobilities of 276 of these compounds. Electrophoretic mobilities are tabulated with ~1% precision in a 5% formic acid/5% methanol background electrolyte at 20 °C. We did not evaluate detection limits for these compounds because the ancient ion-trap mass spectrometer used in this paper provides much poorer performance than modern Orbitrap instruments; the CZE interface used in this manuscript as been used to detect 600 molecules of a peptide injected into an electrophoresis capillary [25].
Several challenges that were observed, including partial degradation of the samples, adsorption of the metabolites to a capillary walls during separation, and difficulty of ionization of neutral metabolites such as fatty acids and lipids. Our observation that a single experimental condition would permit analysis of all possible metabolites is not surprising and highlights the need for a high-throughput method that can rapidly generate libraries of metabolomics standards.
A companion manuscript provides a database of surface enhanced Raman spectra for many of these compounds [25]. These databases should be useful resources for future metabolomics investigations.
Supplementary Material
Acknowledgments
This work was supported by a grant from the National Institutes of Health (R01GM096767; N.J.D.) in addition to the National Science Foundation under grant number NSF/CHE-1709881 (LMS. and J.P.C.). Any opinions, findings, and conclusions or recommendations expressed in this material are those of the authors and do not necessarily reflect the views of the National Science Foundation. We thank Dr. William Boggess in the Notre Dame Mass Spectrometry and Proteomics Facility for his help with this project.
Footnotes
Declaration of competing interest
NJD is a co-inventor on the electrospray interface used in this paper and receives royalties from its sale. The authors declare no other conflicts of interest in this work.
Appendix A. Supplementary data
Supplementary data to this article can be found online at https://doi.org/10.1016/j.talanta.2019.120545.
References
- [1].Dunn WB, Ellis DI, Metabolomics: current analytical platforms and methodologies, Trends Anal. Chem 24 (2005) 285–294. [Google Scholar]
- [2].Fujisaka S, Avila-Pacheco J, Soto M, Kostic A, Dreyfuss JM, Pan H, Ussar S, Altindis E, Li N, Bry L, Clish CB, Kahn CR, Diet, genetics, and the gut microbiome drive dynamic changes in plasma metabolites, Cell Rep. 22 (2018) 3072–3086. [DOI] [PMC free article] [PubMed] [Google Scholar]
- [3].Seaman DA, Guglielmo CG, Williams TD, Effects of physiological state, mass change and diet on plasma metabolite profiles in the western sandpiper Calidris mauri, J. Exp. Biol 208 (2005) 761–769. [DOI] [PubMed] [Google Scholar]
- [4].Gorrochategui E, Jaumot J, Lacorte S, Tauler R, Data analysis strategies for targeted and untargeted LC-MS metabolomic studies: overview and workflow, Trends Anal. Chem 82 (2016) 425–442. [Google Scholar]
- [5].Schrimpe-Rutledge AC, Codreanu SG, Sherrod SD, McLean JA, Untargeted metabolomics strategies-challenges and emerging directions, Am. Soc. Mass Spectrom 27 (2016) 1897–1905. [DOI] [PMC free article] [PubMed] [Google Scholar]
- [6].Sumner LW, Amberg A, Barrett D, Beale MH, Beger R, Daykin CA, Fan TW, Fiehn O, Goodacre R, Griffin JL, et al. , Proposed minimum reporting standards for chemical analysis chemical analysis working group (CAWG) metabolomics standards initiative (MSI), Metabolomics 3 (2007) 211–221. [DOI] [PMC free article] [PubMed] [Google Scholar]
- [7].Wang M, Carver JJ, Phelan VV, Sanchez LM, Garg N, Peng Y, Nguyen DD, Watrous J, Kapono CA, Luzzatto-Knaan T, et al. , Sharing and community curation of mass spectrometry data with global natural products social molecular networking, Nat. Biotechnol. 34 (2016) 828–837. [DOI] [PMC free article] [PubMed] [Google Scholar]
- [8].Wishart DS, Feunang YD, Marcu A, Guo AC, Liang K, Vázquez-Fresno R, Sajed T, Johnson D, Li C, Karu N, Sayeeda Z, Lo E, Assempour N, Berjanskii M, Singhal S, Arndt D, Liang Y, Badran H, Grant J, Serra-Cayuela A, Liu Y, Mandal R, Neveu V, Pon A, Knox C, Wilson M, Manach C, Scalbert A, Hmdb 4.0: the human metabolome database for 2018, Nucleic Acids Res. 46 (2018) D608–D617. [DOI] [PMC free article] [PubMed] [Google Scholar]
- [9].Ramirez-Gaona M, Marcu A, Pon A, Guo AC, Sajed T, Wishart NA, Karu N, Djoumbou Feunang Y, Arndt D, Wishart DS, Ymdb 2.0: a significantly expanded version of the yeast metabolome database, Nucleic Acids Res. 45 (2017) D440–D445. [DOI] [PMC free article] [PubMed] [Google Scholar]
- [10].Blaženović I, Kind T, Sa MR, Ji J, Vaniya A, Wancewicz B, Roberts BS, Torbašinović H, Lee T, Mehta SS, et al. , Structure annotation of all mass spectra in untargeted metabolomics, Anal. Chem 91 (2019) 2155–2162. [DOI] [PMC free article] [PubMed] [Google Scholar]
- [11].Simón-Manso Y, Marupaka R, Yan X, Liang Y, Telu KH, Mirokhin Y, Stein SE, Mass spectrometry fingerprints of small-molecule metabolites in biofluids: building a spectral library of recurrent spectra for urine analysis, Anal. Chem 91 (2019) 12021–12029. [DOI] [PMC free article] [PubMed] [Google Scholar]
- [12].Rafferty JL, Zhang L, Siepmann JI, Schure MR, Retention mechanism in reversed-phase liquid chromatography: a molecular perspective, Anal. Chem 79 (2007) 6551–6558. [DOI] [PubMed] [Google Scholar]
- [13].López-Gonzálvez A, Godzien J, García A, Barbas C, Capillary electrophoresis mass spectrometry as a tool for untargeted metabolomics, Methods Mol. Biol 1978 (2019) 55–77. [DOI] [PubMed] [Google Scholar]
- [14].Ramautar R, Capillary electrophoresis-mass spectrometry for clinical metabolomics, Adv. Clin. Chem 74 (2016) 1–34. [DOI] [PubMed] [Google Scholar]
- [15].Portero EP, Nemes P, Dual cationic-anionic profiling of metabolites in a single identified cell in a live Xenopus laevis embryo by microprobe CE-ESI-MS, Analyst 144 (2019) 892–900. [DOI] [PMC free article] [PubMed] [Google Scholar]
- [16].Kawasaki K, Kondoh E, Chigusa Y, Kawamura Y, Mogami H, Takeda S, Horie A, Baba T, Matsumura N, Mandai M, Konishi I, Metabolomic profiles of placenta in preeclampsia, Hypertension 73 (2019) 671–679. [DOI] [PubMed] [Google Scholar]
- [17].Shanmuganathan M, Britz-McKibbin P, New advances for newborn screening of inborn errors of metabolism by capillary electrophoresis-mass spectrometry (CE-MS), Methods Mol. Biol 1972 (2019) 139–163. [DOI] [PubMed] [Google Scholar]
- [18].Li X-F, Ren H, Le X, Qi M, Ireland ID, Dovichi NJ, Migration time correction for the analysis of derivatized amino acids and oligosaccharides by micellar capillary electrochromatography, J. Chromatogr. A 869 (2000) 375–384. [DOI] [PubMed] [Google Scholar]
- [19].Sun L, Zhu G, Zhao Y, Yan X, Mou S, Dovichi NJ, Ultrasensitive and fast bottom-up analysis of femtogram amounts of complex proteome digests, Angew. Chem. Int. Ed. Engl 52 (2013) 13661–13664. [DOI] [PMC free article] [PubMed] [Google Scholar]
- [20].Sun L, Zhu G, Zhang Z, Mou S, Dovichi NJ, Third-generation electrokinetically pumped sheath-flow nanospray interface with improved stability and sensitivity for automated capillary zone electrophoresis–mass spectrometry analysis of complex proteome digests, J. Proteome Res 14 (2015) 2312–2321. [DOI] [PMC free article] [PubMed] [Google Scholar]
- [21].Kostiainen R, Kauppila TJ, Effect of eluent on the ionization process in liquid chromatography–mass spectrometry, J. Chromatogr. A 1216 (2009) 685–699. [DOI] [PubMed] [Google Scholar]
- [22].Gao S, Zhang Z-P, Karnes HT, Sensitivity enhancement in liquid chromatography/atmospheric pressure ionization mass spectrometry using derivatization and mobile phase additives, J. Chromatogr. B 825 (2005) 98–110. [DOI] [PubMed] [Google Scholar]
- [23].Malá Z, Křivánková L, Gebauer P, Boček P, Contemporary sample stacking in CE: a sophisticated tool based on simple principles, Electrophoresis 28 (2007) 243–253. [DOI] [PubMed] [Google Scholar]
- [24](a).Krokhin OV, Anderson G, Spicer V, Sun L, Dovichi NJ, Predicting electrophoretic mobility of tryptic peptides for high-throughput CZE-MS analysis, Anal. Chem 89 (2017) 2000–2008; [DOI] [PMC free article] [PubMed] [Google Scholar]; (b) Amenson-Lamar EA, Sun L, Zhang Z, Bohn PW, Dovichi NJ, Detection of 1 zmol injection of angiotensin using capillary zone electrophoresis coupled to a Q-Exactive HF mass spectrometer with an electrokinetically pumped sheath-flow electrospray interface, Talanta 204 (2019) 70–73. [DOI] [PMC free article] [PubMed] [Google Scholar]
- [25].Sherman LM, Petrov AP, Karger LFP, Tetrick MG, Dovichi NJ, Camden JP, A Surface-Enhanced Raman Spectroscopy Database of 63 Metabolites. (Talanta, companion article in this issue). [DOI] [PMC free article] [PubMed]
Associated Data
This section collects any data citations, data availability statements, or supplementary materials included in this article.


