Abstract
The human integral membrane protein SERINC5 potently restricts HIV-1 infectivity and sensitises the virus to antibody-mediated neutralisation. Here, using cryo-electron microscopy, we determined the structures of human SERINC5 and its ortholog from Drosophila melanogaster at sub-nm and near-atomic resolution, respectively. The structures reveal a novel fold comprised of ten transmembrane helices organised into two subdomains and bisected by a long diagonal helix. A lipid binding groove and clusters of conserved residues highlight potential functional sites. A structure-based mutagenesis scan identified surface-exposed regions and the interface between the subdomains of SERINC5 as critical for HIV-1 restriction activity. The same regions are also important for viral sensitisation to neutralising antibodies, directly linking the antiviral activity of SERINC5 with remodelling of the HIV-1 envelope glycoprotein.
Host organisms employ a range of mechanisms to impede replication of pathogens, and the latter evolve countermeasures to circumvent the innate immunity of their hosts1. One such antagonistic interaction involves the human transmembrane protein SERINC5, which when incorporated into budding HIV-1 virions, can strongly inhibit their subsequent entry into target cells2,3. To negate the effect of SERINC5, HIV-1 encodes the endocytic adaptor protein Nef, which redirects this restriction factor, normally present in the plasma membrane, to endosomal compartments, thereby preventing its inclusion into budding viral particles2,3. The ability to ablate plasma membrane-associated SERINC proteins is conserved among retroviruses2–5, suggesting a strong evolutionary pressure to prevent virion incorporation of these host factors. Exclusive to eukaryotes, SERINCs share high amino acid identity among themselves (Supplementary Table 1) but lack homology to any other known protein family. The term SERINC was coined after the proposed role of serine incorporation into membranes during lipid biosynthesis6. However, this function has so far not found independent confirmation, and mass spectrometry analyses failed to detect SERINC-dependent changes in cellular or virion lipid composition7,8. The human genome encodes five SERINC paralogs, of which one, SERINC2, lacks the HIV-1 restriction activity9,10. Recent studies highlighted associations of SERINC genes with autism11, borderline personality disorders12, alcohol dependence13, and cancerogensis14–17.
SERINC5 inhibits HIV-1 infectivity by specifically interfering with viral entry2,3, although the precise mode of restriction remains enigmatic. HIV-1 particles assemble at lipid rafts within plasma membrane and utilize host endosomal sorting complexes required for transport (ESCRT) machinery to bud from the infected cell (reviewed in ref. 18). Following their maturation, virions infect target cells through fusion of the viral and host cell membranes. This process is orchestrated by the viral envelope glycoprotein (Env), which is a trimer comprised of the surface glycoprotein gp120 and the single-pass transmembrane subunit gp41, (gp41-gp120)3. A series of conformational changes within HIV-1 Env, triggered by the interaction of gp120 with CD4 and a co-receptor (CCR5 or CXCR4) on surface of a target cell, lead to the insertion of the gp41 fusion peptide into the target cell plasma membrane. The subsequent collapse of the gp41 structure into a 6-helix bundle is believed to initiate the fusion of viral and host cell membranes19. HIV-1 Env is highly variable, and individual viral isolates display vastly different sensitivities to neutralizing antibodies and restriction by SERINC5. Thus, while SERINC5 can ablate infectivity of the HIV-1 clone NL4-3, it has only a modest effect on the tier 2 and 3 HIV-1 isolates, such as JRFL2,3,10,20,21. Nevertheless, JRFL becomes considerably more sensitive to some neutralizing antibodies and the CCR5 antagonist Maraviroc in the presence of SERINC5, suggesting that the restriction factor exerts a direct effect on the conformation of HIV-1 Env10,20.
Here we present the three-dimensional structure of a SERINC family member to near-atomic resolution and show that the observed conformation is consistent with that of human SERINC5, which we resolved at sub-nm resolution. Additionally, using an extensive panel of amino acid substitutions, we identify the regions of SERINC5 that are critical for its antiviral activities.
Results
Structure determination of Drosophila melanogaster SERINC.
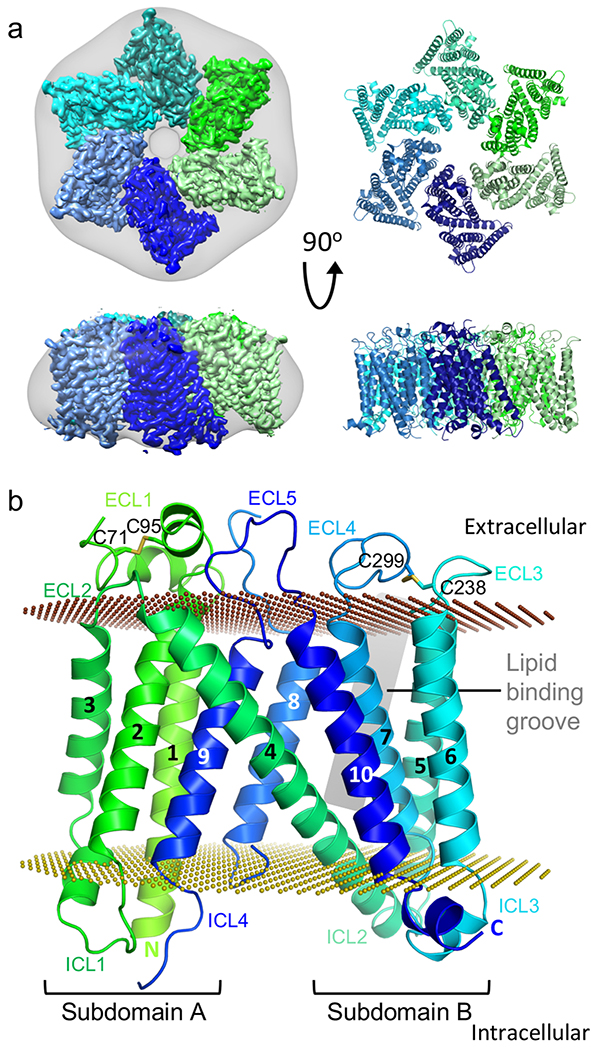
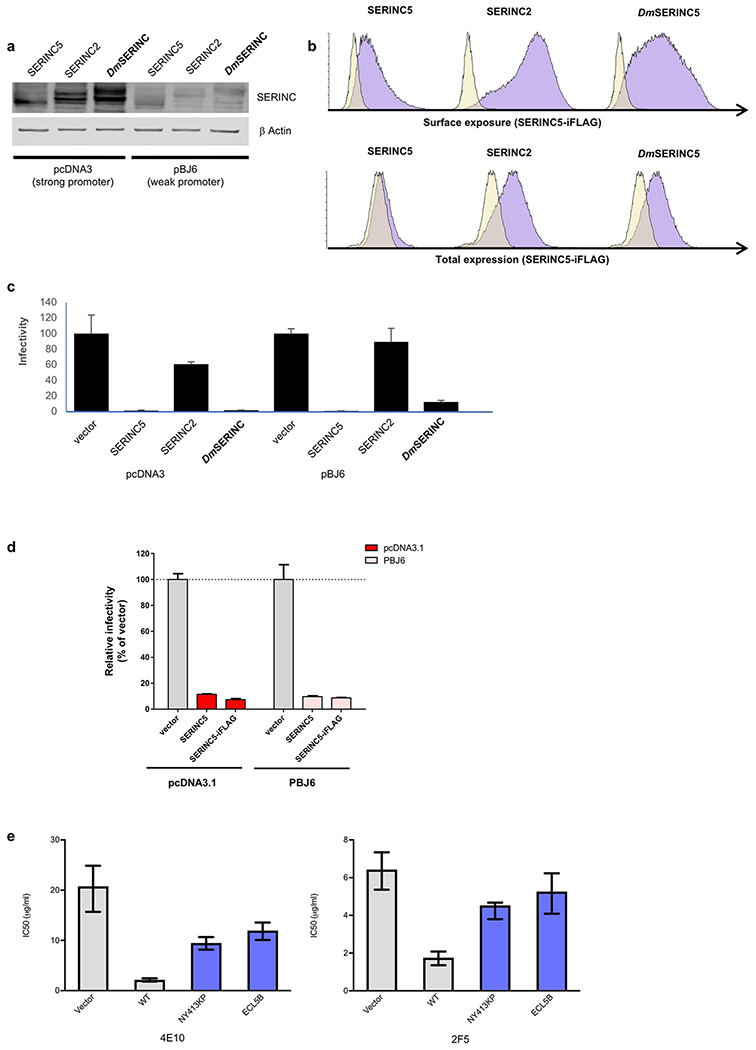
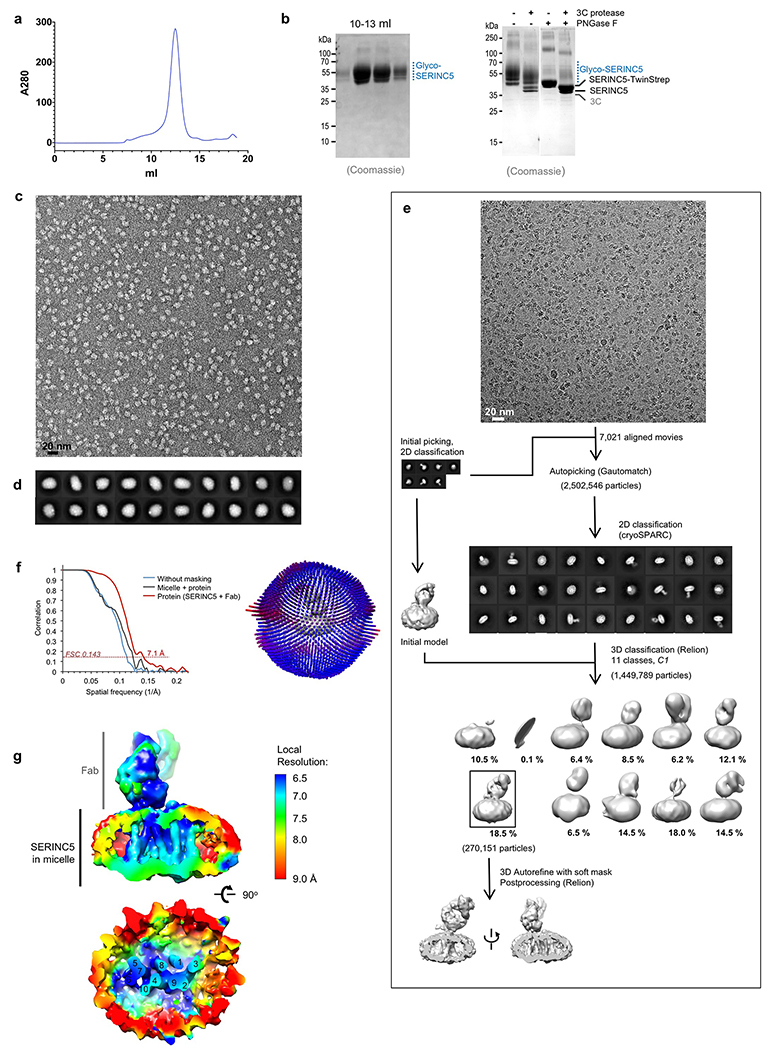
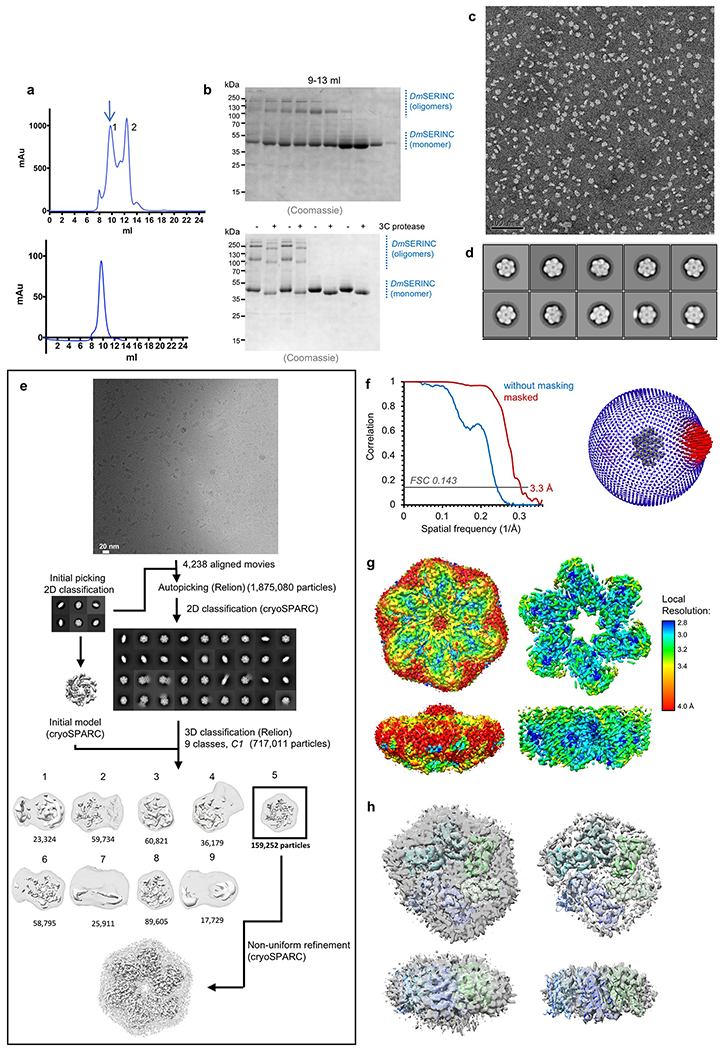
The fly possesses a single SERINC ortholog (referred to here as DmSERINC, and also known as TMS1) that shares 36% amino acid sequence identity with human SERINC5 (Supplementary Table 1). Ectopic expression of DmSERINC during production of Nef-deficient HIV-1 virions strongly suppressed their infectivity (Extended Data Fig. 1 a–c), confirming conservation of functional restriction by the insect ortholog. To structurally characterise the SERINC family of proteins, we produced recombinant human SERINC5 and DmSERINC in human and yeast cells, respectively. When subjected to chromatography through a 24-ml Superdex-200 sizing column, SERINC5 migrated as a single peak with elution volume of 12 ml. Imaging negatively-stained material from this peak revealed featureless micelles, which failed to produce discrete 2D averages (Extended Data Fig. 2a–d). By contrast, separation of DmSERINC resulted in an additional species eluting at 9.8 ml, containing well-defined assemblies with prominent six-fold symmetry (Extended Data Fig. 3a–d). Encouraged by these results, we acquired micrograph movies of frozen-hydrated DmSERINC from this fraction. Image processing of single particles resulted in a 3D reconstruction to an overall resolution of 3.3 Å with a local resolution of 2.8-3 Å for the majority of the protein (Extended Data Fig. 3e–g). Atomic coordinates were built ab initio into the cryo-EM map revealing the details of the homo-hexameric DmSERINC structure (Fig. 1a,b, Table 1 and Supplementary Video 1).
Figure 1 |. The structure of DmSERINC.
a, Cryo-EM map of the hexamer with each protomer individually colored; the map was Gaussian filtered with a standard deviation of 5 Å to represent the detergent micelle, grey (left) and a cartoon representation of the DmSERINC hexamer (right). b, Detailed representation of an isolated monomer, colored in green to dark blue gradient from N- to C-terminus with transmembrane alpha helices numbered and loops labelled (intracellular loops (ICL) and extracellular loops (ECL)). The position of the lipid groove is indicated by a grey rectangle. Disulphide bonds are labelled and shown in stick format. The outer and inner plasma membrane surfaces are depicted as chocolate and olive dotted planes, respectively.
Table 1.
Cryo-EM data collection, refinement and validation statistics
| DmSERINC (EMD-10279, PDB 6SP2) | SERINC5 (EMD-10277) | |
|---|---|---|
| Data collection and processing | ||
| Magnification | 36,232 | 128,440 |
| Voltage (kV) | 300 | 300 |
| Electron exposure (e−/Å2) | 50 | 33.6 |
| Defocus range (μm) | −1.6 to −4 | −1.6 to −4 |
| Pixel size (Å) | 1.38 | 1.09 |
| Symmetry imposed | C6 | C1 |
| Initial particle images (no.) | 1,857,080 | 2,502,546 |
| Final particle images (no.) | 159,252 | 270,151 |
| Map resolution (Å) | 3.3 | 7.1 |
| FSC threshold | 0.143 | 0.143 |
| Map resolution range (Å) | 2.8-50.0 | 6.5-50 |
| Refinement | ||
| Model resolution (Å) | 3.3 | |
| FSC threshold | 0.143 | |
| Model resolution range (Å) | 2.8-4.0 | |
| Map sharpening B factor (Å2) | −186.2 | |
| Model composition | ||
| Nonhydrogen atoms | 18,498 | |
| Protein residues | 2,190 | |
| Ligands | CDL:6, LMN:12, P5S:6 | |
| B factors (Å2) | ||
| Protein | 150.59 | |
| Ligand | 163.13 | |
| R.m.s. deviations | ||
| Bond lengths (Å) | 0.004 | |
| Bond angles (°) | 0.72 | |
| Validation | ||
| MolProbity score | 1.77 | |
| Clashscore | 8.22 | |
| Poor rotamers (%) | 0.0 | |
| Ramachandran plot | ||
| Favored (%) | 95.28 | |
| Allowed (%) | 4.72 | |
| Disallowed (%) | 0 |
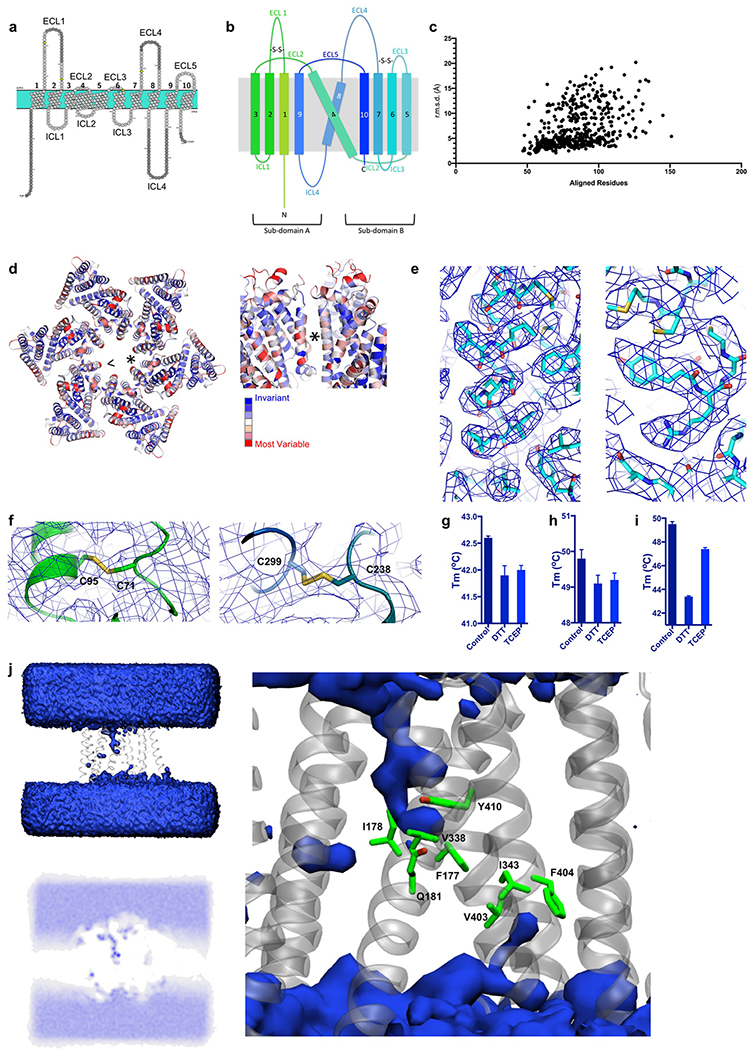
Each of the six identical DmSERINC subunits consists of ten transmembrane helices (TM) arranged into two subdomains revealing a tertiary fold that is ~35 Å by ~50 Å in the membrane plane and ~50 Å traversing the membrane (Fig. 1b). A 39-residue-long α-helix (TM4) spans the membrane diagonally intersecting subdomain A (TM1, TM2, TM3, TM9) and subdomain B (TM5, TM6, TM7 and TM10). A shorter diagonal α-helix TM8 crosses back from subdomain B to A, forming an asymmetrical cross with TM4 in the centre. Two disulphide bonds are identified on the extracellular side: one within extracellular loop (ECL) 1 (Cys71-Cys95, conserved in most species except plants and some lower eukaryotes) and one between ECL3 and ECL4 (Cys238-Cys299, conserved throughout the SERINC family) (Fig. 1b, Extended Data Fig. 4f, Supplementary Table 1 and Supplementary Video 1). Concordantly, exposure of DmSERINC and SERINC5 to reducing agents decreased their thermostability (Extended Data Fig. 4g–i). The disulphide bonds and the location of ECL4, the equivalent of which harbours glycosylated Asn294 in SERINC522, confirms the assigned orientation within the plasma membrane, with both the N- and C-termini of the protein residing in the cytoplasm (Fig. 1b, Supplementary Table 1 and Extended Data Fig. 4a,b).
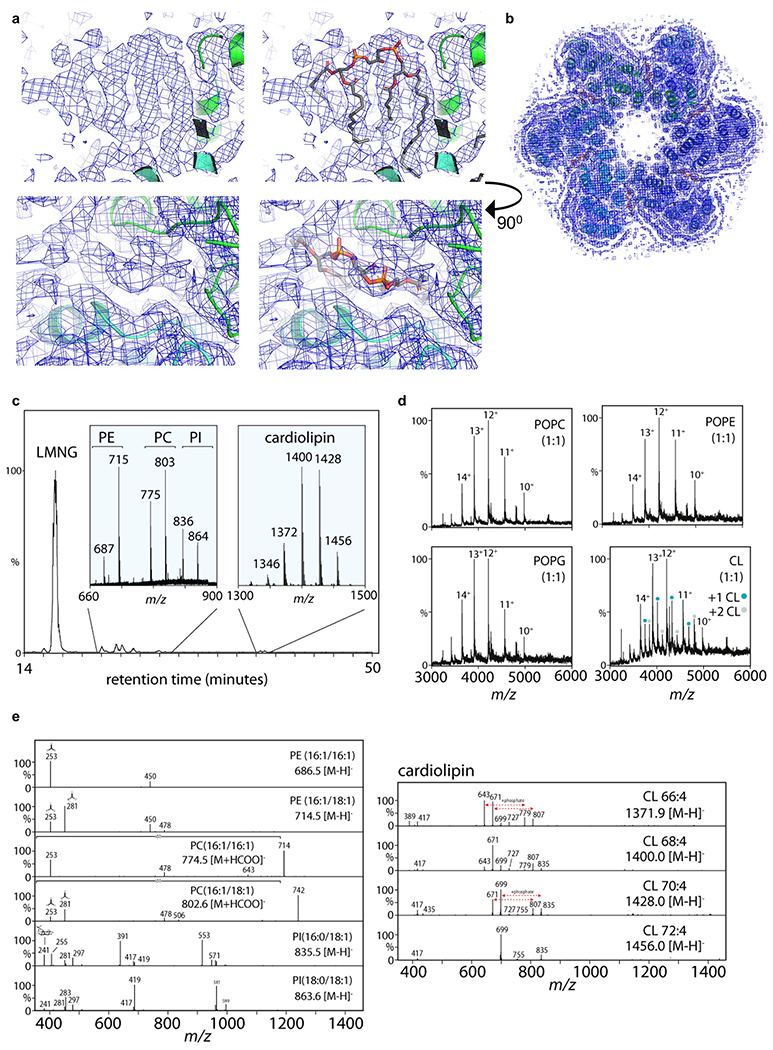
A query of the wwPDB using the Dali server23 did not identify proteins sharing extensive structural similarity with DmSERINC (Extended Data Fig. 4c). Accordingly, the DmSERINC structure represents a novel membrane protein fold. We considered if the hexameric arrangement of DmSERINC was characteristic of the SERINC family. Protomer interface contacts bury 958 Å2, comprising only 5.3% of the total DmSERINC monomer surface. Furthermore, the interfaces are devoid of conserved amino acid residues (Extended Data Fig. 4d) and are largely lipid-mediated. Based on the cryo-EM map, we assigned one of the protomer-bridging lipids as cardiolipin and confirmed its presence in our DmSERINC preparations by mass spectrometry (Extended Data Fig. 5). Consistent with the structure, we observed binding of up to two molecules of cardiolipin per DmSERINC monomer (Extended Data Fig. 5e). We conclude that while the hexameric state of DmSERINC made it conducive to high-resolution cryo-EM that afforded de novo model building, it may not be conserved throughout the protein family. Accordingly, we readdressed structural characterisation of human SERINC5 (see below).
Potential functional features of SERINC.
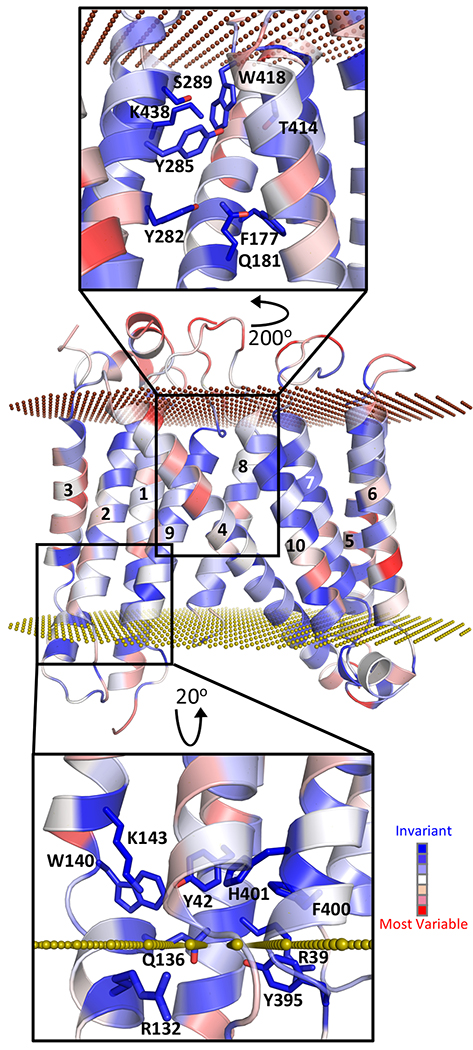
Exploring the DmSERINC structure further, we identified clusters of highly-conserved residues, which may represent functional sites in the fold (Fig. 2). Within subdomain A, lipid-buried Lys143 assembles with Tyr42, Gln136, Trp140, Tyr395, and His401 to form a small pocket at the membrane-cytosol interface (Fig. 2, bottom). At the extracellular side of the structure, Gln181, Tyr282, Tyr285, Ser289, Lys438, and Thr414 line a hydrophilic cleft between the two subdomains that is corked by Trp418. This crevice extends half-way through the lipid bilayer, where it is plugged by invariant Phe177 (Fig. 2, top). Molecular dynamics simulations of lipid-embedded DmSERINC suggested that solvent molecules can freely enter the space between the subdomains (Extended Data Fig. 4j). Searching structural databases with ProFunc24 did not reveal similarity of either conserved pocket to any of the known functional sites.
Figure 2 |. Potential functional sites identified in SERINC structure.
Sequence conservation mapped onto the DmSERINC structure, with invariant residues in dark blue and most variable in red; the outer and inner plasma membrane surfaces are depicted as chocolate and olive dotted planes, respectively. The insets show details of the hydrophilic cleft between the subdomains (top) and a highly conserved pocket (bottom).
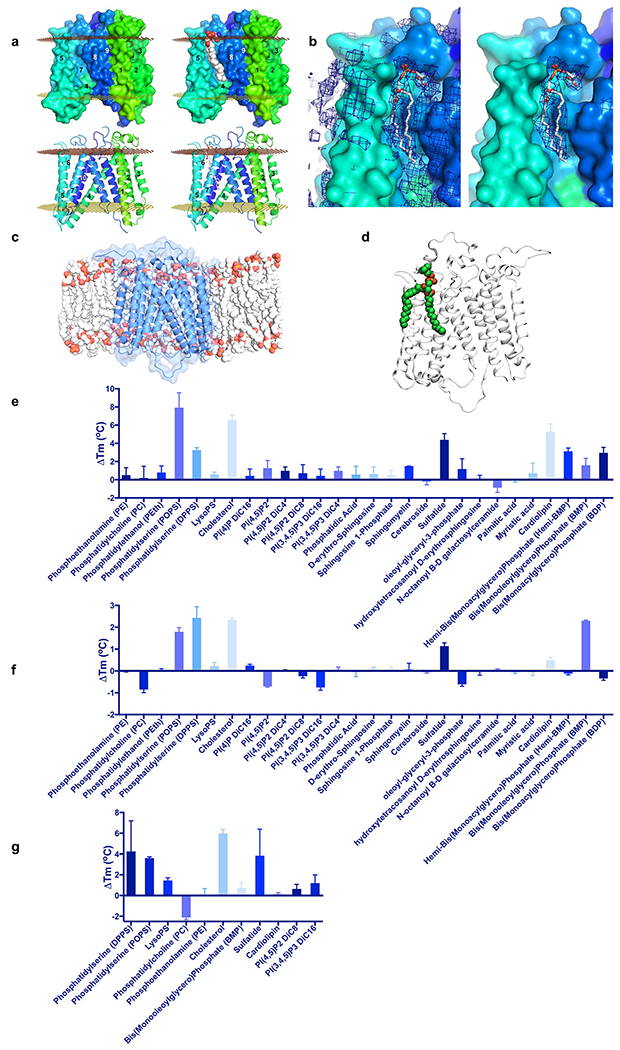
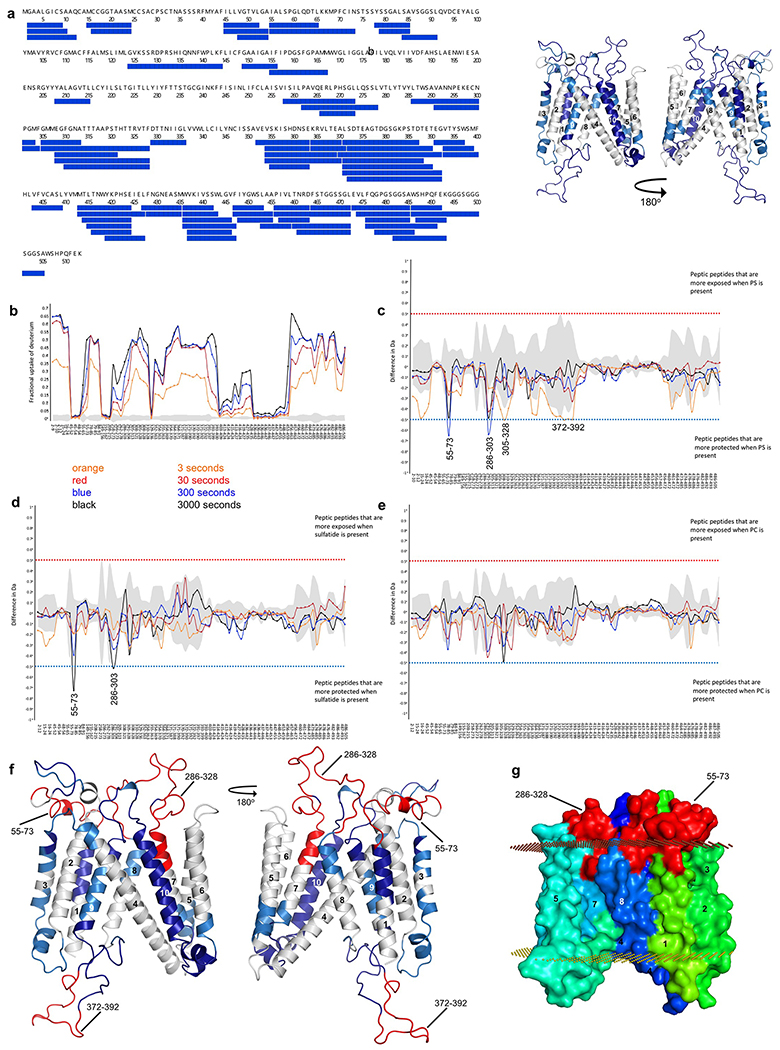
The surface of subdomain B features an elongated groove formed by TM5, 7, 8 and the C-terminal end of TM4, which is an appropriate size, shape, and location to accommodate a lipid moiety, potentially allowing a head group to access the hydrophilic cleft between the subdomains (Extended Data Fig. 6a,b). When we embedded the protein structure in a lipid bilayer in silico, the groove became readily occupied by lipids during molecular dynamics (MD) simulations, and the cryo-EM map revealed presence of an acyl chain bound at this site (Extended Data Fig. 6c,d). We conducted a screen of lipids and found that addition of phosphatidylserine, cholesterol or sulfatide increased DmSERINC and SERINC5 protein thermostability, while cardiolipin stabilised DmSERINC only (Extended Data Fig. 6e–g). Moreover, hydrogen/deuterium exchange (HDX) experiments with DmSERINC revealed that phosphatidylserine affected isotope exchange around the potential lipid binding groove in subdomain B (Extended Data Fig. 7).
The structure of human SERINC5.
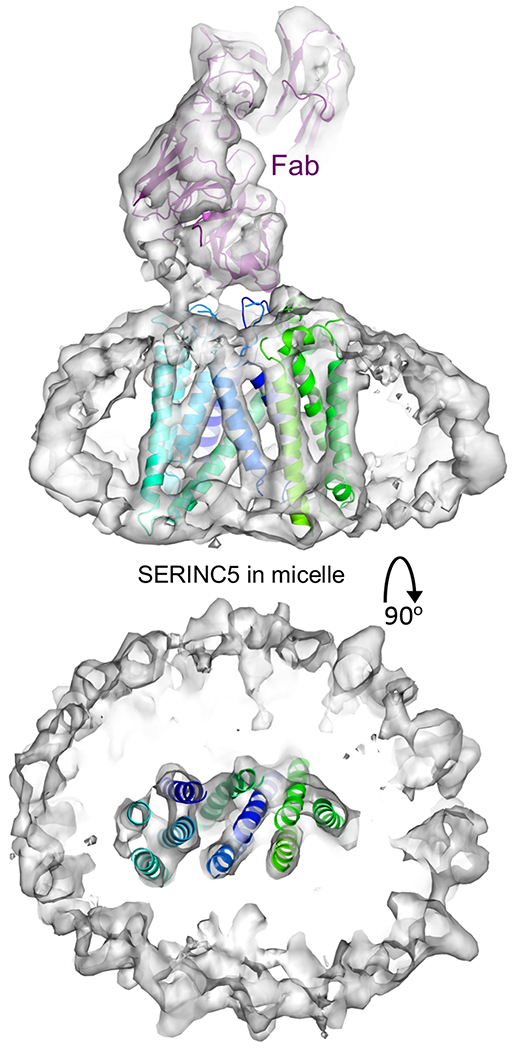
Composed of two subdomains, the DmSERINC structure is suggestive of conformational flexibility. To determine if the conformation observed in DmSERINC represents that of the bona fide HIV-1 restriction factor, we imaged SERINC5 in detergent micelles doped with phosphatidylserine, which was found to increase thermostability of the protein (Extended Data Fig. 6g). To aid in single particle image alignment of this 51 kDa protein, we acquired cryo-EM data in the presence of the antigen binding fragment (Fab) of a monoclonal antibody that recognizes SERINC5 ECL4. The resulting 3D reconstruction at a local resolution of 6.5-7 Å contains a single molecule of SERINC5 in a conformation very similar to that of DmSERINC protomers within the hexamer (Fig. 3, Extended Data Fig. 2 and Supplementary Video 2), leading us to conclude that the conformation we observe in the DmSERINC structure is also adopted by human SERINC5.
Figure 3 |. Structure of human SERINC5 bound to Fab.
The cryo-EM map is shown as a semi-transparent white surface, with fitted atomic models of DmSERINC (cartoons colored as in Fig. 1b) and Fab (purple cartoons). Top view shows transmembrane helices traversing the detergent micelle and bottom view is a perpendicular slice showing SERINC5 surrounded by the micelle.
Mapping SERINC5 regions critical for the antiviral activity.
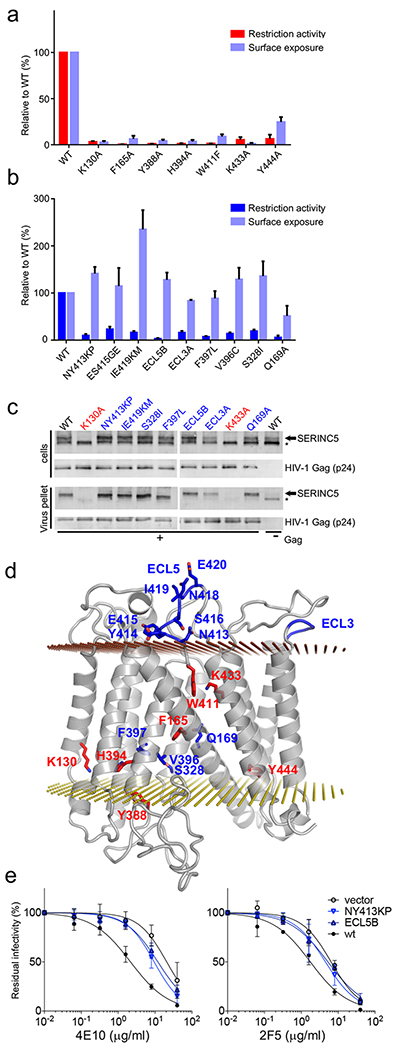
To identify regions of SERINC5 involved in HIV-1 restriction, we conducted an extensive mutagenesis screen, informed by the structure and amino acid sequence conservation with SERINC2, which lacks the HIV-1 restriction activity9,10. The mutations were introduced into constructs designed to express SERINC5 harbouring a FLAG epitope implanted within ECL4. This modification enabled surface exposure measurements of the modified proteins by flow cytometry without interfering with restriction activity (Extended Data Fig. 1d). In total, ninety-four SERINC5 mutants were tested for the ability to inhibit infectivity of Nef-negative HIV-1 (Fig. 4, Supplementary Table 2). The loss-of-function mutants clustered into two classes. The first class, comprising variants that also failed to localise to the plasma membrane, harboured the majority of mutants at highly conserved or invariant positions across the entire SERINC family, such as substitutions of Lys130, Phe165, Tyr388, His394, Trp411, Lys433, and Tyr444 (Fig. 4a). The second class of restriction-defective mutants retained the ability to localise to the plasma membrane. The majority of these carried substitutions within the ECLs or in proximity to the interface between the subdomains (Fig. 4b, d). This class included variants with substitutions within ECL5, such as a partial swap for the equivalent loop from SERINC2 (the mutant designated ECL5B), and double mutants NY413KP and IE419KM.
Figure 4 |. SERINC5 residues critical for HIV-1 restriction activity.
a and b, restriction activity and surface expression of human SERINC5 variants relative to SERINC5 wt (data shown are mean and s.d. of n=3 independent experiments). a, Class 1 amino acid substitutions interfere with Nef-defective HIV-1NL4-3 restriction and surface expression. b, Class 2 amino acid substitutions do not affect surface expression but compromise Nef-defective HIV-1 restriction. c, SERINC5 incorporation into virion particles. Immunoblots of Nef-defective HIV-1 particles and corresponding producer cell lysates expressing the indicated SERINC5 variants. The right-most lane contains a Gag-defective provirus control. Arrowheads and asterisks indicate migration position of glycosylated and non-glycosylated SERINC5, respectively. Note the selective incorporation of the glycosylated form into viral particles22 d, Class 1 and 2 residues mapped onto a model of SERINC5, in red and blue, respectively. e, Neutralisation of Nef-deficient HIV-1NL4-3 carrying the JRFL envelope by 2F5 and 4E10 monoclonal antibodies. Residual infectivity is relative to that of untreated viruses (n=4, mean ± 95% confidence interval, technical repeats), IC50 values are shown in Extended Data Fig. 1e. Uncropped images for panel c and data for graphs a, b and e are available as Source Data.
Next, we tested a representative subset of SERINC5 variants for incorporation into HIV-1 particles. As can be expected, class 1 mutants with severe defects in surface expression (K130A and K433A) were deficient for glycosylation and failed to incorporate into virions (Fig. 4c), explaining their inability to restrict infection. In contrast, class 2 mutants that were competent for plasma membrane localization incorporated into viral particles (Fig. 4c). To test the ability of these mutants to remodel HIV-1 Env, we pseudotyped Nef-negative HIV-1 particles with the tier-2 glycoprotein JRFL, which is substantially resistant to restriction by SERINC53. In agreement with published observations10,20,25, the virus produced in the presence of WT SERINC5 displayed enhanced sensitivity to neutralisation by the monoclonal antibodies 4E10 and 2F5, both of which target the highly-conserved membrane external proximal region (MPER) of HIV-1 Env (Fig. 4e). Remarkably, class 2 SERINC5 mutants were substantially compromised in their ability to sensitize the virus to neutralization (Fig. 4e). Thus, despite incorporation into virions, class 2 mutants are defective for both of the antiviral activities.
Discussion
The conserved cellular functions of SERINCs remain unclear, underscoring the difficulty in determining structure-function relationships from first principles. Further studies will be required to test the functional significance of phosphatidylserine, sulfatide and/or cholesterol binding in biological functions of SERINC proteins. Affinity for cholesterol and/or exposed phosphatidylserine could help explain the association of SERINC5 with lipid rafts9,26 and ultimately incorporation of the protein into budding virions.
The failure of class 1 SERINC5 mutants to inhibit HIV-1 infectivity strongly argues that the protein must be located at the plasma membrane to exert its antiviral activity. Intriguingly, despite virion incorporation, class 2 mutants were deficient for both restriction and sensitization to neutralizing antibodies. The congruence of these antiviral activities suggests a specific interaction resulting in the conformational remodelling of surface-exposed regions of HIV-1 Env. The involvement of the ECLs and the interface between the subdomains in restriction suggests that the restriction depends on a specific conformation of SERINC5 and strongly indicates that this activity takes place on the external surface of the virion.
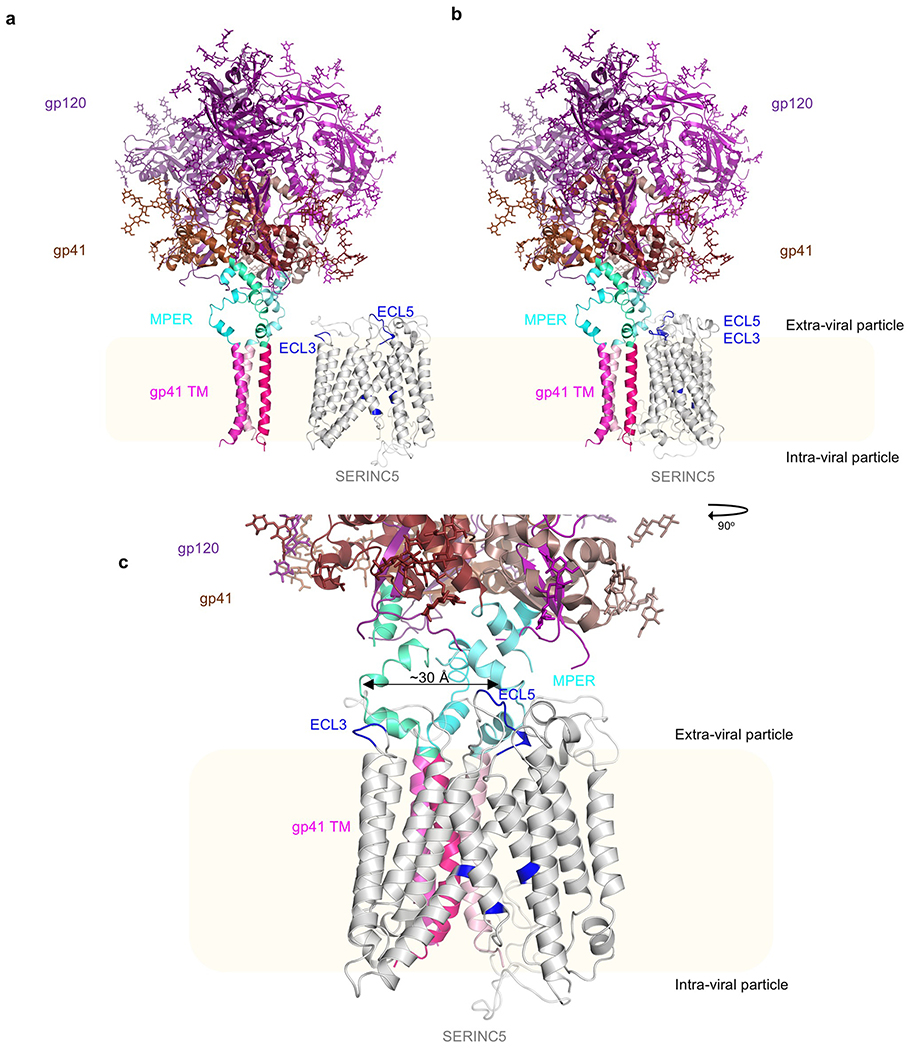
For illustrative purposes, we modelled the complete HIV-1 Env trimer using recent partial experimental structures27,28 (Extended Data Fig. 8a). In contrast to the extended viral spike, SERINC5 is almost entirely membrane embedded, poised to reach only the membrane proximal and/or embedded regions of Env (Extended Data Fig. 8a). Intriguingly, the spacing between ECL3 and ECL5 of SERINC5, both of which are important for the antiviral activities, matches that between the MPER regions within the Env trimer (Extended Data Fig. 8b,c). We speculate that interaction with the neighbouring MPER domains could explain both the inhibition of HIV-1 fusion and the sensitization to 2F5 and 4E10 antibodies by SERINC5. This hypothesis is consistent with the genetic studies that mapped the determinants of SERINC5 sensitivity to the variable loops in gp12020,29, as amino acid changes in the variable loops can modulate the accessibility of MPER30. Moreover, the interaction with CD4, which triggers an open HIV-1 Env conformation and increases MPER accessibility31, rendered tier 2 and 3 viral isolates sensitive to restriction by SERINC521. At present, we cannot exclude other possibilities, such as interactions with viral glycans and/or conformational movements of the spike that would enable direct SERINC5 contacts with gp120. Our structures and extensive functional data provide the initial insights at the molecular level of SERINC proteins and their ability to restrict HIV-1 infection, warranting further research to clarify the molecular basis of the engagement between the host factor and HIV-1 Env.
Methods
Protein expression and purification.
DmSERINC carrying a C-terminal TwinStrep tag was over-expressed in S. cerevisiae and solubilised in a buffer containing 1.5% n-dodecyl-β-D-maltoside (DDM, Anatrace). During affinity purification the detergent was exchanged to 0.05% lauryl maltose neopentyl glycol (LMNG, Anatrace), the concentration of which was reduced to a minimum for size exclusion chromatography. Human SERINC5 protein was purified from a stable cell line adapted to suspension culture following the protocol for DmSERINC with the addition of 1,2-dipalmitoyl-sn-glycero-3-phosphoserine (DPPS; Echelon Biosciences) in the sample for cryo-EM. Detailed descriptions are in Supplementary Note 1.
Generation of the monoclonal antibody and the Fab to SERINC5.
A monoclonal antibody EVG_S5.2 was produced in a single mouse immunised with recombinant SERINC5. A hybridoma line producing the antibody was expanded, and the Fab fragment was produced by digestion of the antibody with papain. Detailed descriptions are in Supplementary Note 1, and the monoclonal antibody is available from the Centre for AIDS Reagents (CFAR, www.NIBSC.org) for distribution.
Negative-stain EM.
Purified DmSERINC and SERINC5 (4 μl of ~0.01 mg/ml) were applied to glow-discharged carbon-coated 300-mesh copper grids (EM Resolutions) for 1 min before brief blotting and staining with 2 % (w/v) uranyl acetate. Grids were imaged on a Tecnai G2 Spirit LaB6 transmission electron microscope (FEI) operating at 120 keV. Images were collected with an Ultrascan-1000 camera (Gatan) at a nominal magnification of 30,000× (corresponding to a pixel size of 3.45 Å at the specimen level), with an average electron dose of 35 e/Å2 and defocus values of −0.5 to −2.0 μm. Particles, picked semi-automatically using EMAN2 Boxer tool32, were subjected to reference-free 2D classification in Relion-2.0333 or cryoSPARC34.
Cryo-EM grid preparation and data collection.
Four μl of hexameric DmSERINC at 0.5 mg/ml, freshly isolated by size exclusion chromatography, was applied onto glow-discharged holey carbon 400-mesh Quantifoil R1.2/1.3 grids (Quantifoil) for 1 min, with 100% humidity at 20°C, before blotting for 3-4 sec and plunge freezing into liquid ethane using Vitrobot Mark IV (FEI). Data were collected on a Titan Krios microscope operating at 300 keV and equipped with a Gatan post-column energy filter, selecting a 20-eV window, on a GIF Quantum K2 direct electron detector (Gatan) operating in counting mode. A total of 5,807 movies were recorded using single electron counting mode with a magnified pixel size of 1.38 Å and a defocus range of −1.6 to −4 μm. The total electron dose was 50 e−/Å2, spread over 30 frames (Table 1).
Freshly isolated SERINC5 in LMNG micelles supplemented with DPPS and equimolar amount of Fab was subjected to size exclusion chromatography through a Superdex 200 Increase 3.2/300 column. Four μl of isolated SERINC5-Fab complex was applied onto non-glow discharged C-flat 400-mesh R1.2/1.3 holey carbon grids (EMS) for 30 sec under 100% humidity at 20oC, blotted for 7 sec, and vitrified by plunging into liquid ethane using Vitrobot Mark IV. Data were collected on a Titan Krios microscope at 300 keV equipped with a Falcon 3 detector. A total 7,165 movies were recorded in single electron counting mode with a pixel size of 1.09 Å and a defocus range −1.6 to −4 μm, using total electron doze of 33.6 e−/Å2 over 30 frames (Table 1).
Cryo-EM image processing and 3D reconstruction.
Micrograph movies were aligned with dose weighting applied as implemented in MotionCor235 and the contrast transfer function (CTF) parameters were estimated from the frame sums using Gctf-v1.0636. Movies exhibiting ice contamination were discarded at this stage, leaving 4,238 (DmSERINC) and 7,021 (SERINC5-Fab complex) movies for further processing. A sub-set of particles semi-automatically picked in EMAN2 Boxer32 were used to generate the starting 2D class averages, which, upon low-pass filtering to 20 Å, served as templates for auto-picking of the entire dataset (Extended Data Fig. 3e).
The initial DmSERINC particle dataset was picked with Relion-2.133 resulting in 1,857,080 particles. Reference-free 2D classification was performed in cryoSPARC using 40 online-EM iterations into 200 classes. Particles belonging to well-defined 2D classes exhibiting secondary structure elements (717,011 particles) were selected for further processing. The starting model for 3D classifications was obtained using ab initio mode of cryoSPARC. 3D classification was carried out using Relion-2.1 into 9 classes without applying symmetry; the hexamer class (159,252 particles) was in silico purified from other states. The final 3D reconstruction was obtained using non-uniform refinement as implemented in cryoSPARC2 with C6 symmetry applied.
Classes containing asymmetrical hexamers (classes 3 and 8; Extended Data Fig. 3e) were investigated further, implementing C1 symmetry, to determine any structural rearrangements compared with the hexamer. The asymmetrical hexamers exhibited the exact same secondary structure conformations as the hexamer however were lacking some of the detergent micelle on one side (Extended Data Fig. 3h). Dimers of hexamers were also present in the sample (classes 1, 2, 4, 7 and 9; Extended Data Fig. 3e) and were likely formed by asymmetrical hexamers as a consequence of the limiting concentration of detergent used in sample preparation.
2,502,546 particles of SERINC5-Fab complex, autopicked using Gautomatch (http://www.mrc-lmb.cam.ac.uk/kzhang/), were subjected to reference-free 2D classification in cryoSPARC. The initial 3D model was obtained using ab initio reconstruction in cryoSPARC from a subset of particles belonging to 2D classes displaying clear density attributable to Fab. A total of 1,449,789 particles from well-defined 2D classes were subjected to classification in Relion-3 into eleven 3D classes. The most populated class containing 270,151 particles displayed high-resolution features with strong density corresponding to Fab outside and SERINC5 TMs inside the micelle. These particles were used for 3D auto-refinement in Relion-3 with a soft mask around the entire particle using C1 symmetry, including the detergent micelle resulting in a 3D reconstruction to an overall resolution of 8.2 Å and a local resolution throughout the protein density of 6.5-7 Å (Extended Data Fig. 2e–g). Resolution is reported according to the gold-standard Fourier shell correlation (FSC), using the 0.143 criterion37 (Table 1, Extended Data Figs 2f,g and 3f,g). Local resolution was estimated using blocres tool from BSOFT package 38.
Model building and refinement.
The DmSERINC model was built ab initio into the cryo-EM map using Coot39. Initially, poly-Ala α-helices were placed for each of the 10 TM regions in one monomer and bulky side-chain features for aromatic residues were used to identify the sequence register. Further residues were added manually to complete one subunit of the hexameric ring, this was then used to generate the remaining five monomers in the hexamer. The hexameric model was then subjected to real space refinement using Phenix40,41 with NCS constraints and refining group B-factors (one per residue) and assessed using MolProbity42 and EMringer43. The final model contains 365 amino acid residues per subunit, lacking N-terminal peptide (residues 1-29) and portions of ECL1 (residues 75-89), ECL4 (residues 306-321), ICL4 (residues 354-389), and the C-terminal peptide (residues 462-465) as illustrated in the topology diagram in Extended Data Fig. 4a. One cardiolipin, two LMNG, and one PS molecule per monomer were tentatively built into the cryo-EM map and are included in the co-ordinates. Data statistics are given in Table 1. A homology model of SERINC5 was assembled based on DmSERINC structure using SWISS-MODEL server44. Interface surface areas were calculated using the PISA server45, and membrane buried regions were predicted using the PPM server46.
Molecular dynamics.
The atomic coordinates of DmSERINC (protein only) were converted to their Martini CG representation47,48, and built into POPC membranes. Missing loops were modelled using SWISS-MODEL44, with the loop between TM1 and TM2 modelled as (GlySer)3 hexapeptide, the loop between TM7 and TM8 modelled using the native structure (MFGMMEG), and the loop between TM8 and TM9 modelled as (GlySer)7. Simulations were run over 100 ns using a 20 fs time-step, in the NPT ensemble at 323 K with the V-rescale thermostat, and 1 bar using semi-isotropic Berendsen pressure coupling.
Atomistic simulations were run following conversion of 100 ns CGMD snapshots in a POPC bilayer. Conversions were carried out using the CG2AT protocol49, with Charmm36 forcefield50 used to describe the system. Electrostatics were handled using the Particle-Mesh-Ewald method, and a force-switch modifier was applied to the Van der Waals forces. Dispersion corrections were turned off. Simulations were run for ~215 ns with Velocity-rescaling temperature coupling at 310 K using a time constant of 0.1 ps and Parrinello-Rahman semi-isotropic pressure coupling of 1 Bar with a time constant of 2 ps, using 4 fs time steps with virtual-sites on the protein and lipids51. All simulations were run in Gromacs 201852; images were made in VMD53.
Infectivity assays.
The effect of SERINC5 mutants on the infectivity of HIV-1 was studied using virions limited to a single round of replication. To this end, 200,000 HEK293T cells were transfected with 800 ng of an env-defective and nef-defective HIV-1NL4-3 provirus construct together with 100 ng of PBJ5-HXB2-Env2 and a plasmid encoding variants of SERINC5 harbouring an internal FLAG epitope (DYKDDDDKDI, inserted between residues 290 and 291) and a C-terminal HA tag (SERINC5-iFLAG, HA), or an appropriate empty vector control using calcium phosphate. High-level overexpression of SERINC5 results in suppression of viral release, which is not characteristic of the restriction factor at endogenous levels2. Therefore, SERINC5 mutants were tested using constructs based on pBJ6 or pBJ5, both of which harbour a weak promoter, resulting in moderate and low expression compared to pcDNA, respectively2. All experiments used a matched wild type SERINC5 control and the constructs and amount of SERINC5 expressing plasmid used in specific experiments are described in Supplementary Table 2. Virus-containing culture supernatants were collected 48 h after transfection, clarified by centrifugation at 300g for 5 min and passed through a 0.45-μm filter. Virus in cell supernatants was quantified using the Sybr Green PCR-enhanced reverse transcriptase assay25,54, and five serial dilutions were inoculated onto HeLa-TZM-GFP reporter cells, which contain an integrated reporter gene encoding GFP with a nuclear localization signal under the transcriptional control of the HIV-1 long terminal repeat2. Infections were performed in quadruplicate and the number of cells infected was evaluated using an EnSight plate reader (Perkin Elmer). Infectivity was measured by normalizing numbers of infected cells according to the reverse transcriptase activity in each viral preparation. Only dilutions within a linear range were considered. Reduction of infectivity caused by SERINC5 proteins was then calculated by dividing the infectivity of viruses produced in the absence of SERINC5 with the infectivity of viruses produced when co-expressing SERINC5. The residual restriction activity of each SERINC5 mutant on HIV-1 infectivity was then expressed in relation to the reduction caused by the wild type protein, considered as 100%. Where error bars are present, they represent standard error of the mean obtained from three independent biological triplicates or four technical replicates as indicated.
Surface exposure of SERINC5 mutants.
To investigate SERINC5 expression by flow cytometry, 200,000 HEK293T cells were co-transfected with DNA constructs expressing SERINC5-iFLAG-HA variants based on either pcDNA3.1 or pBJ5 vectors as indicated in Supplementary Table 2 along with 300 ng pIRES2-GFP, to allow for selective gating of transfected cells, and 1 μg pBluescript. Forty-eight h post-transfection, cells were collected, washed with ice-cold PBS and fixed with 2% paraformaldehyde. Each sample was then divided in two, and processed for staining with anti-FLAG antibody for selective detection of SERINC5 on the cell surface in non-permeabilized cells or for detection of total SERINC5 expression after permeabilisation with Wash&Perm solution (Becton Dickinson). SERINC5-iFLAG-HA was detected using mouse M2 anti-FLAG antibody (Sigma) diluted 1:500 and an APC-conjugated anti-mouse IgG (Jackson Immunoresearch) diluted 1:500. Samples were analysed using a FACS Canto (Becton Dickinson). SERINC5 expression was assessed on the live cell population gated on FSC vs SSC, followed by gating the transfected cell population, which express GFP, as illustrated in Supplementary Information Table 2.
SERINC5 incorporation into virus particles and immunoblotting.
To detect SERINC5 associated with virus particles, 5 million HEK293T cells were transfected with 18 μg env-defective and nef-defective HIV-1NL4-3 provirus construct together with 2 μg pBJ5-HXB2-Env and 1 μg pBJ5-SERINC5-iFLAG-HA. To verify specific detection of virus-associated SERINC5, a control sample was produced by transfecting a Gag-defective HIV-1NL4-3 provirus construct. Cell supernatants from transfected cells were clarified by centrifugation at 300g for 5 min, passed through filters with 0.45-μm pores, overlaid on a 25% sucrose cushion and concentrated by centrifugation for 2 h at 100,000g in a SW41 swingout rotor (Beckman Coulter). The resulting viral pellets were resuspended in Laemmli sample buffer supplemented with 50 mM TCEP. Virus producing cells were collected in PBS, pelleted and lysed in an ice-cold buffer containing 100 mM NaCl, 10 mM HEPES pH 7.5, 1% DDM and protease inhibitors. Lysates, clarified by centrifugation and mixed with Laemmli buffer supplemented with 50 mM TCEP, were separated on 12.5% acrylamide Tricine gels and transferred onto Immobilon-FL PVDF membrane (Millipore). Blots were probed with mouse anti-HA (clone 16B12, Covance) diluted 1:1,000, rabbit anti-β actin (Li-COR) diluted 1:1,000 and rabbit anti-HIV-1 p24 (ARP432; National Institute for Biological Standards and Control) antibody. Secondary antibodies were conjugated to IRDye 680 or IRDye 800 (Li-COR), and blots were imaged using an Odyssey infrared imaging System (Li-COR).
HIV-1 neutralization assays.
Sensitivity to neutralizing antibodies was measured using virions limited to a single round of replication produced by transfection of HEK293T cells similarly to as described for the infectivity assay, with the only difference that the HIV-1NL4-3 Env defective provirus construct was complemented in trans with a vector encoding Env derived from HIV-1JRFL (pSV-JRFL), which allows production of virions minimally sensitive to the effect of SERINC5 on infectivity. Viruses were normalized based on reverse transcriptase activity and the inocula were adjusted to produce between 1% and 3% infection of the monolayer. Viruses were incubated with serially diluted neutralizing antibodies for 1 h at room temperature. The complexes were added to TZM-bl GFP cells, seeded onto 96-well tissue culture plates a day prior to neutralization, incubated at 37°C for 2 h, followed by two washes with PBS before being cultured in fresh complete DMEM. Infected cells were incubated at 37°C for 42 h before scoring number of infected cells per each well using an Ensight plate reader.
Neutralization was measured by calculating the residual infectivity of treated virus samples considering the infectivity of the untreated sample as 100%. Fitted sigmoidal curves and the IC50 values were obtained using Prism (Graphpad) with the least square variable slope method using the dose-normalized response protocol. Neutralizations were performed in quadruplicate with each combination of virus and antibody to be analyzed and data shown are the average with the error bars representing the 95% confidence interval as calculated by Prism. Neutralizing antibodies 4E10 (ARP3239) and 2F5 (ARP3063) were obtained from the UK National Institute for Biological Standards and Control.
Protein thermostability assay.
Melting curves were recorded using 20-95°C 1.5°C/min temperature ramps on a Promethius NT.48 instrument with standard capillaries (Nanotemper). Proteins were diluted to 1 mg/ml in 40 mM NaCl, 10 mM HEPES-NaOH, pH 7.5, 0.0003% LMNG; where indicated, samples were spiked with 0.1 mM lipid. Lipid stock details are given in Supplementary Note 1.
Native protein mass spectrometry.
Purified DmSERINC was buffer exchanged into 200 mM ammonium acetate, pH7 supplemented with 0.002% LMNG using Bio-Spin 6 Columns (BioRad). Samples were analysed at a final concentration of 5 μM using a Q-Exactive mass spectrometer (Thermo Fisher Scientific) modified for high molecular weight ions as previously described55. Cardiolipin (Avanti), PI(3,4)P2 (Avanti), PI(4,5)P2 (Avanti), POPE (Avanti), POPC (Avanti) and POPG (Avanti) were reconstituted to 3 mM in 200 mM ammonium acetate supplemented with 0.017% DDM and diluted into the desired concentration using 200 mM ammonium acetate with 0.002% LMNG. Lipids were added to DmSERINC samples and equilibrated for 20 min prior to analysis. Ions were generated by static nano-electrospray using gold-coated capillaries prepared in-house as described previously56. Instrument settings were as follows: capillary voltage 1.5 kV, source temperature 40°C, S-lens RF = 200, maximum injection time 150, HCD voltage 200 V, desolvation voltage −10 (positive mode), with in-source trapping on. Data were acquired between 2,000-15,000 with 10 microscans, and results were processed using XCalibur 2.2 software (Thermo Fisher Scientific). DmSERINC peak assignments were done manually using in-house software as well as with UniDec software57.
Lipidomics.
Sequencing grade trypsin (Promega) was added to 20 μg DmSERINC (5:1 SERINC to trypsin) and incubated overnight at 37°C. Samples were dried in a vacuum concentrator and reconstituted (15 min sonication) in 30 μl acetonitrile:water (60:40, v/v), 10 mM ammonium formate, 0.1% formic acid (buffer A). Samples were centrifuged for 3 min at 10,000g and 15 μl was removed for analysis. For each run, 5 μl was injected onto a C18 column (Acclaim PepMap 100, C18, 75 mm × 15 cm; Thermo Scientific) on a Dionex UltiMate 3000 RSLC nanoLC System. A 32-99% linear gradient to buffer B (isopropanol:acetonitrile (90:10, v/v), 10 mM ammonium formate, 0.1% formic acid) was used with a flow rate of 300 nl/min over 30 min. Data were acquired using an LTQ Orbitrap mass spectrometer (Thermo Fisher Scientific) in negative ion mode with the following data-dependent acquisition settings: full-scan mass range 350-2,000 m/z, resolution 60,000, normalized collision energy 38%, activation time 30 msec, automatic gain control target 30,000, capillary voltage 1.8 kV, and capillary temperature 180°C. Collision-induced dissociation was performed for the five most intense ions, data were interpreted manually using XCalibur 2.2 software (ThermoFisher Scientific).
HDX mass spectrometry.
Deuterium exchange reactions of DmSERINC (monomeric fraction) in LMNG micelles with or without addition of exogenous DPPS (Echelon Biosciences), sulfatide (Matreya LLC) or PC (Echelon Biosciences), were initiated by diluting the proteins in D2O (99.8% D2O, Sigma-Aldrich) in 10 mM HEPES pH 7.5, 40 mM NaCl, 2 mM DTT and 1 mM TCEP to obtain a final D2O concentration of ~91%. For all experiments, deuterium labelling was carried out at 23°C (unless otherwise stated) at four points, 3, 30, 300, and 3,000 sec in triplicate. The exchange was quenched by the addition of chilled 2 M guanidinium hydrochloride in 100 mM phosphate buffer, pH 2.4 (adjusted with formic acid), 15 mM TCEP and 0.1% v/v DDM. Samples, snap frozen in liquid nitrogen, were stored at −80°C prior to analysis.
The quenched protein samples were rapidly thawed and subjected to proteolytic cleavage with pepsin followed by reversed phase chromatography. Briefly, the protein was passed through a 5-μ m 2.1 × 30 mm Enzymate BEH immobilized pepsin column, (Waters) at 200 μ l/min for 2 min; the peptic fragments were trapped and desalted on a 1.7-μ m 2.1 × 5 mm C18 trap column equipped with Acquity BEH C18 Van-guard pre-column (Waters). Trapped peptides were subsequently eluted over 11 min with a 3%–43% gradient of acetonitrile in 0.1% v/v formic acid at 40 μ l/min. Peptides were separated on a reverse phase column (Acquity UPLC BEH C18 column 1.7 μ m, 100 mm x 1 mm, Waters) and detected on a SYNAPT G2-Si HDMS mass spectrometer (Waters) over a m/z of 300 to 2000, with the standard electrospray ionization (ESI) source with lock mass calibration using [Glu1]-fibrino peptide B (50 fmol/ μ l). The mass spectrometer was operated at a source temperature of 80°C and a spray voltage of 2.6 kV. Spectra were collected in positive ion mode. Peptide identification was performed by MSE58 using an identical gradient of increasing acetonitrile in 0.1% v/v formic acid over 11 min.
The resulting MS data were analysed using Protein Lynx Global Server 3.0 software (Waters) with an MS tolerance of 5 ppm. Mass analysis of the peptide centroids was performed using DynamX 3.0 software (Waters). Only peptides with scores exceeding 6.4 were considered. The first round of analysis and identification was performed automatically by the DynamX 3.0 software, however, all peptides (deuterated and non-deuterated) were manually verified at every time point for the correct charge state, presence of overlapping peptides, and correct retention time. Deuterium incorporation was not corrected for back-exchange and represents relative, rather than absolute changes in deuterium levels. Changes in H/D amide exchange in any peptide may be due to a single amide or a number of amides within that peptide. The DynamX 3.0 software plots the standard deviation for every peptide. The error band shows the standard deviation of the plotted uptake or difference for each peptide. When there are multiple exposures, as in this experiment, for a given peptide, the maximum standard deviation is plotted for each peptide. A sigma multiplier of 1 is applied to the standard deviation to produce the grey error bar plotted in Extended Data Fig. 7b–e.
Data Availability.
The cryo-EM maps and the refined atomic model of DmSERINC were deposited in the EMDB and wwPDB, respectively, with accession codes EMD-10277 and EMD-10279 and PDB 6SP2. Source data for Figures 4a, 4b, 4c, 4e and for Extended Data Figures 1a, 1c, 1d, 1e, 2b, 3b, 4g–i, 6e–g, are available with the paper online.
Extended Data
Extended Data Fig. 1. Restriction activity and surface exposure of SERINC.
a,b, HIV-1 restriction activity of DmSERINC compared with human SERINC5 and SERINC2. Human and DmSERINC proteins with HA tags at their C-termini were expressed in HEK293T cells with two different expression vectors (pcDNA and pBJ6) which provide high and low expression, respectively. Levels of the indicated SERINC proteins were assessed by Western blotting using an anti-HA antibody (uncropped blot images are shown in the Source Data) (a) and by flow cytometry (b) to detect the proteins surface expression (b, top) or total expression (b, bottom) using an anti-FLAG antibody on non-permeabilzed and permeabilized cells respectively. c, Effect of SERINC expression on infectivity of HIV-1 produced in HEK293T cells transfected to express the indicated SERINC-iFLAG-HA and Nef-deficient HIV-1NL4-3. (Data shown are mean and s.d. of n=4 technical repeats. Data are provided in the Source Data). d, Insertion of the FLAG epitope into ECL4 does not interfere with the anti-HIV-1 restriction activity of SERINC5. Infectivity of Nef-deficient HIV-1NL4-3 produced in HEK293T cells transfected to express unmodified human SERINC5-HA or a variant modified by inserting a FLAG tag within its ECL4 (SERINC5-iFLAG-HA). Two different expression vectors (pcDNA and pBJ6) were used in order to obtain high and low SERINC5 expression as shown above (Data shown are mean and s.d. of n=4 technical repeats. Data are provided in the Source Data). e, Effect of ECL5 SERINC5 variants on HIV-1 susceptibility to neutralization. IC50 values derived from fitted sigmoidal curves shown in figure 4, obtained from quadruplicate repeats using antibodies 2F5 and 4E10 on Nef-defective HIV-1NL4-3 pseudotyped with the envelope glycoprotein derived from HIV-1JR-FL, produced by transfecting HEK293T cells with the indicated PBJ5-SERINC5-iFLAG-HA variants or the empty vector control (Data shown are mean and 95% confidence interval of n=4 technical repeats. Data are provided in the Source Data).
Extended Data Fig. 2. Human SERINC5 purification and EM.
a, Size exclusion chromatography profile. b, Left: SDS-PAGE analysis of resulting fractions; right: cleavage of TwinStrep tag and deglycosylation (uncropped gel images are shown in the Source Data). c, Sample micrograph of negatively stained particles. d, Representative 2D class averages. e, Schematic of image processing and reconstruction of the human SERINC5 cryo-EM structure. Details are given in Extended Methods. f, Left: Gold standard FSC curve for the cryo-EM reconstruction of SERINC5, Right: Euler angle distribution plot for particles included in the final 3D reconstruction; 3DFCS reports a sphericity of 0.976. g, The map colored according to local resolution estimated with blocres.
Extended Data Fig. 3. DmSERINC purification and EM.
a, Left: chromatography profile of DmSERINC on a Superdex 200 column; the blue arrow highlights elution of the material, which was re-injected onto the column. Right: elution profile of hexameric DmSERINC. b, Left: SDS PAGE analysis of chromatography fractions; Right: purified hexamer (first 4 lanes) and monomer (last four lanes) uncleaved vs cleaved sample showing higher oligomeric states in hexamer sample shift upon cleavage of the C-terminal TwinStrep tag (uncropped gel images are shown in the Source Data). c, Sample micrograph of negatively stained DmSERINC sample from 9.8-ml peak. d, 2D class averages of negatively stained DmSERINC. e, Schematic of image processing and 3D reconstruction of the DmSERINC hexamer. Volumes are shown at two contour levels, towards the protein level in solid white and the outline of the detergent micelle in transparent grey. Details of the image processing and reconstruction are given in Extended Methods. f, Left: Gold-standard FSC curve for the refined DmSERINC cryo-EM map. f, Right: Euler angle distribution plot for aligned particles contributing to the 3D reconstruction; bar lengths and color (blue low, red high) correspond to numbers of particles in corresponding orientations. g, Cryo-EM map colored according to local resolution estimated with blocres and shown at high (left) and low (right) contour levels. h, Cryo-EM maps of the asymmetrical DmSERINC hexamer (corresponding to 3D classes 3 and 8 in Extended Data Fig. 3e) with fitted model: viewed down 6-fold axis (top) or from side (bottom). The map is contoured to highlight the protein components (right) or the detergent micelle (left).
Extended Data Fig. 4. Structural features of DmSERINC.
a, Transmembrane topology diagram of DmSERINC structure with residues not resolved in the cryo-EM map shaded grey. b, Topology diagram of the SERINC protein fold, colored as in Fig. 1b. ECLs and ICLs are labelled along with disulphide bonds and subdomains A and B. c, Scatter plot of top 500 results from analysis using Dali server, showing numbers of aligned residues versus root mean square deviations (Å) of Cα atom positions. d, DmSERINC hexamer colored by conservation; Guillemet indicates the viewpoint on the protomer-protomer interface labeled with asterisk that is shown in the sideview on the right. e, Examples of DmSERINC cryo-EM map with fitted model. f, Two disulphide bonds identified on the extracellular side of DmSERINC. Left: Cryo-EM map showing profile of Cys71-Cys91 disulphide bond within ECL1. Right: Cryo-EM map showing profile of Cys238-Cys299 disulphide bond between ECL3 and ECL4. Thermostability of the DmSERINC hexamer (g), monomer (h), and SERINC5 (i) with the addition of reducing agents (0.5 mM DTT and 0.5 mM TCEP); data shown are mean and s.d. n=3-4 technical repeats, data are provided in source data. j, Molecular dynamic simulations of solvation. Left top: Density analysis of waters (blue surface) around DmSERINC (grey cartoon) in one repeat of atomistic 230-ns simulation. Left bottom: Water density shown as a 2D heatmap slice. Right: DmSERINC residues implicated in controlling water wire highlighted in green.
Extended Data Fig. 5. Lipidomics of DmSERINC structure.
a, Cryo-EM map features of DmSERINC displaying similarities with cardiolipin viewed with (right) and without (left) coordinates built, from two angles. b, Positions of the tentative cardiolipin sandwiched between the protomers of the hexamer. c-e, Identification of lipids associated with DmSERINC by mass spectrometry: c, Lipidomics LC-MS analysis of hexameric DmSERINC5 purified from yeast cells. Ions corresponding to phospholipids (PE, PC, PI) and cardiolipin compositions are indicated. d, Structures within each lipid class are confirmed by MS/MS fragmentation. Neutral loss fragments, such as R1COO- and R2COO- ions, are diagnostic for PE, PC, PI and cardiolipin (CL). e, Native mass spectra of DmSERINC monomers (10+ to 15+ charge state distribution) isolated from LMNG micelles spiked with PC, PG, PE or CL lipids added at a 1:1 molar ratio. Up to two equivalents of bound CL were observed whereas no distinct binding was detected for PC, PG, or PE.
Extended Data Fig. 6. Lipid screening.
a, Lipid binding groove apparent in DmSERINC structure, top left: Surface representation of DmSERINC monomer revealing a groove formed between TMs 5, 7, 8 and 4. top right: Lipid moiety modeled into the groove, shown in spheres, illustrating complementary size, shape and location for lipid binding. bottom left: Cartoon representation of the same view with helices labelled and colored as Fig. 1b. bottom right: Cartoon representation with lipid shown in stick format. b, Cryo-EM map has lipid-like features in this groove, left: map with PS modelled in, right: map carved to 2.5 Å around the modelled PS to highlight the lipid-like map features. e. View of DmSERINC in a POPC membrane, following 215 ns of atomistic simulation. The protein is shown as blue cartoon and transparent surface, and the POPC lipids as red, orange and grey spheres. Lipids in front of the protein have been removed to reveal how the protein sits in the membrane. d, Post 215 ns view of DmSERINC from atomistic MD simulation, showing a POPC lipid bound to the groove between TM 5 and 8. The protein is shown in white cartoon, the lipid in green, red and gold spheres. Note that this lipid remains bound for the full simulation. e-g, Lipid thermostability assay. e, Change in thermostability of DmSERINC hexamer upon the addition of specific lipid. f, Change in thermostability of DmSERINC monomer upon the addition of a specific lipid; g, Change in thermostability of SERINC5 upon the addition of a specific lipid (select sample of lipids). Data shown in e-f are mean and s.d. of 3-6 technical repeats, data are provided in Source Data.
Extended Data Fig. 7. HDX of lipid interactions with DmSERINC.
a, Left: Peptide coverage of DmSERINC monomer for HDX. Right: Structure of DmSERINC (with undefined loops modeled in using SWISS MODEL) with coverage highlighted in blue. b-e, HDX profile of purified monomeric DmSERINC in LMNG micelles prior to (b) or after spiking with exogenous DPPS (c), sulfatides (d), or PC (e) Peptide residue numbers are shown on the x-axis. f, Protected regions determined by HDX mapped onto the DmSERINC structure and highlighted in red (with undefined loops modelled in using SWISS MODEL). g, surface representation of DmSERINC structure colored as in Fig. 1b. with protected regions highlighted in red.
Extended Data Fig. 8. Juxtaposition of SERINC5 and the trimeric HIV-1 envelope spike.
The model of human SERINC5 is shown in grey cartoons with residues important for restriction highlighted in blue and modeled loops in white transparent. The illustrative model of full-length trimeric HIV-1 Env was assembled using PDB 6E8W (model 1; pinks) and PDB 5FUU (gp41 browns; gp120 purples), MPER (653-683) is shown in cyans, all structures shown in cartoons; membrane is in cream. a, Side-by-side comparison; b, Models shown in closer proximity, c, 90o rotation and zoom of model in panel b showing the distance between ECL5 and ECL3 is approximately the same distance (~30 Å) as that between MPER α helices in gp41.
Supplementary Material
Acknowledgements
We thank the UK Biological Services Division at the National Institute of Biological Standards and Control for their expertise in animal husbandry for the production of the antibody; R. Peat and the Cell Services Platform (Crick Institute) for upscaling of the hybridoma culture and purification of the antibody; J. Diffley for advice on codon-optimisation for protein expression in yeast; J. Frigola and G. Coster for the generous gift of JF1 cells and pGC014; R. Carzaniga for the maintenance of Vitrobot and Tecnai G2 microscope and user training; P. Walker, A. Purkiss and M. Oliveira for computer and software support; M. Silva dos Santos for assistance with lipid preparations; D. Wu (University of Oxford) for lipidomics support; the UK National Institute for Biological Standards and Control, and depositor H. Katinger, for providing anti-HIV-1 4E10, 2F5 and p55/p24 antibodies; A. Engelman (Dana-Farber Cancer Institute) and J. Luban (University of Massachusetts) for comments on the manuscript. PJS and RAC were funded by Wellcome Trust (208361/Z/17/Z). Research in PJS’s lab is supported by the MRC (MR/S009213/1) and BBSRC (BB/P01948X/1, BB/R002517/1, BB/S003339/1). This project made use of time on ARCHER and JADE granted via the UK High-End Computing Consortium for Biomolecular Simulation, HECBioSim (http://hecbiosim.ac.uk), supported by EPSRC (grant no. EP/R029407/1). This research was funded by US National Institutes of Health grant P50 AI150481 and the Francis Crick Institute, which receives its core funding from Cancer Research UK (FC001061), the UK Medical Research Council (FC001061), and the Wellcome Trust (FC001061).
Footnotes
Competing interests
The authors declare no competing interests.
References
- 1.Duggal NK & Emerman M Evolutionary conflicts between viruses and restriction factors shape immunity. Nat Rev Immunol 12, 687–95 (2012). [DOI] [PMC free article] [PubMed] [Google Scholar]
- 2.Rosa A et al. HIV-1 Nef promotes infection by excluding SERINC5 from virion incorporation. Nature 526, 212–7 (2015). [DOI] [PMC free article] [PubMed] [Google Scholar]
- 3.Usami Y, Wu Y & Gottlinger HG SERINC3 and SERINC5 restrict HIV-1 infectivity and are counteracted by Nef. Nature 526, 218–23 (2015). [DOI] [PMC free article] [PubMed] [Google Scholar]
- 4.Chande A et al. S2 from equine infectious anemia virus is an infectivity factor which counteracts the retroviral inhibitors SERINC5 and SERINC3. Proc Natl Acad Sci U S A 113, 13197–13202 (2016). [DOI] [PMC free article] [PubMed] [Google Scholar]
- 5.Ahmad I et al. The retroviral accessory proteins S2, Nef, and glycoMA use similar mechanisms for antagonizing the host restriction factor SERINC5. J Biol Chem 294, 7013–7024 (2019). [DOI] [PMC free article] [PubMed] [Google Scholar]
- 6.Inuzuka M, Hayakawa M & Ingi T Serinc, an activity-regulated protein family, incorporates serine into membrane lipid synthesis. J Biol Chem 280, 35776–83 (2005). [DOI] [PubMed] [Google Scholar]
- 7.Trautz B et al. The host-cell restriction factor SERINC5 restricts HIV-1 infectivity without altering the lipid composition and organization of viral particles. J Biol Chem 292, 13702–13713 (2017). [DOI] [PMC free article] [PubMed] [Google Scholar]
- 8.Chu EP et al. Disruption of Serinc1, which facilitates serine-derived lipid synthesis, fails to alter macrophage function, lymphocyte proliferation or autoimmune disease susceptibility. Mol Immunol 82, 19–33 (2017). [DOI] [PubMed] [Google Scholar]
- 9.Schulte B et al. Localization to detergent-resistant membranes and HIV-1 core entry inhibition correlate with HIV-1 restriction by SERINC5. Virology 515, 52–65 (2018). [DOI] [PMC free article] [PubMed] [Google Scholar]
- 10.Sood C, Marin M, Chande A, Pizzato M & Melikyan GB SERINC5 protein inhibits HIV-1 fusion pore formation by promoting functional inactivation of envelope glycoproteins. J Biol Chem 292, 6014–6026 (2017). [DOI] [PMC free article] [PubMed] [Google Scholar]
- 11.Hnoonual A et al. Chromosomal microarray analysis in a cohort of underrepresented population identifies SERINC2 as a novel candidate gene for autism spectrum disorder. Sci Rep 7, 12096 (2017). [DOI] [PMC free article] [PubMed] [Google Scholar]
- 12.Lubke GH et al. Genome-wide analyses of borderline personality features. Mol Psychiatry 19, 923–9 (2014). [DOI] [PMC free article] [PubMed] [Google Scholar]
- 13.Zuo L et al. Rare SERINC2 variants are specific for alcohol dependence in individuals of European descent. Pharmacogenet Genomics 23, 395–402 (2013). [DOI] [PMC free article] [PubMed] [Google Scholar]
- 14.Zeng Y et al. SERINC2-knockdown inhibits proliferation, migration and invasion in lung adenocarcinoma. Oncol Lett 16, 5916–5922 (2018). [DOI] [PMC free article] [PubMed] [Google Scholar]
- 15.Bossolasco M, Veillette F, Bertrand R & Mes-Masson AM Human TDE1, a TDE1/TMS family member, inhibits apoptosis in vitro and stimulates in vivo tumorigenesis. Oncogene 25, 4549–58 (2006). [DOI] [PubMed] [Google Scholar]
- 16.Margue C et al. New target genes of MITF-induced microRNA-211 contribute to melanoma cell invasion. PLoS One 8, e73473 (2013). [DOI] [PMC free article] [PubMed] [Google Scholar]
- 17.Player A et al. Identification of TDE2 gene and its expression in non-small cell lung cancer. Int J Cancer 107, 238–43 (2003). [DOI] [PubMed] [Google Scholar]
- 18.Hurley JH & Cada AK Inside job: how the ESCRTs release HIV-1 from infected cells. Biochem Soc Trans 46, 1029–1036 (2018). [DOI] [PMC free article] [PubMed] [Google Scholar]
- 19.Chen B Molecular Mechanism of HIV-1 Entry. Trends Microbiol 27, 878–891 (2019). [DOI] [PMC free article] [PubMed] [Google Scholar]
- 20.Beitari S, Ding S, Pan Q, Finzi A & Liang C Effect of HIV-1 Env on SERINC5 Antagonism. J Virol 91(2017). [DOI] [PMC free article] [PubMed] [Google Scholar]
- 21.Zhang X et al. CD4 expression and Env conformation are critical for HIV-1 restriction by SERINC5. J Virol (2019). [DOI] [PMC free article] [PubMed] [Google Scholar]
- 22.Sharma S, Lewinski MK & Guatelli J An N-Glycosylated Form of SERINC5 Is Specifically Incorporated into HIV-1 Virions. J Virol 92(2018). [DOI] [PMC free article] [PubMed] [Google Scholar]
- 23.Holm L & Sander C Dali: a network tool for protein structure comparison. Trends Biochem Sci 20, 478–80 (1995). [DOI] [PubMed] [Google Scholar]
- 24.Laskowski RA The ProFunc Function Prediction Server. Methods Mol Biol 1611, 75–95 (2017). [DOI] [PubMed] [Google Scholar]
- 25.Lai RP et al. Nef decreases HIV-1 sensitivity to neutralizing antibodies that target the membrane-proximal external region of TMgp41. PLoS Pathog 7, e1002442 (2011). [DOI] [PMC free article] [PubMed] [Google Scholar]
- 26.Brugger B et al. The HIV lipidome: a raft with an unusual composition. Proc Natl Acad Sci U S A 103, 2641–6 (2006). [DOI] [PMC free article] [PubMed] [Google Scholar]
- 27.Fu Q et al. Structure of the membrane proximal external region of HIV-1 envelope glycoprotein. Proc Natl Acad Sci U S A 115, E8892–E8899 (2018). [DOI] [PMC free article] [PubMed] [Google Scholar]
- 28.Lee JH, Ozorowski G & Ward AB Cryo-EM structure of a native, fully glycosylated, cleaved HIV-1 envelope trimer. Science 351, 1043–8 (2016). [DOI] [PMC free article] [PubMed] [Google Scholar]
- 29.Usami Y & Gottlinger H HIV-1 Nef responsiveness is determined by Env variable regions involved in trimer association and correlates with neutralization sensitivity. Cell Rep 5, 802–12 (2013). [DOI] [PMC free article] [PubMed] [Google Scholar]
- 30.Chakrabarti BK et al. Direct antibody access to the HIV-1 membrane-proximal external region positively correlates with neutralization sensitivity. J Virol 85, 8217–26 (2011). [DOI] [PMC free article] [PubMed] [Google Scholar]
- 31.Ivan B, Sun Z, Subbaraman H, Friedrich N & Trkola A CD4 occupancy triggers sequential pre-fusion conformational states of the HIV-1 envelope trimer with relevance for broadly neutralizing antibody activity. PLoS Biol 17, e3000114 (2019). [DOI] [PMC free article] [PubMed] [Google Scholar]
- 32.Bell JM, Chen M, Baldwin PR & Ludtke SJ High resolution single particle refinement in EMAN2.1. Methods 100, 25–34 (2016). [DOI] [PMC free article] [PubMed] [Google Scholar]
- 33.Scheres SH RELION: implementation of a Bayesian approach to cryo-EM structure determination. J Struct Biol 180, 519–30 (2012). [DOI] [PMC free article] [PubMed] [Google Scholar]
- 34.Punjani A, Rubinstein JL, Fleet DJ & Brubaker MA cryoSPARC: algorithms for rapid unsupervised cryo-EM structure determination. Nat Methods 14, 290–296 (2017). [DOI] [PubMed] [Google Scholar]
- 35.Zheng SQ et al. MotionCor2: anisotropic correction of beam-induced motion for improved cryo-electron microscopy. Nat Methods 14, 331–332 (2017). [DOI] [PMC free article] [PubMed] [Google Scholar]
- 36.Zhang K Gctf: Real-time CTF determination and correction. J Struct Biol 193, 1–12 (2016). [DOI] [PMC free article] [PubMed] [Google Scholar]
- 37.Scheres SH & Chen S Prevention of overfitting in cryo-EM structure determination. Nat Methods 9, 853–4 (2012). [DOI] [PMC free article] [PubMed] [Google Scholar]
- 38.Heymann JB & Belnap DM Bsoft: image processing and molecular modeling for electron microscopy. J Struct Biol 157, 3–18 (2007). [DOI] [PubMed] [Google Scholar]
- 39.Emsley P & Cowtan K Coot: model-building tools for molecular graphics. Acta Crystallogr D Biol Crystallogr 60, 2126–32 (2004). [DOI] [PubMed] [Google Scholar]
- 40.Afonine PV et al. Real-space refinement in PHENIX for cryo-EM and crystallography. Acta Crystallogr D Struct Biol 74, 531–544 (2018). [DOI] [PMC free article] [PubMed] [Google Scholar]
- 41.Adams PD et al. PHENIX: a comprehensive Python-based system for macromolecular structure solution. Acta Crystallogr D Biol Crystallogr 66, 213–21 (2010). [DOI] [PMC free article] [PubMed] [Google Scholar]
- 42.Chen VB et al. MolProbity: all-atom structure validation for macromolecular crystallography. Acta Crystallogr D Biol Crystallogr 66, 12–21 (2010). [DOI] [PMC free article] [PubMed] [Google Scholar]
- 43.Barad BA et al. EMRinger: side chain-directed model and map validation for 3D cryo-electron microscopy. Nat Methods 12, 943–6 (2015). [DOI] [PMC free article] [PubMed] [Google Scholar]
- 44.Waterhouse A et al. SWISS-MODEL: homology modelling of protein structures and complexes. Nucleic Acids Res 46, W296–W303 (2018). [DOI] [PMC free article] [PubMed] [Google Scholar]
- 45.Krissinel E & Henrick K Inference of macromolecular assemblies from crystalline state. J Mol Biol 372, 774–97 (2007). [DOI] [PubMed] [Google Scholar]
- 46.Lomize MA, Pogozheva ID, Joo H, Mosberg HI & Lomize AL OPM database and PPM web server: resources for positioning of proteins in membranes. Nucleic Acids Res 40, D370–6 (2012). [DOI] [PMC free article] [PubMed] [Google Scholar]
- 47.Marrink SJ, Risselada HJ, Yefimov S, Tieleman DP & de Vries AH The MARTINI force field: coarse grained model for biomolecular simulations. J Phys Chem B 111, 7812–24 (2007). [DOI] [PubMed] [Google Scholar]
- 48.Monticelli L et al. The MARTINI Coarse-Grained Force Field: Extension to Proteins. J Chem Theory Comput 4, 819–34 (2008). [DOI] [PubMed] [Google Scholar]
- 49.Stansfeld PJ & Sansom MS From Coarse Grained to Atomistic: A Serial Multiscale Approach to Membrane Protein Simulations. J Chem Theory Comput 7, 1157–66 (2011). [DOI] [PubMed] [Google Scholar]
- 50.Huang J & MacKerell AD Jr. CHARMM36 all-atom additive protein force field: validation based on comparison to NMR data. J Comput Chem 34, 2135–45 (2013). [DOI] [PMC free article] [PubMed] [Google Scholar]
- 51.Olesen K, Awasthi N, Bruhn DS, Pezeshkian W & Khandelia H Faster Simulations with a 5 fs Time Step for Lipids in the CHARMM Force Field. J Chem Theory Comput 14, 3342–3350 (2018). [DOI] [PubMed] [Google Scholar]
- 52.Berendsen HJC, van der Spoel D & van Drunen R GROMACS: A message-passing parallel molecular dynamics implementation. Comput Phys Commun 91, 43–56 (1995). [Google Scholar]
- 53.Humphrey W, Dalke A & Schulten K VMD: Visual molecular dynamics J Mol Graph 14, 33–8 (1996). [DOI] [PubMed] [Google Scholar]
- 54.Pizzato M et al. A one-step SYBR Green I-based product-enhanced reverse transcriptase assay for the quantitation of retroviruses in cell culture supernatants. J Virol Methods 156, 1–7 (2009). [DOI] [PubMed] [Google Scholar]
- 55.Gault J et al. High-resolution mass spectrometry of small molecules bound to membrane proteins. Nat Methods 13, 333–6 (2016). [DOI] [PMC free article] [PubMed] [Google Scholar]
- 56.Hernandez H & Robinson CV Determining the stoichiometry and interactions of macromolecular assemblies from mass spectrometry. Nat Protoc 2, 715–26 (2007). [DOI] [PubMed] [Google Scholar]
- 57.Marty MT et al. Bayesian deconvolution of mass and ion mobility spectra: from binary interactions to polydisperse ensembles. Anal Chem 87, 4370–6 (2015). [DOI] [PMC free article] [PubMed] [Google Scholar]
- 58.Silva JC et al. Quantitative proteomic analysis by accurate mass retention time pairs. Anal Chem 77, 2187–200 (2005). [DOI] [PubMed] [Google Scholar]
- 59.Frigola J, Remus D, Mehanna A & Diffley JF ATPase-dependent quality control of DNA replication origin licensing. Nature 495, 339–43 (2013). [DOI] [PMC free article] [PubMed] [Google Scholar]
- 60.Ulm JW, Perron M, Sodroski J & R, C.M. Complex determinants within the Moloney murine leukemia virus capsid modulate susceptibility of the virus to Fv1 and Ref1-mediated restriction. Virology 363, 245–55 (2007). [DOI] [PubMed] [Google Scholar]
- 61.Robert X & Gouet P Deciphering key features in protein structures with the new ENDscript server. Nucleic Acids Res 42, W320–4 (2014). [DOI] [PMC free article] [PubMed] [Google Scholar]
Associated Data
This section collects any data citations, data availability statements, or supplementary materials included in this article.
Supplementary Materials
Data Availability Statement
The cryo-EM maps and the refined atomic model of DmSERINC were deposited in the EMDB and wwPDB, respectively, with accession codes EMD-10277 and EMD-10279 and PDB 6SP2. Source data for Figures 4a, 4b, 4c, 4e and for Extended Data Figures 1a, 1c, 1d, 1e, 2b, 3b, 4g–i, 6e–g, are available with the paper online.


