Abstract
These studies test, using intravital microscopy (IVM), the hypotheses that perfusion effects on insulin-stimulated muscle glucose uptake (MGU) are 1) capillary recruitment independent and 2) mediated through the dispersion of glucose rather than insulin. For experiment 1, capillary perfusion was visualized before and after intravenous insulin. No capillary recruitment was observed. For experiment 2, mice were treated with vasoactive compounds (sodium nitroprusside, hyaluronidase, and lipopolysaccharide), and dispersion of fluorophores approximating insulin size (10-kDa dextran) and glucose (2-NBDG) was measured using IVM. Subsequently, insulin and 2[14C]deoxyglucose were injected and muscle phospho-2[14C]deoxyglucose (2[C14]DG) accumulation was used as an index of MGU. Flow velocity and 2-NBDG dispersion, but not perfused surface area or 10-kDa dextran dispersion, predicted phospho-2[14C]DG accumulation. For experiment 3, microspheres of the same size and number as are used for contrast-enhanced ultrasound (CEU) studies of capillary recruitment were visualized using IVM. Due to their low concentration, microspheres were present in only a small fraction of blood-perfused capillaries. Microsphere-perfused blood volume correlated to flow velocity. These findings suggest that 1) flow velocity rather than capillary recruitment controls microvascular contributions to MGU, 2) glucose dispersion is more predictive of MGU than dispersion of insulin-sized molecules, and 3) CEU measures regional flow velocity rather than capillary recruitment.
Keywords: capillary recruitment, insulin resistance, intravital microscopy
INTRODUCTION
Despite progress in the last several decades, the mechanisms of resistance to insulin-stimulated muscle glucose uptake (MGU) remain to be fully defined. Previous studies show molecular defects within the myocyte (26, 41, 42) but also suggest a causal role for defects in skeletal muscle perfusion (1, 5, 59). One hypothesis regarding the role of microvascular perfusion in insulin-stimulated MGU is that insulin recruits previously nonperfused capillaries (58). This capillary recruitment is thought to enhance dispersion of insulin into the muscle interstitium, thus supporting insulin-stimulated MGU. Measures thought to reflect capillary recruitment are diminished with insulin resistance (13, 32), and these findings are in accord with reports of impaired insulin and glucose delivery (8, 60).
While the concept of insulin-stimulated capillary recruitment in skeletal muscle has led to valuable insights (4, 58, 65), results have differed depending on the experimental approach. Studies supporting the existence of insulin-stimulated capillary recruitment have largely relied on contrast-enhanced ultrasound (CEU), which uses intravenously infused microbubbles to produce a signal thought to reflect capillary blood volume (17, 43, 58). Intravital microscopy studies that directly observe the muscle microcirculation, on the other hand, find that nearly all skeletal muscle capillaries are perfused at baseline (34, 43), thus precluding further recruitment. Insulin efflux from skeletal muscle capillaries requires several minutes, whereas capillary transit time is no more than a few seconds (51). Thus insulin delivery to the interstitium is strongly diffusion limited and increased flow velocity without capillary recruitment would not be expected to influence insulin delivery (33, 47).
Glucose, in contrast to insulin, exhibits a measurable arteriovenous concentration difference that expands with insulin stimulation (31). Reductions in flow velocity would therefore be expected to influence its delivery even if capillary permeability and recruitment status were not altered (33, 47). Moreover, studies of metabolic fluxes across whole limbs suggest an independent role for glucose delivery to MGU (2), and metabolic control analysis suggests that delivery of glucose to the myocyte is a site of resistance to insulin-stimulated MGU in obese rats (61). As with capillary recruitment, however, results depend on the experimental approach. Interstitial glucose as measured using a continuous glucose monitor (CGM) lags blood glucose by several minutes (10), suggesting a diffusion-limited (rather than perfusion-limited) profile. CGM findings may be complicated by site of sensor implantation and physiological responses to sensor implantation. However, whole limb interstitial glucose estimated using lymph measurements also lags blood glucose by several minutes, even after correcting for the intrinsic latency of lymph (46). Depending on perspective, it has been assumed that dispersion of glucose is either near immediate or that it requires several minutes. This incongruity stems from the absence of a direct assessment of the dispersion of glucose from capillary blood into the surrounding interstitium in vivo.
Step-wise consideration of the physical processes responsible for delivering glucose and insulin to the myocyte was used in the present study to resolve these discrepancies. Before their arrival at the sarcolemma, glucose and insulin must first arrive in capillary blood. This step is affected by several perfusion parameters, including flow velocity, distribution of blood flow among available capillaries, and the fraction of capillaries perfused (33). Next, glucose and insulin must cross the capillary endothelium into the interstitium. This step is influenced by the selective permeability of the endothelium and by vesicular transcytosis (6). Finally, glucose and insulin must traverse the interstitium to the myocyte. While it is established that transendothelial efflux is rate limiting for insulin delivery (5, 63), the relative importance of vascular arrival, transendothelial efflux, and interstitial dispersion for glucose delivery has received less consideration.
Previous studies concerning the role of perfusion in insulin-stimulated glucose uptake have relied on bulk or indirect measures of microvascular perfusion and exchange. Direct measures of capillary perfusion and exchange were therefore used in the present study to understand the relative importance of flow velocity and perfused surface area. In this study, we directly measured the relevant parameters in hundreds of individual capillaries in vivo using state-of-the-art fluorescent intravital microscopy (IVM). The experiments included in this study serve to provide a direct test of the hypotheses that 1) insulin stimulates capillary recruitment in skeletal muscle, 2) glucose delivery to the myocyte is perfusion and not diffusion limited, and 3) the delivery of glucose (60) is a significant physiological barrier to insulin-stimulated MGU. These data have practical implications not only for understanding insulin action in physiology but for providing insight into potential treatments of insulin resistance.
RESEARCH DESIGN AND METHODS
Common Techniques for All Experiments
Animals.
Lean male C57BL/6J mice aged 9–16 wk were used for all studies. Mice were single housed and implanted with in-dwelling jugular vein and carotid artery catheters as previously described (64). Mice were weighed before experimentation to ensure recovery to within 10% of presurgery body weight. Mice were fasted for 5–7 h before beginning metabolic or microscopy studies to standardize the conditions used for physiological baseline measurements. A total of 84 mice were used for this study. All procedures were approved by the Vanderbilt Institutional Animal Care and Use Committee.
Intravital microscopy preparation.
Intravital microscopy was performed as previously described (34, 63, 64). All studies were performed while mice were under isoflurane anesthesia (SomnoSuite; Kent Scientific). Doses of 2 and 1.5% isoflurane were used for induction and maintenance of anesthesia, respectively. The lateral gastrocnemius was exposed for visualization by trimming away skin and fascia and then placed on a glass coverslip immersed in 0.9% saline. Body temperature of 37°C was maintained using a homeothermic heating blanket and temperature probe (Harvard Apparatus). Approximately 8 mg/kg (100-μL injection volume) of a tetramethyl-rhodamine (TMR)-labeled 2-megadalton (mDa) dextran (Thermo Fisher) was infused through the jugular vein catheter as a fluorescent plasma marker. Imaging began after allowing TMR to recirculate for 3 min. This technique has been shown to provide stable perfusion and not to cause inflammation and photobleaching (34, 64).
Statistics.
All statistical analyses were performed in Prism GraphPad (GraphPad Software, Inc.). Treatment group comparisons were performed using a one-way ANOVA with Dunnet’s correction for multiple comparisons, while glucose tolerance test results were analyzed using a two-way paired ANOVA. Correlations were assessed using Pearson’s R, and pre- vs. postinsulin comparisons were performed using a paired t-test. ANCOVA was used to assess group differences in regression slopes. The D’Agostino and Pearson omnibus normality test was used to assess departure from normal distributions. No distributions in this study were nonnormal (all P = NS). Statistical significance is reported using precise P values or P < 0.0001 as appropriate.
Experiment 1: Capillary Recruitment in Response to Insulin
Study design.
Microvascular perfusion was measured before and after injection with 100 mU/kg insulin (Novilin R; Novo Nordisk) including 0.5 g/kg dextrose to prevent hypoglycemia (Hospira). Following induction of anesthesia and surgical preparation, mice equilibrated on the microscope for 15 min to ensure a stable physiological baseline. Next, microvascular perfusion was recorded in five fields of view (FOVs). Because previous IVM studies have reported near-total capillary recruitment at baseline (34, 43) and venules account for up to 70% of microvascular blood volume (7), we hypothesized that CEU changes following insulin infusion might reflect dilation of venules too small to be individually distinguished using CEU rather than capillary recruitment per se. Therefore, three FOVs focusing on postcapillary venules <100 µm in diameter were recorded for each mouse, and venule diameter pre- vs. postinsulin injection was recorded manually using ImageJ (52). Capillary recruitment has been reported as early as 5–7 min in response to insulin (58). Our microvascular perfusion quantification technique was validated for a time course of 5 min (34), which should be adequate to see capillary recruitment should it exist (58). Flow velocity, capillary recruitment, hematocrit, and venular diameter measurements were repeated in the same FOVs 5 min postinjection.
Quantification of microvascular perfusion.
Capillary flow velocity, hematocrit, and density were quantified as previously described (34). Briefly, 5-s videos of the gastrocnemius microcirculation acquired at 100 frames/s were processed to remove motion artifacts, identify in-focus capillaries, and track the motion of red blood cells (RBCs) based on the shadows they produce in plasma fluorescence. Perfusion metrics included mean capillary flow velocity (MFV; µm/s), perfusion heterogeneity index (PHI; a unitless measure of spatial flow variability), and proportion of perfused vessels (PPV; fraction of total capillary density with any detectable flow during the 5-s video). PHI was defined according to Eq. 1:
| (1) |
Here, V̄max and V̄min represent velocity in the fastest and slowest flowing capillaries, respectively. Five fields of view were captured for each mouse, and MFV and PHI as reported for each mouse represent an average of all five acquisitions. These settings yielded perfusion measurements in 136 ± 28 capillaries per video for an average of 680 individual capillaries per mouse. In addition to perfusion measures, the total length of plasma-perfused vessel segments was normalized to FOV area as a metric of capillary density in millimeters per millimeters squared.
Experiment 2a: Perfusion Versus Diffusion Limitation of Glucose Delivery
Study design.
Microvascular perfusion, permeability, and dispersion of a fluorescent glucose analogue, 2-NBDG (69), were measured following treatment with microcirculation-altering drugs. Separate cohorts of mice were used for microvascular perfusion (see Quantification of microvascular perfusion) and fluorophore dispersion (see Quantification of 2-NBDG dispersion and Quantification of 10-kDa dextran dispersion) measurements. Mice were divided into four treatment groups intended to produce a range of microvascular perfusion and permeability states, and outcomes were compared both within and between groups. In one group, mice were studied 45 min after intravenous injection with 75 U Streptomyces hyaluronidase (n ≥ 8) as a model of endothelial glycocalyx degradation (9). A second group was studied 2 h after injection with 2 mg/kg lipopolysaccharide (LPS; n ≥ 7) as a model of inflammation. A third group was studied beginning after 15 min of continuous infusion with 37 µg·kg−1·min−1 sodium nitroprusside (n ≥ 8) as a model of microvascular nitric oxide (NO) effects. No differences in any perfusion metric were found between 45-min (n = 6) and 120-min (n = 5) vehicle-treated controls. Consequently, vehicle-treated mice were combined into a single control group for analysis of microvascular perfusion effects (n = 11).
Quantification of 2-NBDG dispersion.
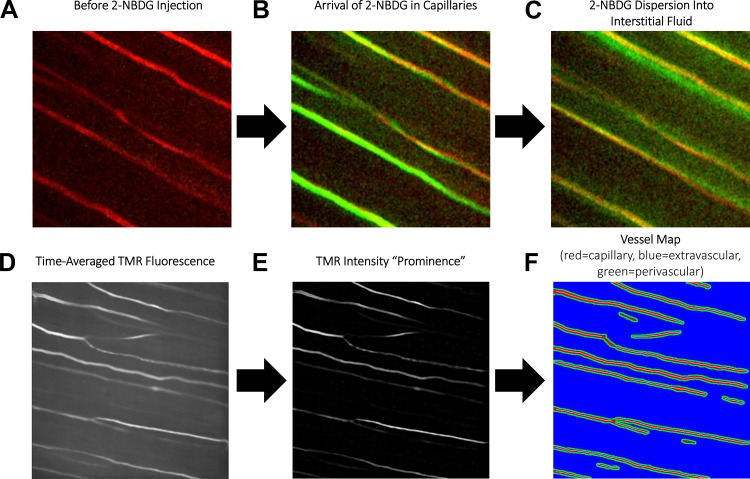
Fluorescent glucose analogue 2-NBDG (69) was used for visualization of the movement of glucose in vivo. 2-NBDG dispersion was visualized using a spinning disk microscope (Nikon Instruments) equipped with a Yokogawa CSU-X1 spinning disk head, an Andor DU-897 EMCCD camera, and a Plan Apo Lambda ×20 objective (0.75 NA). Simultaneous illumination with 488 nm (16.25 mW) and 564 nm (21.5 mW) laser diodes was used to excite 2-NBDG and TMR fluorescence, respectively. An exposure of 70 ms was used for each channel, and the resulting time series was acquired at 4.72 frames/s with a pixel size of 0.65 µm. Five successive injections with 1 µg 2-NBDG in 40 µL of saline were used to record 45 s of 2-NBDG dispersion in separate fields of view. 2-NBDG visualization using these acquisition settings is illustrated in Fig. 1, A–C.
Fig. 1.
Illustration of 2-NBDG dispersion imaging technique. A: tetramethyl-rhodamine (TMR) is used to visualize capillaries before 2-NBDG injection. B: 2-NBDG quickly arrives in skeletal muscle capillaries following intravenous injection (3–5 s postinjection). C: 2-NBDG then diffuses out from capillaries into the surrounding tissue (10–15 s postinjection). D: time-averaged TMR fluorescence is used as a reference for automated detection of capillaries. E: background subtraction isolates plasma fluorescence in an intensity “prominence” image. F: this intensity prominence image is then automatically segmented into capillary (red), extravascular (blue), and perivascular (green) masks. Kinetics of 2-NBDG fluorescence in each compartment are then recorded to quantify vascular arrival, transendothelial efflux, and interstitial dispersion.
To quantify 2-NBDG dispersion, a custom analysis script was created in Matlab 2017. Raw microscope videos were processed to remove breathing motion artifacts (34). 2-NBDG fluorescence in the first frame of each video was subtracted from all subsequent frames to eliminate residual 2-NBDG fluorescence from previous acquisitions. Next, a time average of TMR fluorescence was calculated (Fig. 1D), and the 20 × 20 pixel (13 × 13 µm) local average intensity was subtracted to remove background (Fig. 1E). Pixels with intensity at least 2.5% greater than the local average (34) were taken to be plasma-perfused capillaries (Fig. 1F, red), while regions within five pixels (3.25 µm) of plasma-perfused regions (64) were defined as perivascular space (Fig. 1F, green), and the remainder of the field of view was defined as extravascular space (Fig. 1F, blue).
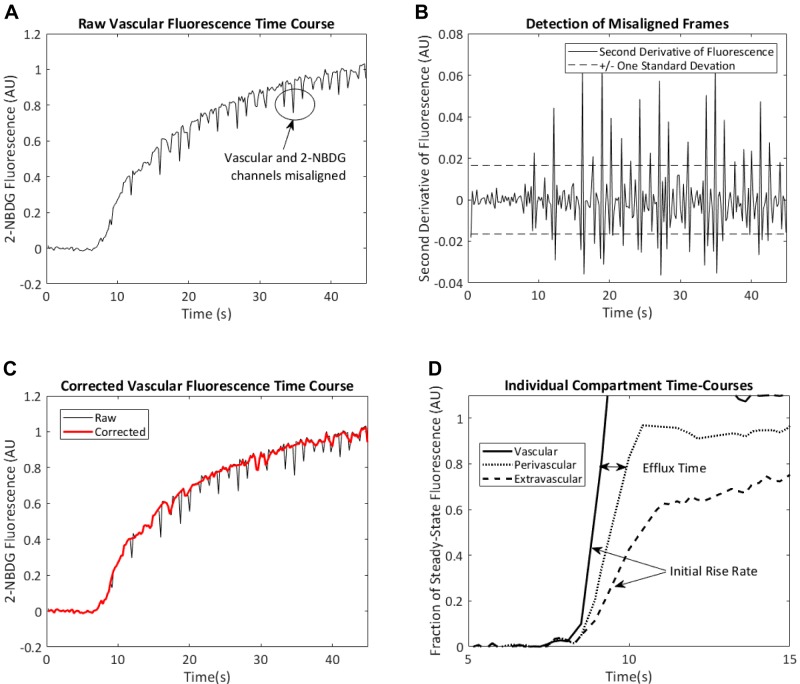
The kinetics of 2-NBDG fluorescence within each compartment were then used to measure dispersion. Despite stabilization, raw time courses included frames in which TMR and 2-NBDG channels were misaligned, producing sudden deviations in 2-NBDG fluorescence (Fig. 2A). These frames were detected using the second derivative of 2-NBDG fluorescence with respect to time. Frames for which the second derivative of fluorescence intensity was >1 SD from the mean (Fig. 2B) were removed, resulting in a corrected 2-NBDG fluorescence time course without large deviations (Fig. 2C).
Fig. 2.
Noise filtering and quantification of 2-NBDG arrival curves. A: motion artifacts result in periodic misalignment of vascular and 2-NBDG channels. B: these misaligned frames produce large spikes in the second derivative of 2-NBDG fluorescence with respect to time. C: removal of frames in which the second derivative of 2-NBDG fluorescence is >1 SD away from 0 results in a smoother 2-NBDG arrival curve. D: after removal of the misaligned frames, the initial rates of increase of 2-NBDG fluorescence in the vascular and extravascular channels were used as indexes of blood flow and glucose delivery, respectively. The time delay between 80% steady-state vascular fluorescence and 80% steady-state perivascular fluorescence (i.e., efflux time) is recorded as an index of time delay required for transendothelial 2-NBDG efflux. AU, aribtrary units.
The initial rise rates (reported in 1/s) in the vascular and extravascular compartments (vascular arrival and interstitial dispersion, respectively) were then determined according to the time required for 2-NBDG fluorescence increase from 20 to 50% of its steady-state value in each compartment. These cutoff values were chosen based on the approximately linear increase observed in this range. The time delay between 80% steady-state fluorescence the vascular and perivascular compartments was recorded as a metric of time required for transendothelial efflux of 2-NBDG. A cutoff value of 80% was chosen to reflect values just before perivascular 2-NBDG fluorescence begins to plateau, thus maximizing the signal-to-noise ratio while minimizing the confounding effects of nonlinear kinetics. These metrics are illustrated in Fig. 2D (axes truncated to emphasize initial onset). The rate of vascular arrival and perivascular efflux time were recorded on a per-capillary basis. This procedure was repeated in five FOVs per mouse for an average of 70 ± 10 individual capillary measurements per mouse.
Quantification of 10-kDa dextran dispersion.
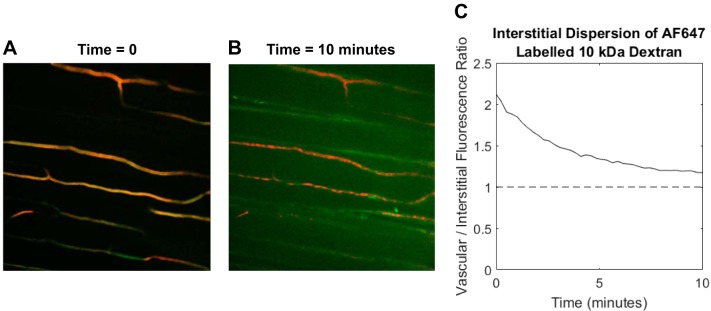
Following 2-NBDG visualization, mice received intravenous injections with 20 µg of AlexaFluor647-labeled (AF647) 10-kDa dextran (Thermo Fisher) in 100 µL saline to visualize effects on capillary permeability to an insulin-sized molecule. Ten kilodaltons of dextran have a diameter of ~4.7 nm (19) compared with ~5 nm for insulin (50). Insulin has previously been shown to exit skeletal muscle capillaries by nonspecific fluid-phase transit (64), and it is an established physical principle that diffusion in porous media depends on solute size (28). Vascular (TMR) and AF647 10-kDa fluorescence was visualized by successive illumination with 561- and 647-nm diode lasers (21.5 and 37.5 mW, respectively) with 200-ms exposure for each channel. Images were acquired every 15 s for 10 min in a single FOV. Initial and final images from a representative time series are shown in Fig. 3, A and B. Videos were processed to identify vascular and extravascular compartments as described in Quantification of 2-NBDG dispersion. The ratio of extravascular to vascular AF647 fluorescence over time (Fig. 3C) was used to estimate the rate of 10-kDa dextran dispersion.
Fig. 3.
Software quantification of 10-kDa dextran dispersion. A: immediately after injection, 10-kDa dextran fluorescence is confined to plasma-perfused capillaries. B :10 min following injection, significant interstitial 10-kDa dextran fluorescence is observed (note that image brightness was increased to enhance visibility). C: the decay in the plasma to interstitial fluorescence ratio is used as a measure of 10-kDa dextran dispersion.
We have previously shown that insulin efflux from skeletal muscle capillaries occurs through nonspecific fluid-phase endothelial transport (64). This was supported by the fact that capillary insulin efflux is nonsaturable and not reliant on the insulin receptor. Therefore, AF647 10-kDa dextran was used because it is similar in size to insulin but without complications due to insulin bioactivity. This is an important issue when one considers that the dose of AF647 insulin required for direct visualization is supraphysiological (63, 64), whereas the plasma insulin levels in the present study were physiological (see Fig. 10). Thus the use of 10-kDa dextran as a surrogate for insulin was intended to capture insulin-relevant biophysical effects on perfused surface area and capillary permeability without the need for high insulin concentrations that may confound interpretation.
Fig. 10.
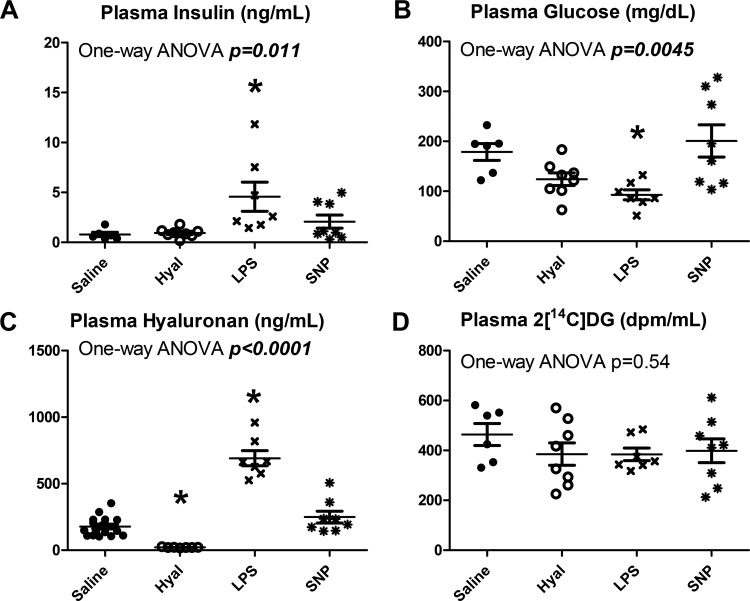
Treatment group differences in plasma analytes. A: plasma insulin varied significantly between groups (P = 0.011). B: plasma glucose varied significantly between groups (P = 0.0045). C: plasma hyaluronan varied significantly between groups (P < 0.0001). D: plasma 2[14C]deoxyglucose (2[C14]DG) did not differ between groups (P = 0.54). Closed circles represent saline-treated mice, open circles represent hyaluronidase (Hyal)-treated mice, and x symbols represent LPS-treated mice. *Statistical differences from saline controls after correction for multiple comparisons for sodium nitroprusside (SNP)-treated mice.
Experiment 2b: Glucose Dispersion as a Determinant of Glucose Uptake
Study design.
To test the hypothesis that the arrival of glucose (as opposed to insulin) at the sarcolemma may limit insulin-stimulated MGU, data from perfusion experiments were analyzed using equations defined previously (33) to make predictions concerning delivery of perfusion-limited and diffusion-limited molecules (see Delivery indexes). These predictions were then compared with indexes of insulin-stimulated MGU (see Assessment of phospho-2[14C]DG accumulation) obtained in mice used for fluorophore dispersion experiments. To test insulin-stimulated MGU, mice received intravenous injections of 100 mU/kg insulin (Novilin R; Novo Nordisk) including 0.5 g/kg (Hospira) dextrose to prevent hypoglycemia and 2[14C]deoxyglucose (2[C14]DG) to determine an index of MGU (see Assessment of phospho-2[14C]DG accumulation). Fifteen minutes following injections, mice were euthanized, and tissues were collected and frozen for subsequent analyses.
Delivery indexes.
Indexes of vascular delivery to myocytes were derived from a previous publication (33) as shown in Eq. 2:
| (2) |
Here, DI represents delivery index, CD represents plasma-perfused capillary density, Vi represents flow velocity in vessel i, n represents the number of vessel segments tracked in each field of view, and τ is a rate constant for exchange between blood and the interstitium. Perfusion-limited molecules exhibit near-complete equilibration with the interstitium during capillary transit, while diffusion-limited molecules exhibit little arteriovenous difference (47). Thus, for perfusion-limited delivery indexes, a value was used corresponding to 99% equilibration at a typical baseline capillary flow velocity of Vi = 400 µm/s (34) (τ = 1842 s/µm). For a diffusion-limited delivery index, a value corresponding to 1% equilibrium at Vi = 400 µm/s was used (τ = 4.02 s/µm). Diffusion-limited delivery indexes were adjusted for group differences in capillary permeability to AF647 10-kDa dextran by multiplying DI as calculated in Eq. 2 by the rate of AF647 10-kDa dextran clearance from capillary blood in each treatment group (see Quantification of 10-kDa dextran dispersion). Blood flow and its distribution were visualized using a fluorescent plasma marker (TMR), since glucose/insulin dispersion delivery indexes are dependent on plasma fluxes rather than RBC fluxes.
Assessment of phospho-2[14C]DG accumulation.
An index of glucose uptake was assessed by measuring phospho-2[14C]DG radioactivity in the gastrocnemius, vastus lateralis, and brain following injection of insulin plus 2[14C]DG. Muscle radioactivity was normalized to brain radioactivity as previously described (20). Gastrocnemius phospho-2[14C]DG accumulation was used for consistency with imaging experiments, while vastus lateralis phospho-2[14C]DG accumulation was used as a comparator to test whether IVM procedures influenced results.
Assessment of insulin signaling.
To assess insulin signaling, phosphorylation of Akt and IRS1 was assessed by immunoblotting in frozen gastrocnemius samples collected following efflux imaging. Samples were homogenized using a bullet blender (Next Advance) in an extraction buffer comprised of 20 mM NaCl, 20 mM Tris·HCl, 0.1 mM EDTA, 1% Triton X-100, 0.5% sodium deoxycholate, and 0.1% β mercaptoethanol (pH 7.4). Homogenized samples were then centrifuged (15 min at 1,000 g and 4°C), and the supernatant protein concentration was assessed using the Bradford method (Bio-Rad, Hercules, CA). Samples were denatured at 70°C, and 20 µg protein were loaded into each well of a 17-well NuPAGE 4–12% Bis-Tris gel (Invitrogen, Carlsbad, CA). Following electrophoresis, proteins were transferred to a PVDF membrane.
Membranes were then cut at ~100 kDa to allow separate probing for IRS1 and Akt. After blocking with Odyssey Blocking Buffer (Li-Cor), antibodies for insulin-sensitive Akt (Ser473 site) and IRS1(Ser302 site) phosphorylation sites (Cell Signaling No. 4060S and 2491S, respectively) were used at 1:1,000 to probe the corresponding portions of the membrane. Anti-rabbit 800-nm secondary antibody (Li-Cor) was then used at 1:10,000 dilution to illuminate bands. Bands were quantified by densitometry using ImageJ (52) to measure Akt and IRS1 phosphorylation sites in whole muscle protein extracts.
Plasma analytes.
Blood samples were collected at the end of each efflux imaging experiment by cardiac puncture, and plasma was isolated by centrifugation of blood for 1 min at 16,000 g and collection supernatant. Plasma was stored at −80°C. Plasma insulin was measured by double-antibody radioimmunoassay (37). Plasma glucose and 2[14C]DG were measured after deproteinization with BaOH and ZnSO4 (56). Hyaluronan (HA) levels were assessed using an HA ELISA (DHYAL0; R&D Systems).
Effects of 2-NBDG on glucose metabolism.
2-NBDG competes with d-glucose for glucose transporter activity (39, 69). To assess the possibility that injection with 2-NBDG could confound the metabolic end points included in this study, glucose tolerance tests were performed in mice following treatment with 5 µg 2-NBDG (n = 6) and equivalent volume of saline (n = 6). For consistency with imaging experiments, studies were performed in mice anesthetized with isoflurane. Blood glucose was recorded before experiments and again 10 min following saline injection with or without 2-NBDG. Next, mice received intravenous injections of 1 mg/kg dextrose with 2[14C]DG. Blood glucose was then tested every 5 min until 30 min postinjection.
Experiment 3: Distribution of Microspheres Versus Plasma
Results obtained using IVM diverge from those obtained using CEU (5, 13, 58). To resolve this discrepancy, a third experiment was conducted. Green fluorescent 3-μm diameter latex microspheres (Sigma) at a concentration of 5 × 10⁷ spheres/mL were mixed into the TMR bolus used for plasma visualization in all IVM experiments and infused intravenously for simultaneous visualization with TMR. Whereas previous studies comparing CEU and IVM results have used the two techniques in different portions of the vasculature (57), microspheres and TMR were visualized in the same FOV for 15 s each in the present study. This procedure was repeated in three separate FOVs per mouse in each of n = 8 mice. Raw microscope videos were then analyzed as previously described to subtract background fluorescence and identify capillaries perfused with each contrast agent (34). These conditions were designed to simulate the particle size, concentration, and acquisition parameters used to assess capillary recruitment in CEU studies (62). Perfused surface area as a fraction of total FOV area was compared between TMR and microspheres to test the hypothesis that only a subset of plasma-perfused capillaries receive microsphere perfusion. To test the hypothesis that microsphere-perfused volume reflects regional flow velocity rather than capillary recruitment, microsphere-perfused blood volume was compared with both perfusion-limited delivery indexes (calculated from flow velocity and flow distribution) and diffusion-limited delivery indexes (calculated from perfused surface area, see Delivery indexes for Experiment 2b for delivery index calculations).
RESULTS
Acute Microvascular Responses to Insulin
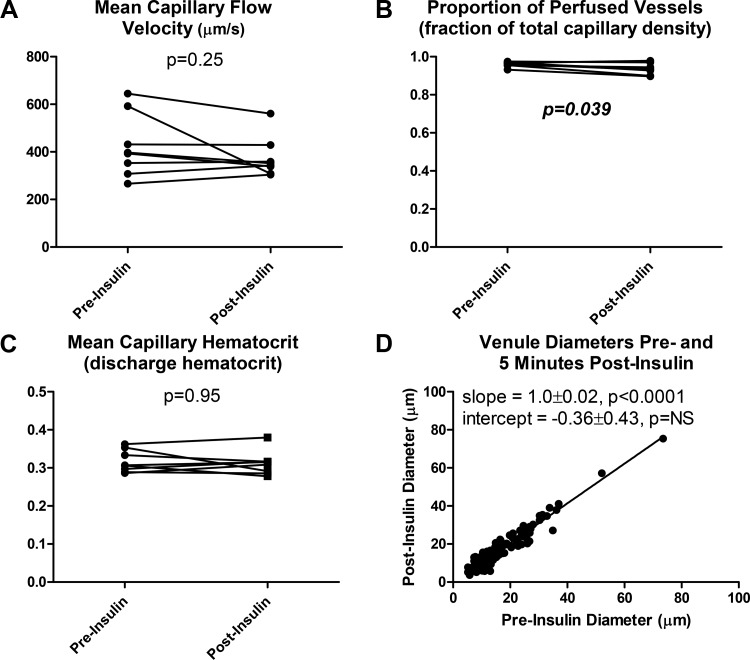
Mean capillary flow velocity (MFV) did not change in response to insulin (Fig. 4A). The proportion of perfused vessels (PPV) of over 95% was observed preinsulin, and a small but statistically significant decrease of ~3% was observed following insulin injection (Fig. 4B). Mean capillary discharge hematocrit (i.e., hematocrit of effluent blood) did not change in response to insulin (Fig. 4C). Venular diameter was statistically indistinguishable pre- and postinsulin, with a best fit line of y = x indicating no significant change across the entire range of observed diameters (Fig. 4D).
Fig. 4.
Microvascular responses to intravenous injection with 100 mU/kg insulin and 0.5 g/kg glucose. A: mean capillary flow velocity did not significantly change pre- vs. 5 min postinsulin (P = 0.25). B: the proportion of perfused vessels underwent a small but statistically significant increase pre- vs. postinsulin (P = 0.039). C: mean capillary discharge hematocrit (hematocrit of effluent blood) did not significantly change pre- vs. postinsulin (P = 0.95). D: venule diameter postinsulin was statistically indistinguishable from venule diameter preinsulin (R2 = 0.93, P < 0.0001).
Perfusion Effects on 2-NBDG Dispersion
Group differences in microvascular perfusion.
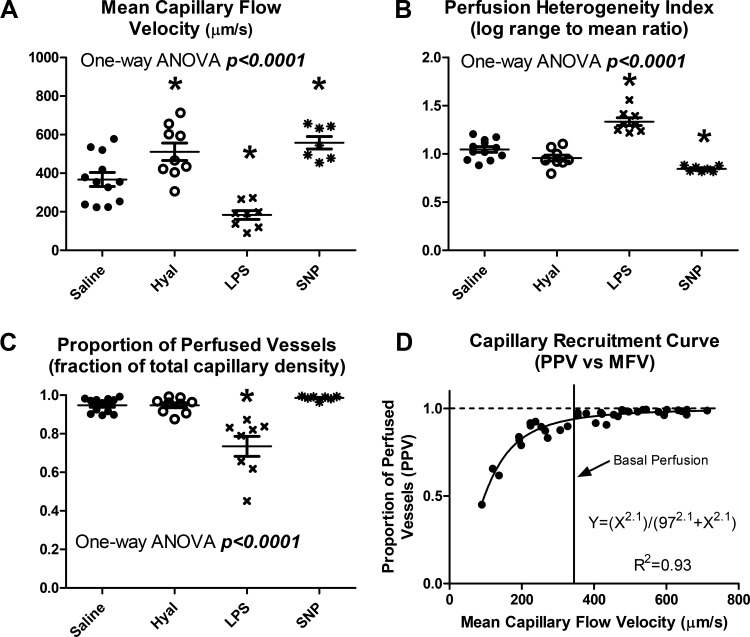
The drug treatments selected for this study produced a wide range of microvascular perfusion states, with significant group differences in all metrics (Fig. 5, A–C, all P < 0.0001). Plotting PPV as a function of MFV reveals a consistent capillary recruitment curve across all groups, with near-total capillary recruitment at or above basal flow velocity, and progressive loss of capillary perfusion in hypoperfused states (Fig. 5D). This capillary recruitment curve was well described by a Hill equation (R2 = 0.93) with an exponent of 2.1 and Ka of 97 µm/s, suggesting a highly nonlinear relationship between flow velocity and capillary recruitment, with 50% recruitment achieved at a flow velocity of ~97 µm/s.
Fig. 5.
Group differences in microvascular perfusion. A: mean capillary flow velocity varied significantly between groups (P < 0.0001). B: perfusion heterogeneity index varied significantly between groups (P < 0.0001). C: the proportion of perfused vessels varied significantly between groups (P < 0.0001). D: plotting the proportion of perfused vessels (PPV) against mean capillary flow velocity (MFV) reveals a consistent capillary recruitment curve, for which all capillaries are recruited at or above basal flow rates, and capillaries are progressively derecruited under low-flow conditions. Closed circles represent saline-treated mice, open circles represent hyaluronidase-treated mice, and x symbols represent LPS-treated mice. *Statistical differences from saline controls after correction for multiple comparisons for sodium nitroprusside-treated mice.
2-NBDG and 10-kDa dextran dispersion.
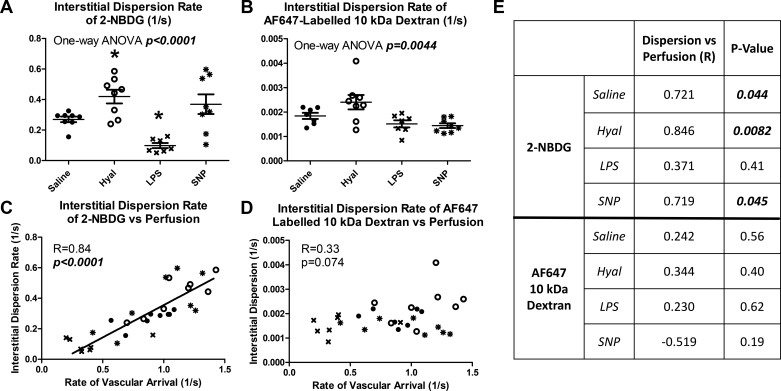
Interstitial dispersion of 2-NBDG varied significantly between groups, with similar patterns to those observed in capillary flow velocity (P < 0.0001, Fig. 6A). Dispersion of AF647 10-kDa dextran also varied significantly between groups but with a different pattern of group differences (P = 0.0044, Fig. 6B). Vascular arrival rates and interstitial dispersion rates were correlated for 2-NBDG (Fig. 6C, R = 0.84, P < 0.0001) but not for 10-kDa dextran (Fig. 6D, R = 0.33, P = 0.074). The linear regression relating vascular arrival to 2-NBDG dispersion rate was consistent across all treatment groups (regressions differ at P = 0.22). The differing importance of flow velocity for dispersion of 2-NBDG and AF647 10-kDa dextran is further illustrated by within-group correlation analysis (Fig. 6E). The rate of vascular arrival was significantly (P < 0.05) correlated with 2-NBDG dispersion rate in three of four treatment groups, while no within-groups correlations were observed for 10-kDa dextran (all P = NS). Finally, transendothelial efflux of 2-NBDG did not significantly differ between groups (P = 0.10) and required an average of 3.17 s.
Fig. 6.
Perfusion determines the interstitial dispersion of 2-NBDG but not of 10-kDa dextran. A: 2-NBDG dispersion rate varied significantly between groups (P < 0.0001). B: 10-kDa dextran dispersion rate varied significantly between groups (P = 0.0044). C: vascular arrival and interstitial dispersion rate of 2-NBDG were closely correlated (R = 0.84, P < 0.0001). D: vascular arrival and interstitial dispersion of 10-kDa dextran are not correlated (R = 0.33, P = 0.074). E: within-group comparisons of vascular arrival vs. interstitial dispersion 2-NBDG and 10-kDa dextran, showing significant correlations within 3 of 4 groups for 2-NBDG and in no groups for 10-kDa dextran. Closed circles represent saline-treated mice, open circles represent hyaluronidase (Hyal)-treated mice, and x symbols represent LPS-treated mice. *Statistical differences from saline controls after correction for multiple comparisons for sodium nitroprusside (SNP)-treated mice.
Perfusion Versus Diffusion Limitations in Muscle Glucose Metabolism
Delivery indexes and phospho-2[14C]DG accumulation.
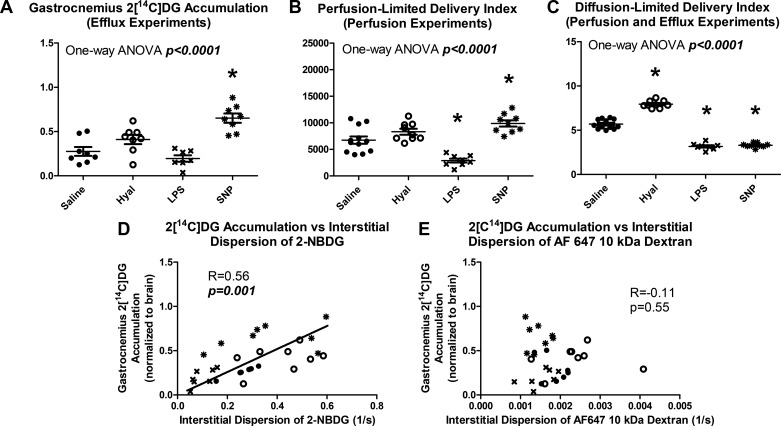
Gastrocnemius phospho-2[14C]DG accumulation in efflux experiments varied significantly between groups, and group differences paralleled those in capillary flow velocity and 2-NBDG dispersion (P < 0.0001, Fig. 7A). Similar group differences were also observed in the vastus lateralis, indicating that IVM did not affect the relationships. Predicted delivery of perfusion-limited molecules followed similar group differences to those observed in phospho-2[14C]DG accumulation and 2-NBDG dispersion (Fig. 7B). Predicted delivery of diffusion-limited molecules, on the other hand, was unrelated to either phospho-2[14C]DG accumulation or 2-NBDG dispersion but instead paralleled 10-kDa dextran dispersion (Fig. 7C). Perfusion limitation of phospho-2[14C]DG accumulation was further supported by a correlation between interstitial dispersion of 2-NBDG and phospho-2[14C]DG accumulation (Fig. 7D, R = 0.56, P = 0.001). The slope of the linear regression relating 2-NBDG delivery to phospho-2[14C]DG accumulation did not significantly differ between treatment groups (P = 0.76) indicating that drug treatments did not alter this relationship. No correlation was observed between phospho-2[14C]DG accumulation and interstitial dispersion of 10-kDa dextran (Fig. 7E, R = −0.11, P = 0.55).
Fig. 7.
Skeletal muscle phospho-2[14C]deoxyglucose (2[C14]DG) accumulation is well described as a perfusion-limited process. A: gastrocnemius phospho-2[14C]DG accumulation varied significantly between groups (P < 0.0001). B: a perfusion-limited delivery index calculated from perfusion measurements showed similar treatment group differences to phospho-2[14C]DG accumulation. C: diffusion-limited delivery index calculated from perfusion and permeability measurements did not resemble differences in phospho-2[14C]DG accumulation. D: gastrocnemius phospho-2[14C]DG accumulation correlated with interstitial dispersion rate of 2-NBDG (R = 0.56, P = 0.01). E: Gastrocnemius phospho-2[14C]DG accumulation did not correlate with 10-kDa dextran delivery (R = −0.11, P = 0.55). Closed circles represent saline-treated mice, open circles represent hyaluronidase-treated mice, and x symbols represent LPS-treated mice. *Statistical differences from saline controls after correction for multiple comparisons for sodium nitroprusside (SNP)-treated mice.
Insulin signaling.
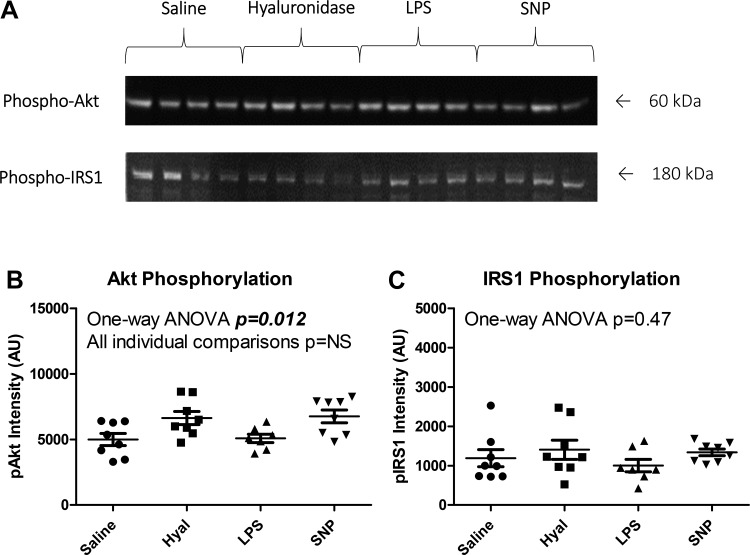
Phospho-Akt band intensity differed between groups as analyzed by one-way ANOVA (P = 0.012), but no individual group differences retained significance after correction for multiple comparisons (all P = NS). Phospho-IRS1 band intensity did not differ between groups (P = 0.47). Raw data and representative blot images are shown in Fig. 8.
Fig. 8.
Insulin signaling did not differ between groups. A: representative blots for phospho-Akt and phospho-IRS1. B: Akt phosphorylation differed between groups by one-way ANOVA (P = 0.012), but no individual group comparisons were statistically significant (all P = NS). C: IRS1 phosphorylation did not differ between groups (P = 0.47). SNP, sodium nitroprusside; AI arbitrary units.
Differences Between Microsphere and Plasma Distribution
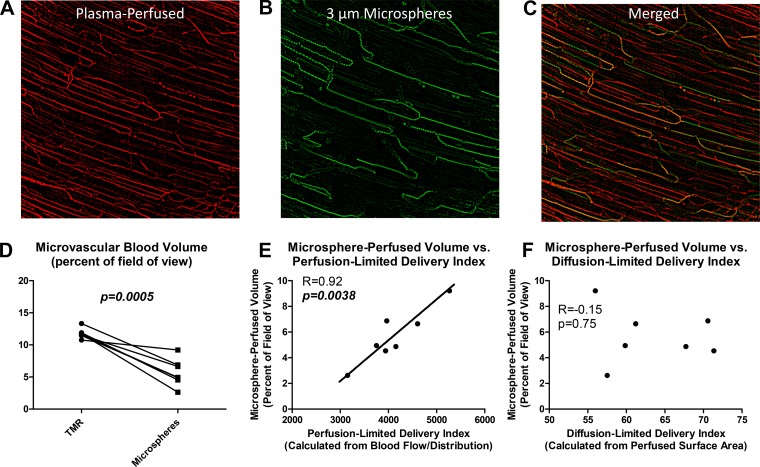
Visualization of microspheres and plasma in the same field of view revealed a marked difference between microsphere and plasma distribution (Fig. 9, A–C). The fraction of the field of view with detectable plasma fluorescence in any given 15-s window was 11.8 ± 0.8%, as opposed to 5.7 ± 2.1% for microspheres (Fig. 9D, P = 0.0005). The volume of blood containing microspheres was closely correlated to perfusion-limited delivery index (calculated from flow velocity and flow distribution, Fig. 9E, R = 0.92, P = 0.0038) but not to diffusion-limited delivery index (calculated from plasma-perfused surface area Fig. 9F, R = −0.15, P = 0.75). This demonstrates that microsphere distribution is unrelated to plasma-perfused surface area.
Fig. 9.
Three-micrometer diameter microspheres perfuse only a subset of plasma-perfused capillaries. A: background-subtracted tetramethyl-rhodamine (TMR) fluorescence in a representative field of view, showing a dense network of plasma-perfused capillaries. B: background-subtracted microsphere fluorescence in the same field of view, showing a comparatively sparse capillary network. C: merge of TMR and microsphere channels showing distinct differences in perfusion patterns for microspheres relative to plasma. D: microsphere-perfused blood volume is significantly less than TMR-perfused blood volume. E: microsphere-perfused blood volume correlates closely to perfusion-limited delivery index (a measure of blood flow and its distribution). F: microsphere-perfused blood volume does not correlate to diffusion-limited delivery index (a measure of plasma-perfused surface area).
Plasma Analytes
Plasma insulin differed significantly between groups (P = 0.011, Fig. 10A). Plasma glucose differed significantly between groups (P = 0.0045, Fig. 10B). Plasma hyaluronan differed significantly between groups (P < 0.0001, Fig. 10C). Plasma 2[14C]DG levels, however, did not significantly differ between groups (Fig. 10D, P = 0.54).
Metabolic Effects of 2-NBDG
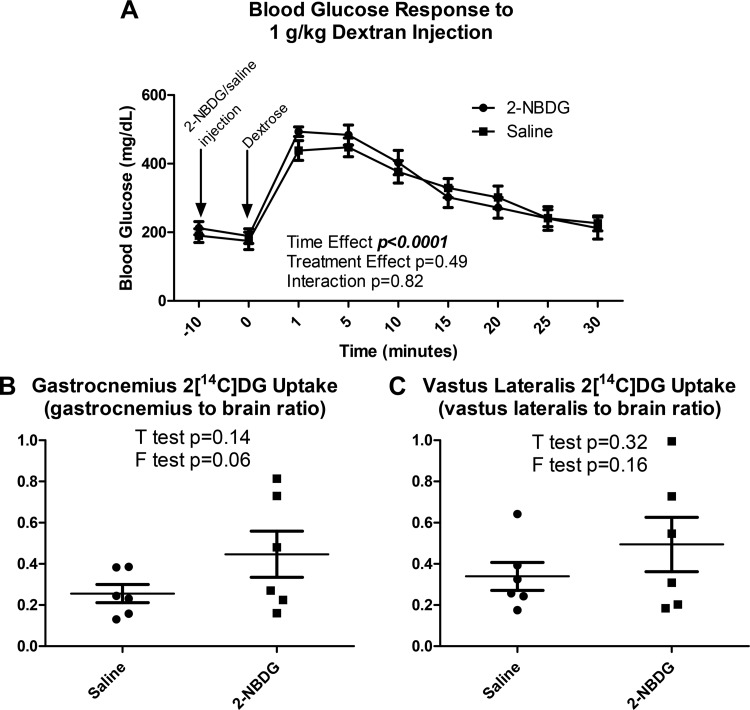
Neither vehicle nor 2-NBDG significantly altered blood glucose 10 min postinjection, and blood glucose responses to intravenous 1 mg/kg dextrose injections were similar between groups (Fig. 11A, P = 0.49). Phospho-2[14C]DG accumulation (Fig. 11, B and C) following an intravenous glucose challenge did not differ with 2-NBDG injection in either the gastrocnemius (P = 0.14) or the vastus lateralis (P = 0.32). Because variance in phospho-2[14C]DG accumulation appeared to be greater in 2-NBDG-treated mice (Fig. 11, B and C), an F test was performed to assess the statistical significance of this effect. Variance did not significantly differ between 2-NBDG-treated and saline-treated mice in either the gastrocnemius or the vastus lateralis (both P > 0.05).
Fig. 11.
2-NBDG injection did not substantively alter whole body or gastrocnemius glucose metabolism. A: neither an acute blood glucose response to 2-NBDG injection nor a difference in blood glucose responses to intravenous dextrose injection following 2-NBDG injection was observed (time effect: P < 0.0001; treatment effect: P = 0.49). B: gastrocnemius phospho-2[14C]deoxyglucose (2[C14]DG) accumulation did not differ with 2-NBDG injection relative to saline-injected controls (P = 0.14). C: vastus lateralis phospho-2[14C]DG accumulation did not differ with 2-NBDG injection relative to saline-injected controls (P = 0.32).
DISCUSSION
In contrast to previous studies of the microcirculation in muscle metabolism (4, 5, 13, 58), we found no evidence of increased surface area for microvascular exchange following insulin injection. However, we observed that insulin-stimulated phospho-2[14C]DG accumulation in skeletal muscle can be predicted from measurements of capillary flow velocity and interstitial dispersion of a fluorescent glucose analogue. Contrary to reports of a several-minute delay in interstitial glucose levels (10, 46), we observed that 2-NBDG crosses the capillary endothelium within seconds and is overwhelmingly perfusion limited, with essentially no diffusion-based barriers to interstitial dispersion. Whereas recent studies regarding the role of perfusion in insulin-stimulated MGU generally focus on capillary recruitment (4, 5, 13, 58) and insulin dispersion (8, 64), the present findings suggest that flow velocity and the rate of glucose dispersion are more predictive of variations in MGU. While it is possible that the effects of insulin on perfusion might have been greater with a higher dose or longer duration of treatment, additional capillary recruitment is unlikely to be significant should it even occur, given that baseline recruitment was ~95%.
These results differ from studies attributing perfusion effects on glucose metabolism to capillary recruitment-mediated enhancement of insulin dispersion (5, 13). Capillary recruitment-based explanations for the relationship between perfusion and metabolism have proliferated in large part due to studies finding a robust correlation between CEU signal (which is usually interpreted to indicate capillary recruitment) and muscle metabolism (5, 13, 32, 49, 58). A capillary recruitment-based interpretation for CEU has historically been supported by comparison to measures of 1-methylxanthine metabolism (45) and laser Dopper flowmetry (12). These three techniques all rely on different mechanisms to generate a signal, and so their concordance lends credibility to the overall paradigm. However, none of these techniques has been compared with a direct measurement or observation of the microcirculation, and so the connection to capillary recruitment remains hypothetical rather than empirical in nature.
Previous studies have combined IVM and CEU measures but assessed different parts of the circulation with each technique (57). By contrast, the studies of microsphere distribution included in the present article directly compared plasma and RBC flow to distribution of microspheres at the same size and concentration as are used for CEU. Both measurements were taken in the same FOV near simultaneously (consecutive 15-s intervals). The finding that microsphere-perfused volume depended upon flow velocity and not capillary recruitment suggests that traditional, capillary recruitment-based interpretations of CEU data should be revised to a flow velocity-based interpretation. Further supporting this concept, capillary recruitment-based interpretations of CEU data yield estimates of capillary density as high as 20% of total tissue volume (11), far exceeding true capillary density. A flow velocity-based interpretation of CEU data does not require this sort of contradiction and yet retains the explanatory power of the technique. Overall, the results of the present study suggest that the concordance of CEU with MGU is better explained by flow velocity and glucose dispersion rather than capillary recruitment and insulin dispersion.
One area in which this interpretation may prove challenging is in the context of exercise. An extensive body of literature spanning over a century has reported capillary recruitment in the context of muscle contractions (21, 27, 38), and many of these foundational studies measured perfusion in skeletal muscle capillaries using IVM (25, 30, 53). However, there is a fundamental difference between these earlier studies and contemporary IVM. In older IVM preparations, muscle oxygenation was not controlled, and the imaged surface of the tissue was exposed to atmospheric oxygen concentrations (43). Contemporary IVM techniques generally involve some combination of super-perfusion of the muscle with a gas-controlled medium and alteration of surgical techniques such as in the present study to avoid unnecessary exposure of the muscle to room air. With appropriate oxygenation, IVM shows an increase in flow velocity rather than perfused capillary density with muscle contractions (23). Furthermore, in recent studies using IVM techniques ensuring normal muscle oxygenation, high baseline capillary recruitment is consistently observed across multiple species (including mice, hamsters, and rats), multiple anesthetic regimens (including isoflurane, ketamine/xylazine, pentobarbital, and fully conscious), and multiple surgical preparations (9, 22, 23, 34, 40, 43, 48, 67).
The extrapolation of microscopy data in the present study to CEU signal must consider low concentration of microspheres used in CEU experiments. There are ~12 billion RBCs in a mouse, and 5 million microspheres were administered in the present study for consistency with CEU. Thus there are 2,400 RBCs for each microsphere. A capillary flowing at <160 RBCs per second therefore may not receive a microsphere within any given 15-s window of observation (160 RBCs per second times 15 s = 2,400 RBCs). At a mean capillary discharge hematocrit of ~0.3 (as reported in Fig. 4C) and an RBC diameter of ~7 µm, this corresponds to a flow velocity of ~3,700 µm/s to reliably receive microsphere perfusion. Mean capillary flow velocity was ~400 µm/s in the present study, indicating that most perfused capillaries will not contain microspheres (and empirically, most did not). Consistent with this analysis, we have previously observed a much higher mean flow velocity when it was measured using microspheres compared with plasma and RBCs (34, 35).
Considering these mathematical relationships, it is unsurprising that CEU would detect a greater microsphere-perfused volume under hyperemic conditions. During hyperemia, the number of capillaries with a flow velocity high enough to receive microsphere perfusion would be expected increase. The effects of low microsphere concentration could theoretically be avoided by using a higher concentration of microspheres, but even if CEU microspheres could safely be infused at a concentration approaching that of RBCs, microvascular distribution of particulates (such as RBCs and microspheres) is different from that of plasma (18, 29, 44). This discrepancy between particulate and plasma distribution is critical since it is plasma, and not RBCs, that carries insulin and glucose to the muscle. This analysis does not contest the predictive value of CEU in studies of muscle metabolism (5, 13, 32, 58), which remains a reproducible and important finding. However, it appears that a more mechanistic interpretation of CEU data would be to use it as an index of the number of fast-flowing capillaries (and thus local flow velocity) rather than the number of capillaries receiving blood flow (and thus capillary recruitment).
Consistent with this flow-based interpretation of CEU data, we found that capillary flow velocity was a robust predictor of an index of MGU. This finding may help to explain the classic results from Baron and colleagues, who reported that bulk blood flow is an important determinant of MGU (2, 3). Perfusion dependency of MGU is generally observed under conditions such as exercise or hyperinsulinemia that also promote glucose transporter translocation to the muscle membrane (4, 54). Here we extend these findings to show that the physiological covariates of inflammation, glycocalyx degradation, and NO signaling did not interfere with the relationships between capillary flow velocity, dispersion of glucose into the muscle interstitium, and insulin-stimulated MGU. Each of the drug treatments used in this study exerts strong biochemical effects on whole body glucose metabolism (14, 36, 66), with complications as severe as sepsis (35). Despite these would-be confounding effects, the relationships between capillary flow velocity, 2-NBDG dispersion, and phospho-2[14C]DG accumulation were consistent across all treatment groups and were not accounted for by changes in either insulin signaling or capillary density/permeability. These data suggest that the previously reported importance of perfusion for MGU holds true for a wide variety of physiological states and further support our published analyses predicting that the arrival of glucose, as opposed to insulin, at the sarcolemma can limit MGU in vivo (33, 60). As long as there is sufficient membrane permeability to glucose, delivery-limited MGU is important under a broad range of conditions.
It should be noted in interpretation of our results that while 2-NBDG is the most biophysically similar molecule to glucose that can be visualized using fluorescence IVM, its twofold greater molecular weight (69) results in slower diffusion (28). This difference between glucose and 2-NBDG makes our conclusion that much more convincing since 2-NBDG overestimates the importance of diffusion-based parameters (e.g., endothelial permeability, capillary recruitment) and underestimates the importance of capillary flow velocity and glucose dispersion. Thus the limitations of 2-NBDG further strengthen the conclusion that MGU is more sensitively controlled by perfusion limitations than diffusion limitations. Visualizing movement of fluorescent insulin from the capillaries requires supraphysiological fluorescent insulin concentrations. The 10-kDa dextran was used as a surrogate for insulin so that insulin concentrations could remain physiological. The 10-kDa dextran has a diameter within 6% of that of insulin (5.0 vs. ~4.7 nm) (19, 28). A dextran is appropriate from the standpoint that insulin efflux from skeletal muscle capillaries does not depend on the insulin receptor (64). While the 10-kDa dextran should be effective in assessing microcirculatory parameters highly relevant to insulin dispersion (i.e., permeability and perfused surface area), it does not necessarily capture all aspects of the dispersion of actual insulin. Diffusion in porous media depends on solute size and although insulin and 10-kDa dextran are of similar diameter, insulin weighs ~40% less. Moreover, insulin may have unique interactions with the glycocalyx or proteins that the effect dispersion rate.
Confounding effects of the techniques employed in this study cannot be ruled out. However, we have previously shown stable microvascular perfusion and a lack of phototoxicity or inflammation in previous studies using this IVM preparation (34, 64). Here, we extend these findings to show that group differences in phospho-2[14C]DG accumulation in the gastrocnemius did not differ from the vastus lateralis, which was not surgically or optically manipulated. Furthermore, no effects of 2-NBDG administration were noted on fasting blood glucose or glucose tolerance. The anesthetic regimen used in this study was selected for its minor effects on cardiovascular and metabolic function compared with other anesthetics. Fasting blood glucose was ~200 mg/dL in the present study and mean arterial pressure was ~90 mmHg as observed with previous studies (34) compared with >300 mg/dL and ~50 mmHg with ketamine/xylazine (63, 64). In addition, while potential differences between the normal human microcirculation versus that of an anesthetized mouse must be acknowledged, it is noteworthy that CEU studies have reported changes to microvascular function in anesthetized rodents that parallel those seen in clinical studies (55, 58). Finally, it is theoretically possible that translocation of glucose transporters to the muscle membrane could have been regulated independently of both capillary permeability and surface area (and thus insulin at the muscle membrane) as well as insulin signaling through Akt or IRS1. However, even if this unlikely event had occurred, it still would not change the fact that biophysical parameters influencing glucose dispersion were more predictive of phospho-[14C]DG accumulation than were those influencing insulin dispersion.
These data demonstrate that perfusion controls glucose delivery to skeletal muscle independently of capillary recruitment and that interstitial dispersion of glucose occurs within seconds. Additionally, the interstitial dispersion of a glucose analogue in skeletal muscle correlated more closely to insulin-stimulated phospho-2[14C]DG accumulation than either insulin signaling or endothelial permeability to an insulin-sized fluorescent dextran. The conditions used in this study did not affect insulin signaling in the muscle, thus enabling analysis of glucose dispersion effects independently of differing myocellular insulin stimulation. These relationships were robust to the physiological covariates and off-target effects of glycocalyx degradation, inflammation, and NO signaling, rigorously confirming that the rate of glucose dispersion into the interstitium is an independent determinant of insulin-stimulated glucose uptake. The effects of metabolic disease states upon these parameters could conceivably alter these relationships and remain to be defined.
Resting muscle blood flow is generally reduced in type 2 diabetes (15, 16, 40, 68). Based on the results of the present study, a causal role for these perfusion deficits in insulin resistance cannot be definitively ruled out. At a minimum, reduced muscle blood flow is sufficient to cause skeletal muscle insulin resistance to MGU by limiting the dispersion of glucose into the muscle interstitium. Widespread hypotheses regarding the role of perfusion in glucose metabolism thus appear to have been correct, but it seems that capillary flow velocity and glucose dispersion, rather than capillary recruitment and glucose dispersion, are the more predictive variables. These findings provide a mechanistic basis for the aggregation of microvascular and metabolic disease and suggest that therapies targeting the microcirculation will be beneficial under conditions in which insulin resistance occurs despite glucose transporter translocation to the muscle membrane.
GRANTS
This study was funded by National Institute of Diabetes and Digestive and Kidney Diseases Grants DK-059637, DK-054902, DK-050277, T32-DK-101003, F32-DK-120104, and P30-DK-020593 and the American Heart Association Peripheral Artery Disease Strategically Focused Research Network at Vanderbilt University.
DISCLOSURES
No conflicts of interest, financial or otherwise, are declared by the authors.
AUTHOR CONTRIBUTIONS
P.M.M., I.M.W., and N.A.M. conceived and designed research; P.M.M., Z.X., and C.C.H. performed experiments; P.M.M. analyzed data; P.M.M., I.M.W., N.A.M., O.P.M., and D.H.W. interpreted results of experiments; P.M.M. and Z.X. prepared figures; P.M.M. drafted manuscript; P.M.M., N.A.M., C.C.H., O.P.M., J.A.B., and D.H.W. edited and revised manuscript; P.M.M., I.M.W., Z.X., N.A.M., C.C.H., O.P.M., J.A.B., and D.H.W. approved final version of manuscript.
ACKNOWLEDGMENTS
We acknowledge Freyja James and Deanna Bracy for performing mouse catheterization surgeries for this study and Bryan Millis for assistance in determining appropriate acquisition parameters for microscopy experiments. Additionally, we acknowledge the use of equipment and services provided by the Vanderbilt Nikon Center of Excellence, Mouse Metabolic Phenotyping Center, Hormone Analysis Core, and Diabetes Research and Training Center.
REFERENCES
- 1.Ayala JE, Bracy DP, Julien BM, Rottman JN, Fueger PT, Wasserman DH. Chronic treatment with sildenafil improves energy balance and insulin action in high fat-fed conscious mice. Diabetes 56: 1025–1033, 2007. doi: 10.2337/db06-0883. [DOI] [PubMed] [Google Scholar]
- 2.Baron AD, Steinberg H, Brechtel G, Johnson A. Skeletal muscle blood flow independently modulates insulin-mediated glucose uptake. Am J Physiol Endocrinol Metab 266: E248–E253, 1994. doi: 10.1152/ajpendo.1994.266.2.E248. [DOI] [PubMed] [Google Scholar]
- 3.Baron AD, Steinberg HO, Chaker H, Leaming R, Johnson A, Brechtel G. Insulin-mediated skeletal muscle vasodilation contributes to both insulin sensitivity and responsiveness in lean humans. J Clin Invest 96: 786–792, 1995. doi: 10.1172/JCI118124. [DOI] [PMC free article] [PubMed] [Google Scholar]
- 4.Baron AD, Tarshoby M, Hook G, Lazaridis EN, Cronin J, Johnson A, Steinberg HO. Interaction between insulin sensitivity and muscle perfusion on glucose uptake in human skeletal muscle: evidence for capillary recruitment. Diabetes 49: 768–774, 2000. doi: 10.2337/diabetes.49.5.768. [DOI] [PubMed] [Google Scholar]
- 5.Barrett EJ, Eggleston EM, Inyard AC, Wang H, Li G, Chai W, Liu Z. The vascular actions of insulin control its delivery to muscle and regulate the rate-limiting step in skeletal muscle insulin action. Diabetologia 52: 752–764, 2009. doi: 10.1007/s00125-009-1313-z. [DOI] [PMC free article] [PubMed] [Google Scholar]
- 6.Barrett EJ, Wang H, Upchurch CT, Liu Z. Insulin regulates its own delivery to skeletal muscle by feed-forward actions on the vasculature. Am J Physiol Endocrinol Metab 301: E252–E263, 2011. doi: 10.1152/ajpendo.00186.2011. [DOI] [PMC free article] [PubMed] [Google Scholar]
- 7.Boushel R, Langberg H, Olesen J, Gonzales-Alonzo J, Bülow J, Kjaer M. Monitoring tissue oxygen availability with near infrared spectroscopy (NIRS) in health and disease. Scand J Med Sci Sports 11: 213–222, 2001. doi: 10.1034/j.1600-0838.2001.110404.x. [DOI] [PubMed] [Google Scholar]
- 8.Broussard JL, Castro AV, Iyer M, Paszkiewicz RL, Bediako IA, Szczepaniak LS, Szczepaniak EW, Bergman RN, Kolka CM. Insulin access to skeletal muscle is impaired during the early stages of diet-induced obesity. Obesity (Silver Spring) 24: 1922–1928, 2016. doi: 10.1002/oby.21562. [DOI] [PMC free article] [PubMed] [Google Scholar]
- 9.Cabrales P, Vázquez BY, Tsai AG, Intaglietta M. Microvascular and capillary perfusion following glycocalyx degradation. J Appl Physiol (1985) 102: 2251–2259, 2007. doi: 10.1152/japplphysiol.01155.2006. [DOI] [PubMed] [Google Scholar]
- 10.Cengiz E, Tamborlane WV. A tale of two compartments: interstitial versus blood glucose monitoring. Diabetes Technol Ther 11, Suppl 1: S11–S16, 2009. doi: 10.1089/dia.2009.0002. [DOI] [PMC free article] [PubMed] [Google Scholar]
- 11.Chadderdon SM, Belcik JT, Smith E, Pranger L, Kievit P, Grove KL, Lindner JR. Activity restriction, impaired capillary function, and the development of insulin resistance in lean primates. Am J Physiol Endocrinol Metab 303: E607–E613, 2012. doi: 10.1152/ajpendo.00231.2012. [DOI] [PMC free article] [PubMed] [Google Scholar]
- 12.Clark AD, Barrett EJ, Rattigan S, Wallis MG, Clark MG. Insulin stimulates laser Doppler signal by rat muscle in vivo, consistent with nutritive flow recruitment. Clin Sci (Lond) 100: 283–290, 2001. doi: 10.1042/cs1000283. [DOI] [PubMed] [Google Scholar]
- 13.Clerk LH, Vincent MA, Jahn LA, Liu Z, Lindner JR, Barrett EJ. Obesity blunts insulin-mediated microvascular recruitment in human forearm muscle. Diabetes 55: 1436–1442, 2006. doi: 10.2337/db05-1373. [DOI] [PubMed] [Google Scholar]
- 14.Eskens BJ, Mooij HL, Cleutjens JP, Roos JM, Cobelens JE, Vink H, Vanteeffelen JW. Rapid insulin-mediated increase in microvascular glycocalyx accessibility in skeletal muscle may contribute to insulin-mediated glucose disposal in rats. PLoS One 8: e55399, 2013. doi: 10.1371/journal.pone.0055399. [DOI] [PMC free article] [PubMed] [Google Scholar]
- 15.Frisbee JC. Impaired dilation of skeletal muscle microvessels to reduced oxygen tension in diabetic obese Zucker rats. Am J Physiol Heart Circ Physiol 281: H1568–H1574, 2001. doi: 10.1152/ajpheart.2001.281.4.H1568. [DOI] [PubMed] [Google Scholar]
- 16.Frisbee JC, Wu F, Goodwill AG, Butcher JT, Beard DA. Spatial heterogeneity in skeletal muscle microvascular blood flow distribution is increased in the metabolic syndrome. Am J Physiol Regul Integr Comp Physiol 301: R975–R986, 2011. doi: 10.1152/ajpregu.00275.2011. [DOI] [PMC free article] [PubMed] [Google Scholar]
- 17.Furlow B. Contrast-enhanced ultrasound. Radiol Technol 80: 547S–561S, 2009. [PubMed] [Google Scholar]
- 18.Gaehtgens P, Pries A, Albrecht KH. Model experiments on the effect of bifurcations on capillary blood flow and oxygen transport. Pflugers Arch 380: 115–120, 1979. doi: 10.1007/BF00582145. [DOI] [PubMed] [Google Scholar]
- 19.Granath KA, Kvist BE. Molecular weight distribution analysis by gel chromatography on Sephadex. J Chromatogr A 28: 69–81, 1967. doi: 10.1016/S0021-9673(01)85930-6. [DOI] [PubMed] [Google Scholar]
- 20.Halseth AE, Bracy DP, Wasserman DH. Overexpression of hexokinase II increases insulinand exercise-stimulated muscle glucose uptake in vivo. Am J Physiol Endocrinol Metab 276: E70–E77, 1999. doi: 10.1152/ajpendo.1999.276.1.E70. [DOI] [PubMed] [Google Scholar]
- 21.Honig CR, Odoroff CL, Frierson JL. Active and passive capillary control in red muscle at rest and in exercise. Am J Physiol Heart Circ Physiol 243: H196–H206, 1982. doi: 10.1152/ajpheart.1982.243.2.H196. [DOI] [PubMed] [Google Scholar]
- 22.Kindig CA, Poole DC. A comparison of the microcirculation in the rat spinotrapezius and diaphragm muscles. Microvasc Res 55: 249–259, 1998. doi: 10.1006/mvre.1998.2075. [DOI] [PubMed] [Google Scholar]
- 23.Kindig CA, Richardson TE, Poole DC. Skeletal muscle capillary hemodynamics from rest to contractions: implications for oxygen transfer. J Appl Physiol (1985) 92: 2513–2520, 2002. doi: 10.1152/japplphysiol.01222.2001. [DOI] [PubMed] [Google Scholar]
- 24.Kindig CA, Sexton WL, Fedde MR, Poole DC. Skeletal muscle microcirculatory structure and hemodynamics in diabetes. Respir Physiol 111: 163–175, 1998. doi: 10.1016/S0034-5687(97)00122-9. [DOI] [PubMed] [Google Scholar]
- 25.Klitzman B, Damon DN, Gorczynski RJ, Duling BR. Augmented tissue oxygen supply during striated muscle contraction in the hamster. Relative contributions of capillary recruitment, functional dilation, and reduced tissue PO2. Circ Res 51: 711–721, 1982. doi: 10.1161/01.RES.51.6.711. [DOI] [PubMed] [Google Scholar]
- 26.Koves TR, Ussher JR, Noland RC, Slentz D, Mosedale M, Ilkayeva O, Bain J, Stevens R, Dyck JR, Newgard CB, Lopaschuk GD, Muoio DM. Mitochondrial overload and incomplete fatty acid oxidation contribute to skeletal muscle insulin resistance. Cell Metab 7: 45–56, 2008. doi: 10.1016/j.cmet.2007.10.013. [DOI] [PubMed] [Google Scholar]
- 27.Krogh A. August Krogh-Nobel Lecture: a contribution to the physiology of the capillaries. Nobel Lectures, Physiology or Medicine 1921: 1–8, 1901. [Google Scholar]
- 28.Kärger J, Valiullin R. Diffusion in porous media. In: eMagRes, edited by Harris RK, Wasylishen RL. New York: Wiley, 2011. [Google Scholar]
- 29.Ley K, Pries AR, Gaehtgens P. Preferential distribution of leukocytes in rat mesentery microvessel networks. Pflugers Arch 412: 93–100, 1988. doi: 10.1007/BF00583736. [DOI] [PubMed] [Google Scholar]
- 30.Lindbom L, Tuma RF, Arfors KE. Influence of oxygen on perfused capillary density and capillary red cell velocity in rabbit skeletal muscle. Microvasc Res 19: 197–208, 1980. doi: 10.1016/0026-2862(80)90040-0. [DOI] [PubMed] [Google Scholar]
- 31.Lipman RL, Raskin P, Love T, Triebwasser J, Lecocq FR, Schnure JJ. Glucose intolerance during decreased physical activity in man. Diabetes 21: 101–107, 1972. doi: 10.2337/diab.21.2.101. [DOI] [PubMed] [Google Scholar]
- 32.Liu Z, Liu J, Jahn LA, Fowler DE, Barrett EJ. Infusing lipid raises plasma free fatty acids and induces insulin resistance in muscle microvasculature. J Clin Endocrinol Metab 94: 3543–3549, 2009. doi: 10.1210/jc.2009-0027. [DOI] [PMC free article] [PubMed] [Google Scholar]
- 33.McClatchey PM, Frisbee JC, Reusch JE. A conceptual framework for predicting and addressing the consequences of disease-related microvascular dysfunction. Microcirculation 24: e12359, 2017. doi: 10.1111/micc.12359. [DOI] [PMC free article] [PubMed] [Google Scholar]
- 34.McClatchey PM, Mignemi NA, Xu Z, Williams IM, Reusch JE, McGuinness OP, Wasserman DH. Automated quantification of microvascular perfusion. Microcirculation 25: e12482, 2018. doi: 10.1111/micc.12482. [DOI] [PMC free article] [PubMed] [Google Scholar]
- 35.Mignemi NA, McClatchey PM, Kilchrist KV, Williams IM, Millis BA, Syring KE, Duvall CL, Wasserman DH, McGuinness OP. Rapid changes in the microvascular circulation of skeletal muscle impair insulin delivery during sepsis. Am J Physiol Endocrinol Metab 316: E1012–E1023, 2019. doi: 10.1152/ajpendo.00501.2018. [DOI] [PMC free article] [PubMed] [Google Scholar]
- 36.Moller DE. Potential role of TNF-alpha in the pathogenesis of insulin resistance and type 2 diabetes. Trends Endocrinol Metab 11: 212–217, 2000. doi: 10.1016/S1043-2760(00)00272-1. [DOI] [PubMed] [Google Scholar]
- 37.Morgan CR, Lazarow A. Immunoassay of pancreatic and plasma insulin following alloxan injection of rats. Diabetes 14: 669–671, 1965. doi: 10.2337/diab.14.10.669. [DOI] [PubMed] [Google Scholar]
- 38.Mulder AH, van Dijk AP, Smits P, Tack CJ. Real-time contrast imaging: a new method to monitor capillary recruitment in human forearm skeletal muscle. Microcirculation 15: 203–213, 2008. doi: 10.1080/10739680701610681. [DOI] [PubMed] [Google Scholar]
- 39.O’Neil RG, Wu L, Mullani N. Uptake of a fluorescent deoxyglucose analog (2-NBDG) in tumor cells. Mol Imaging Biol 7: 388–392, 2005. doi: 10.1007/s11307-005-0011-6. [DOI] [PubMed] [Google Scholar]
- 40.Padilla DJ, McDonough P, Behnke BJ, Kano Y, Hageman KS, Musch TI, Poole DC. Effects of type II diabetes on capillary hemodynamics in skeletal muscle. Am J Physiol Heart Circ Physiol 291: H2439–H2444, 2006. doi: 10.1152/ajpheart.00290.2006. [DOI] [PubMed] [Google Scholar]
- 41.Petersen KF, Shulman GI. Pathogenesis of skeletal muscle insulin resistance in type 2 diabetes mellitus. Am J Cardiol 90, 5A: 11G–18G, 2002. doi: 10.1016/S0002-9149(02)02554-7. [DOI] [PubMed] [Google Scholar]
- 42.Plomgaard P, Bouzakri K, Krogh-Madsen R, Mittendorfer B, Zierath JR, Pedersen BK. Tumor necrosis factor-alpha induces skeletal muscle insulin resistance in healthy human subjects via inhibition of Akt substrate 160 phosphorylation. Diabetes 54: 2939–2945, 2005. doi: 10.2337/diabetes.54.10.2939. [DOI] [PubMed] [Google Scholar]
- 43.Poole DC, Copp SW, Ferguson SK, Musch TI. Skeletal muscle capillary function: contemporary observations and novel hypotheses. Exp Physiol 98: 1645–1658, 2013. doi: 10.1113/expphysiol.2013.073874. [DOI] [PMC free article] [PubMed] [Google Scholar]
- 44.Pries AR, Ley K, Claassen M, Gaehtgens P. Red cell distribution at microvascular bifurcations. Microvasc Res 38: 81–101, 1989. doi: 10.1016/0026-2862(89)90018-6. [DOI] [PubMed] [Google Scholar]
- 45.Rattigan S, Clark MG, Barrett EJ. Hemodynamic actions of insulin in rat skeletal muscle: evidence for capillary recruitment. Diabetes 46: 1381–1388, 1997. doi: 10.2337/diab.46.9.1381. [DOI] [PubMed] [Google Scholar]
- 46.Rebrin K, Steil GM. Can interstitial glucose assessment replace blood glucose measurements? Diabetes Technol Ther 2: 461–472, 2000. doi: 10.1089/15209150050194332. [DOI] [PubMed] [Google Scholar]
- 47.Renkin EM. Transcapillary exchange in relation to capillary circulation. J Gen Physiol 52: 96–108, 1968. doi: 10.1085/jgp.52.1.96. [DOI] [PMC free article] [PubMed] [Google Scholar]
- 48.Richardson TE, Kindig CA, Musch TI, Poole DC. Effects of chronic heart failure on skeletal muscle capillary hemodynamics at rest and during contractions. J Appl Physiol (1985) 95: 1055–1062, 2003. doi: 10.1152/japplphysiol.00308.2003. [DOI] [PubMed] [Google Scholar]
- 49.Russell RD, Hu D, Greenaway T, Blackwood SJ, Dwyer RM, Sharman JE, Jones G, Squibb KA, Brown AA, Otahal P, Boman M, Al-Aubaidy H, Premilovac D, Roberts CK, Hitchins S, Richards SM, Rattigan S, Keske MA. Skeletal muscle microvascular-linked improvements in glycemic control from resistance training in individuals with type 2 diabetes. Diabetes Care 40: 1256–1263, 2017. doi: 10.2337/dc16-2750. [DOI] [PubMed] [Google Scholar]
- 50.Sakabe N, Sakabe K, Sasaki K. X-ray studies of water structure in 2 Zn insulin crystal. J Biosci 8: 45–55, 1985. doi: 10.1007/BF02703966. [DOI] [Google Scholar]
- 51.Sarelius IH. Cell flow path influences transit time through striated muscle capillaries. Am J Physiol Heart Physiol 250: H899–H907, 1986. doi: 10.1152/ajpheart.1986.250.6.H899. [DOI] [PubMed] [Google Scholar]
- 52.Schneider CA, Rasband WS, Eliceiri KW. NIH Image to ImageJ: 25 years of image analysis. Nat Methods 9: 671–675, 2012. doi: 10.1038/nmeth.2089. [DOI] [PMC free article] [PubMed] [Google Scholar]
- 53.Segal SS. Microvascular recruitment in hamster striated muscle: role for conducted vasodilation. Am J Physiol Heart Circ Physiol 261: H181–H189, 1991. doi: 10.1152/ajpheart.1991.261.1.H181. [DOI] [PubMed] [Google Scholar]
- 54.Sjøberg KA, Frøsig C, Kjøbsted R, Sylow L, Kleinert M, Betik AC, Shaw CS, Kiens B, Wojtaszewski JF, Rattigan S, Richter EA, McConell GK. exercise increases human skeletal muscle insulin sensitivity via coordinated increases in microvascular perfusion and molecular signaling. Diabetes 66: 1501–1510, 2017. doi: 10.2337/db16-1327. [DOI] [PubMed] [Google Scholar]
- 55.Sjøberg KA, Rattigan S, Hiscock N, Richter EA, Kiens B. A new method to study changes in microvascular blood volume in muscle and adipose tissue: real-time imaging in humans and rat. Am J Physiol Heart Circ Physiol 301: H450–H458, 2011. doi: 10.1152/ajpheart.01174.2010. [DOI] [PubMed] [Google Scholar]
- 56.Somogyi M. Determination of blood sugar. J Biol Chem 160: 69–73, 1945. [Google Scholar]
- 57.Turaihi AH, van Poelgeest EM, van Hinsbergh VW, Serné EH, Smulders YM, Eringa EC. Combined intravital microscopy and contrast-enhanced ultrasonography of the mouse hindlimb to study insulin-induced vasodilation and muscle perfusion. J Vis Exp 121: 54912, 2017. doi: 10.3791/54912. [DOI] [PMC free article] [PubMed] [Google Scholar]
- 58.Vincent MA, Clerk LH, Lindner JR, Klibanov AL, Clark MG, Rattigan S, Barrett EJ. Microvascular recruitment is an early insulin effect that regulates skeletal muscle glucose uptake in vivo. Diabetes 53: 1418–1423, 2004. doi: 10.2337/diabetes.53.6.1418. [DOI] [PubMed] [Google Scholar]
- 59.Vollus GC, Bradley EA, Roberts MK, Newman JM, Richards SM, Rattigan S, Barrett EJ, Clark MG. Graded occlusion of perfused rat muscle vasculature decreases insulin action. Clin Sci (Lond) 112: 457–466, 2007. doi: 10.1042/CS20060311. [DOI] [PubMed] [Google Scholar]
- 60.Wasserman DH. Four grams of glucose. Am J Physiol Endocrinol Metab 296: E11–E21, 2009. doi: 10.1152/ajpendo.90563.2008. [DOI] [PMC free article] [PubMed] [Google Scholar]
- 61.Wasserman DH, Kang L, Ayala JE, Fueger PT, Lee-Young RS. The physiological regulation of glucose flux into muscle in vivo. J Exp Biol 214: 254–262, 2011. doi: 10.1242/jeb.048041. [DOI] [PMC free article] [PubMed] [Google Scholar]
- 62.Wei K, Jayaweera AR, Firoozan S, Linka A, Skyba DM, Kaul S. Quantification of myocardial blood flow with ultrasound-induced destruction of microbubbles administered as a constant venous infusion. Circulation 97: 473–483, 1998. doi: 10.1161/01.CIR.97.5.473. [DOI] [PubMed] [Google Scholar]
- 63.Williams IM, McClatchey PM, Bracy DP, Valenzuela FA, Wasserman DH. Acute nitric oxide synthase inhibition accelerates transendothelial insulin efflux in vivo. Diabetes 67: 1962–1975, 2018. doi: 10.2337/db18-0288. [DOI] [PMC free article] [PubMed] [Google Scholar]
- 64.Williams IM, Valenzuela FA, Kahl SD, Ramkrishna D, Mezo AR, Young JD, Wells KS, Wasserman DH. Insulin exits skeletal muscle capillaries by fluid-phase transport. J Clin Invest 128: 699–714, 2018. doi: 10.1172/JCI94053. [DOI] [PMC free article] [PubMed] [Google Scholar]
- 65.Womack L, Peters D, Barrett EJ, Kaul S, Price W, Lindner JR. Abnormal skeletal muscle capillary recruitment during exercise in patients with type 2 diabetes mellitus and microvascular complications. J Am Coll Cardiol 53: 2175–2183, 2009. doi: 10.1016/j.jacc.2009.02.042. [DOI] [PMC free article] [PubMed] [Google Scholar]
- 66.Yasukawa T, Tokunaga E, Ota H, Sugita H, Martyn JA, Kaneki M. S-nitrosylation-dependent inactivation of Akt/protein kinase B in insulin resistance. J Biol Chem 280: 7511–7518, 2005. doi: 10.1074/jbc.M411871200. [DOI] [PubMed] [Google Scholar]
- 67.Zamani P, Rawat D, Shiva-Kumar P, Geraci S, Bhuva R, Konda P, Doulias PT, Ischiropoulos H, Townsend RR, Margulies KB, Cappola TP, Poole DC, Chirinos JA. Effect of inorganic nitrate on exercise capacity in heart failure with preserved ejection fraction. Circulation 131: 371–380, 2015. doi: 10.1161/CIRCULATIONAHA.114.012957. [DOI] [PMC free article] [PubMed] [Google Scholar]
- 68.Zheng J, Hasting MK, Zhang X, Coggan A, An H, Snozek D, Curci J, Mueller MJ. A pilot study of regional perfusion and oxygenation in calf muscles of individuals with diabetes with a noninvasive measure. J Vasc Surg 59: 419–426, 2014. doi: 10.1016/j.jvs.2013.07.115. [DOI] [PMC free article] [PubMed] [Google Scholar]
- 69.Zou C, Wang Y, Shen Z. 2-NBDG as a fluorescent indicator for direct glucose uptake measurement. J Biochem Biophys Methods 64: 207–215, 2005. doi: 10.1016/j.jbbm.2005.08.001. [DOI] [PubMed] [Google Scholar]


