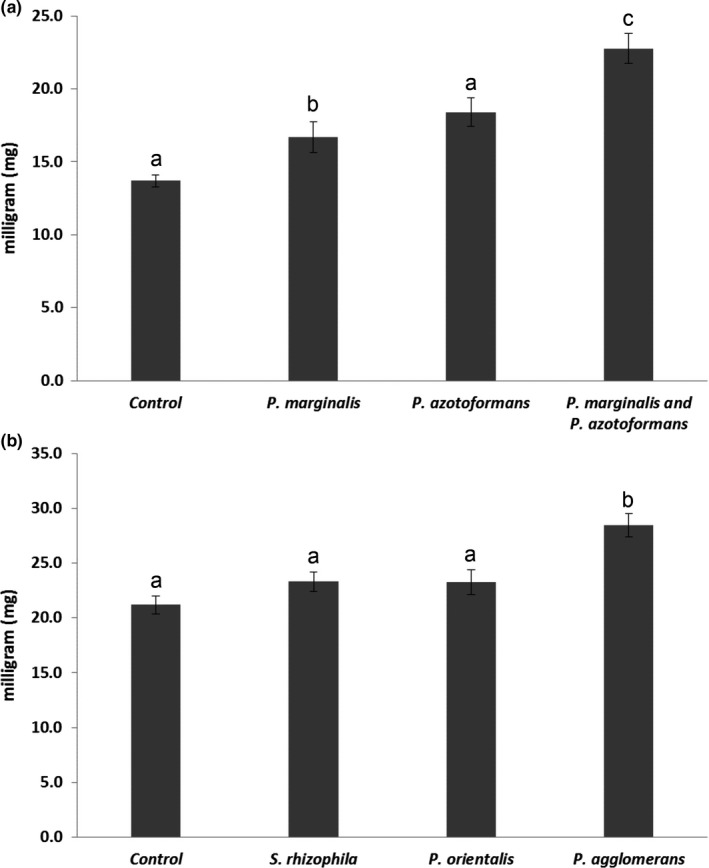
Figure A3.

Mean (±SE) seedling fresh biomass (mg) of wild cabbage plants (B. oleracea) of all wild cabbage population when exposed to bacterial volatiles emitted for seven days. (a) P. marginalis, P. azotoformans and the combination of both compared to the control (B. oleracea without exposure to bacterial volatiles); (b) when exposed to bacterial volatiles emitted by monocultures of S. rhizophila, P. orientalis and by different letters above bars based on Tukey HSD multiple comparison tests in General Linear Model (n = 15), (p < .05) [Correction added on 4 December 2019 after first online publication: Figure A3 has been moved from Supporting Information to the Appendix section]
