Figure 3.

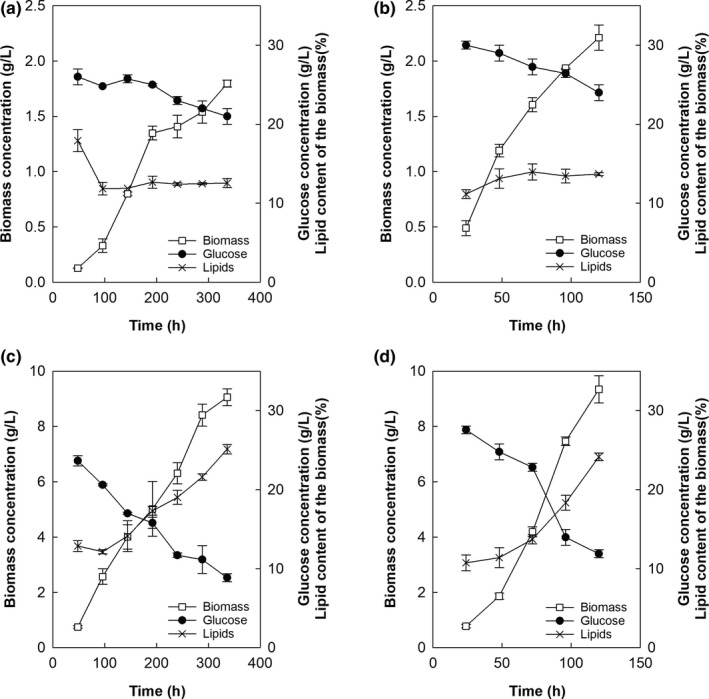
Growth curve (□) of the Antarctic thraustochytrids RT2316‐7 (a and b) and RT2316‐13 (c and d) cultured at 5°C (a and c) and 15°C (b and d). Concentration of glucose (•) and the total lipid content of the biomass (×) are also shown

Growth curve (□) of the Antarctic thraustochytrids RT2316‐7 (a and b) and RT2316‐13 (c and d) cultured at 5°C (a and c) and 15°C (b and d). Concentration of glucose (•) and the total lipid content of the biomass (×) are also shown