

Abstract
The spiny mouse, Acomys cahirinus displays a unique wound healing ability with regeneration of all skin components in a scar-free manner. To identify orchestrators of this regenerative response we have performed proteomic analyses of skin from Acomys and Mus musculus before and after wounding. Of the ~2000 proteins identified many are expressed at similar levels in Acomys and Mus, but there are significant differences. Following wounding in Mus the complement and coagulation cascades, PPAR signaling pathway and ECM-receptor interactions predominate. In Acomys, other pathways predominate including the Wnt, MAPK, the ribosome, proteasome, endocytosis and tight junction pathways. Notable among Acomys specific proteins are several ubiquitin-associated enzymes and kinases, whereas in Mus immuno-modulation proteins characteristic of inflammatory response are unique or more prominent. ECM proteins such as collagens are more highly expressed in Mus, but likely more important is the higher expression of matrix remodeling proteases in Acomys. Another distinctive difference between Acomys and Mus lies in the macrophage-produced arginase 1 is found in Mus whereas arginase 2 is found in Acomys. Thus, we have identified several avenues for experimental approaches whose aim is to reduce the fibrotic response that the typical mammal displays in response to wounding.
Subject terms: Protein-protein interaction networks, Non-model organisms
Introduction
The cellular and molecular events of full thickness wound repair in mammalian skin occur in three overlapping phases namely inflammation, tissue formation and tissue remodeling, the typical outcome of which is scar tissue composed of non-physiologic dermal tissue masked by smooth, hairless epidermis1. However, there are several examples where wound repair involves complete regeneration rather than scarring, including adult fish2, Urodele skin3,4 and fetal mammalian skin up to the end of the second trimester5–7. Comparisons between fetal and adult mammalian wounds5–7 have led to the identification of distinct differences in fetal skin wounding including less robust immune responses, lower levels of inflammatory cytokines and growth factors such as Pdgfa and Tgfβ18,9 and differences in matrix composition which may also be relevant to the successful outcomes of fish and Urodele skin regeneration.
Surprisingly, there are some adult mammals in which the skin can regenerate after injury such as punches through the ears of rabbits10, spiny mice, Acomys11, small ear wounds in MRL mice12 and large skin wound in young C57B/L mice13, suggesting that this may not be a property solely of lower vertebrates and fetuses. Several species of Acomys can not only regenerate all the components of the ear viz. cartilage, adipose tissue and hair in a scar-free manner11,14,15 but also all the components of skin after full thickness wounding or burn injury11,16. Comparisons between skin regeneration in Acomys and skin scarring after the same injury in Mus has revealed striking similarities between Acomys and fetal wound healing including absent or low levels of pro-inflammatory cytokines in Acomys, reduced levels of F4/80 macrophages and very different ECM components especially, excessive collagens in Mus but not in Acomys17,18. The intervention of macrophages is, however, necessary for regeneration even though they may not be present at the wound site19 and an acute inflammatory response with strong myeloperoxidase activity was exhibited in both Acomys and Mus, but with stronger ROS production in Acomys.
At present much of the information about differences between Acomys and Mus is derived from cellular and genetic analyses11,14–19 and the involvement of proteins is more by implication than by direct observation, so a more comprehensive proteomic study would be desirable. In the study presented here, we have qualitatively and quantitatively compared the proteomic profiles of untreated and wounded skin of Mus and Acomys to identify proteins that potentially favor scar-free healing. Among the ca. 2000 proteins we identified the majority were expressed at similar levels by Acomys and Mus. However distinct differences were found in the levels of ubiquitin-related enzymes, phosphorylation-associated proteins, proteases, immunomodulators and macrophage markers. We find that the enhanced degradation and synthesis of proteins is a major mechanism in Acomys, especially ubiquitination and phosphorylation which may play a critical role in regulating the signaling pathways employed in tissue repair. In addition, the disparate response in terms of macrophage profiles may generate different ECM microenvironments which are critical to the outcome of injury, namely fibrosis in Mus vs a regenerative response in Acomys.
Results
Comprehensive global proteome profiling of Acomys and Mus skin
To gain insight into the potential underlying molecular mechanisms, we performed shotgun proteomics by 1D gel separation / nano-LC-MS/MS on protein extracts from Acomys and Mus skin at days 0 (unwounded), 3, 5, 7 and 14 post-wounding. To acquire comprehensive proteomic profiles of the skin, a workflow was developed and the general scheme for sample preparation and analysis is given in Supplementary Fig. S1.
Protein identification was carried out by searching against the mouse database (UniprotKBMusmusculus) since our previous data showed that several protein sequences in Acomys were 96% homologous to those of Mus18 and an alignment of several proteins used for identification of macrophage subsets between Acomys and Mus revealed 80% to 100% nucleotide identity19. Here we have also compared the known Acomys cahirinus protein sequences with proteins from Mus musculus and shown they all have 85% +/− 2% sequence homology (Supplementary Table S1). Our recent comparative transcriptomic analysis of skin wound healing has demonstrated that the identification of 21663 orthologs between two species, confirming the close similarity of transcript levels20. As a result, we identified totals of 1647, 1706, 1780, 1790 and 1817 non-redundant proteins in Acomys at days 0, 3, 5, 7, 14, respectively. The corresponding numbers of proteins identified in Mus were 2097, 2083, 2051, 2008 and 2088. The total numbers of unique and common proteins at the different time points from both species is shown in Fig. 1. On average over the sample times the number of proteins identified that were unique to Mus was 26.1 ± 2.6%, unique to Acomys 12.7 ± 1.4% and common to both 61.2 ± 1.3%. Over all time points, 494 and 473 proteins were differentially present in Acomys or in Mus, respectively.
Figure 1.

Venn diagrams of common and unique proteins identified between Acomys and Mus at day 0 (A), 3 (B), 5 (C), 7 (D) and 14 (E).
Proteomic analysis of normal Acomys and Mus skin
To elucidate whether or not the protein profiles would reveal intrinsic biological differences between Acomys and Mus before wounding we performed Gene ontology (GO) enrichment analyses with total proteins detected from both species, according to their location in the cell components (Fig. 2A) and related biological functions (Fig. 2B) at day 0. The cellular locations of the identified proteins were highest for the cytoskeleton and mitochondrion but showed a similar distribution between the two species. Likewise, the biological functions of the identified proteins were highest for protein localization, protein transport and oxidation reduction, but showed a similar distribution between species.
Figure 2.
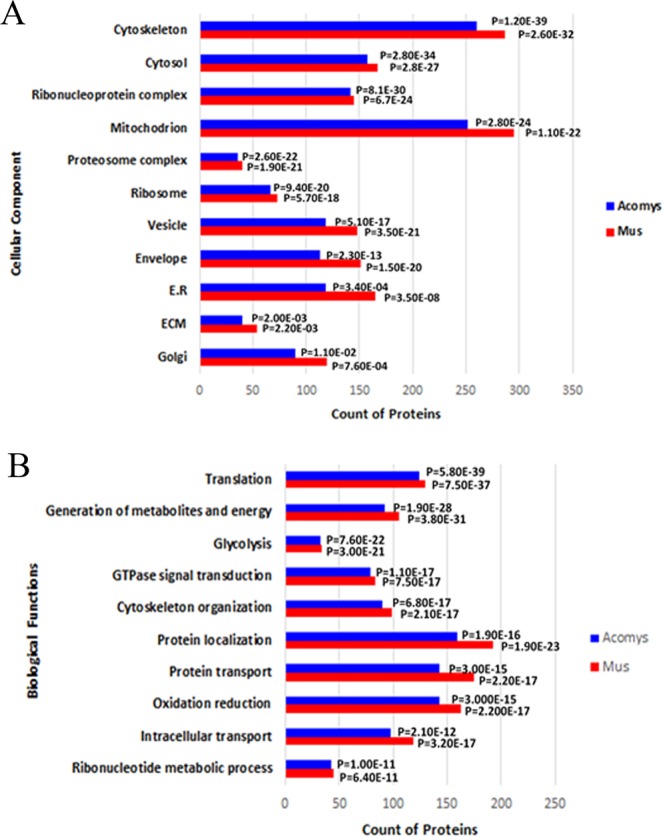
Gene ontology analyses of protein counts versus (A) cellular components (B) biological functions of identified proteins in Acomys and Mus at day 0.
A list of common and unique proteins is shown in Table S2 revealing that there were very similar protein profiles in Acomys and Mus with regard to the presence of the most abundantly reported mouse skin proteins such as keratins (see also Table 1 and Table S4), myosins, actins and heat-shock proteins. The collagens were generally present at higher levels in Mus skin (see also Table 1) as well as tenascin. However, the unique proteins identified in skin samples from each species at day 0 (see Table 1) showed distinct biological characteristics. Acomys specific proteins were involved in protein amino acid phosphorylation such as tyrosine protein kinases (BLK, CSK, FGR, FGFR1, FRK, MAP2K1) and serine/threonine protein kinases (CDKs, STK10, RPS6KA1) and cell division, whereas Mus specific proteins belong to immune defense and wound response processes including several complement components, proteases (kallikreins B, cathepsin H and L1) and protease inhibitors (Serpina1 and Serpina3 isomers, (see also Table S5). These unique proteins in each species might allow dramatically different functions that result in intrinsic biological differences after wounding.
Table 1.
Proteins identified from Acomys and Mus associated with wound healing over 14 days.
| Accession | Protein Description | Gene | Acomys | Mus | ||||||||
|---|---|---|---|---|---|---|---|---|---|---|---|---|
| 0 day | 3 days | 5 days | 7 days | 14days | 0 day | 3 days | 5 days | 7 days | 14 days | |||
| Quantitative Value (CV) | ||||||||||||
| Ubiquitin/Proteasome | ||||||||||||
| O88685 | 26S protease regulatory subunit 6A | Psmc3 | 1.55(20.4) | 4.43(9.6) | 4.19(5.9) | 3.39(1.3) | 4.32(6.1) | 3.35(15.7) | 3.04(4.2) | 3.62(6.8) | 3.05(5.5) | 2.73(15.9) |
| Q6ZPJ3 | E2/E3 hybrid ubiquitin-protein ligase UBE2O | Ube2o | 1.04(19.2) | 4.45(5.5) | 4.02(7.8) | 4.00(10.3) | 3.14(13.6) | 3.32(15.9) | 2.04(8.9) | 1.61(18.6) | 1.35(14.8) | 1.73(13.5) |
| Q3U319 | E3 ubiquitin-protein ligase BRE1B | Rnf40 | 1.55(17.9) | 2.23(22.4) | 2.04(19.6) | 3.02(13.9) | 2.51(19.6) | 3.77(18.8) | 2.63(4.9) | 3.13(9.1) | 2.76(8.9) | 3.17(13.1) |
| P46935 | E3 ubiquitin-protein ligase NEDD4 | Nedd4 | 3.34(21.8) | 2.84(21.3) | 4.82(97.8) | 6.05(11.1) | 6.51(14.5) | 3.23(13.3) | 3.08(4.2) | 2.59(4.5) | 2.93(17.1) | 3.86(11.0) |
| P0CG49 | Polyubiquitin-B | Ubb | 3.16(5.1) | 4.66(17.7) | 5.28(5.0) | 5.92(1.6) | 5.14(19.4) | 4.07(21.1) | 3.61(4.5) | 3.30(7.5) | 2.33(13.5) | 5.50(19.2) |
| P0CG50 | Polyubiquitin-C | Ubc | 5.26(3.7) | 5.32(8.2) | 5.93(1.7) | 4.95(21.3) | 5.47(21.3) | 4.89(12.2) | 4.67(6.7) | 4.53(19.5) | 6.66(9.5) | |
| Q9Z2U1 | Proteasome subunit alpha type-5 | Psma5 | 2.05(19.1) | 3.93(16.3) | 4.47(3.4) | 3.75(10.7) | 4.10(19.0) | 4.70(12.8) | 5.42(7.3) | 4.97(14.3) | 4.98(5.0) | 5.58(6.3) |
| Q6ZQ93 | Ubiquitin carboxyl-terminal hydrolase 34 | Usp34 | 0.94(16.4) | 1.86(16.1) | 1.69(17.7) | 1.64(18.3) | 1.62(12.3) | |||||
| Q6A4J8 | Ubiquitin carboxyl-terminal hydrolase 7 | Usp7 | 1.04(19.2) | 1.42(21.1) | 1.74(17.3) | 1.83(16.4) | 2.00(16.1) | |||||
| P62984 | Ubiquitin-60S ribosomal protein L40 | Uba52 | 2.23(8.3) | 5.26(3.7) | 5.32(5.8) | 5.93(1.7) | 5.28(18.9) | 5.02(2.4) | 5.38(10.3) | 5.34(2.5) | 4.84(1.9) | 5.42(5.5) |
| P52482 | Ubiquitin-conjugating enzyme E2 E1 | Ube2e1 | 1.84(14.6) | 3.34(15.6) | 1.87(13.3) | 1.79(2.5) | 3.82(13.1) | |||||
| Q8K2Z8 | Ubiquitin-conjugating enzyme E2 Q2 | Ube2q2 | 2.45(19.5) | 2.50(16.0) | 2.51(17.7) | 1.44(14.5) | 3.51(4.3) | |||||
| Q02053 | Ubiquitin-like modifier-activating enzyme 1 | Uba1 | 4.53(14.8) | 4.99(21.4) | 5.41(2.4) | 5.45(7.2) | 5.34(18.0) | 5.93(6.4) | 5.56(13.1) | 5.37(19.6) | 5.57(15.4) | 7.28(2.3) |
| Ribosome | ||||||||||||
| P62301 | 40S ribosomal protein S13 | Rps13 | 1.55(17.9) | 3.05(6.1) | 4.13(13.6) | 4.49(8.0) | 3.92(8.0) | 3.35(15.7) | 3.04(4.2) | 3.62(6.8) | 3.05(5.5) | 2.73(15.9) |
| P63276 | 40S ribosomal protein S17 | Rps17 | 1.55(17.9) | 1.86(16.1) | 3.01(10.5) | 4.20(10.4) | 2.89(3.4) | 3.32(15.9) | 2.04(8.9) | 1.61(18.6) | 1.35(14.8) | 1.73(13.5) |
| P62855 | 40S ribosomal protein S26 | Rps26 | 0.94(16.4) | 2.05(9.1) | 3.82(20.1) | 3.47(20.6) | 3.89(2.6) | 3.77(18.8) | 2.63(4.9) | 3.13(9.1) | 2.76(8.9) | 3.17(13.1) |
| P19253 | 60S ribosomal protein L13a | Rpl13a | 1.05(21.3) | 2.37(16.5) | 4.90(17.2) | 3.94(15.0) | 3.47(13.0) | 3.23(13.3) | 3.08(4.2) | 2.59(4.5) | 2.93(17.1) | 3.86(11.0) |
| P14115 | 60S ribosomal protein L27a | Rpl27a | 1.55(17.9) | 4.58(9.0) | 4.65(18.4) | 3.81(13.1) | 4.21(13.0) | 4.07(21.1) | 3.61(4.5) | 3.30(7.5) | 2.33(13.5) | 5.50(19.2) |
| Q9D8E6 | 60S ribosomal protein L4 | Rpl4 | 3.00(19.7) | 5.12(5.9) | 5.01(19.6) | 5.48(5.7) | 7.04(1.1) | 5.47(21.3) | 4.89(12.2) | 4.67(6.7) | 4.53(19.5) | 6.66(9.5) |
| P62983 | Ubiquitin-40S ribosomal protein S27a | Rps27a | 2.23(11.7) | 4.66(17.7) | 5.39(6.2) | 5.93(1.7) | 5.02(15.0) | 4.70(12.8) | 5.42(7.3) | 4.97(14.3) | 4.98(5.0) | 5.58(6.3) |
| Spliceosome | ||||||||||||
| O08810 | 116 kDa U5 small nuclear ribonucleoprotein component | Eftud2 | 1.73(17.4) | 2.05(9.1) | 4.39(7.9) | 4.36(12.3) | 5.21(17.9) | 3.78(13.0) | 4.17(17.7) | 3.80(2.4) | 3.79(16.2) | 5.66(8.6) |
| P17879 | Heat shock 70 kDa protein 1B | Hspa1b | 5.50(3.5) | 4.83(20.6) | 5.74(8.7) | 5.88(2.0) | 2.10(13.2) | 4.77(16.5) | 5.78(3.3) | 5.40(3.1) | 5.82(5.2) | 7.16(0.2) |
| P49312 | Heterogeneous nuclear ribonucleoprotein A1 | Hnrnpa1 | 0.94(16.4) | 2.43(15.4) | 4.53(3.6) | 5.03(11.9) | 5.44(8.4) | 4.22(13.9) | 3.69(16.9) | 3.22(15.5) | 2.74(8.2) | 5.24(17.2) |
| Q62093 | Serine/arginine-rich splicing factor 2 | Srsf2 | 1.66(17.2) | 1.64(13.4) | 2.82(6.8) | 3.39(1.3) | 4.00(9.5) | 2.41(17.9) | 1.79(21.5) | 2.59(6.4) | 2.87(14.1) | 3.32(13.1) |
| P62317 | Small nuclear ribonucleoprotein Sm D2 | Snrpd2 | 1.27(15.7) | 1.86(16.1) | 3.66(14.8) | 4.42(12.9) | 2.89(3.4) | 2.30(14.1) | 2.54(20.6) | 1.12(17.8) | 1.62(18.5) | 2.23(4.2) |
| Q9Z1N5 | Spliceosome RNA helicase Ddx39b | Ddx39b | 2.55(20.5) | 4.36(16.9) | 5.23(11.8) | 5.54(6.6) | 5.58(10.9) | 4.40(5.0) | 4.48(2.2) | 4.36(7.6) | 4.11(19.9) | 5.67(1.8) |
| Q921M3 | Splicing factor 3B subunit 3 | Sf3b3 | 1.94(7.9) | 2.05(9.1) | 5.43(9.6) | 5.39(2.8) | 5.33(16.6) | 4.01(19.9) | 4.42(11.3) | 4.03(15.4) | 3.86(18.5) | 5.33(3.7) |
| Protein Processing in Endoplasmic Reticulum | ||||||||||||
| P14211 | Calreticulin | Calr | 3.56(11.5) | 2.55(15.2) | 4.99(12.2) | 5.29(18.8) | 5.48(10.5) | 4.57(11.8) | 4.83(3.1) | 5.21(12.4) | 5.34(12.3) | 5.81(9.7) |
| P35564 | Calnexin | Canx | 3.13(13.5) | 4.73(18.0) | 4.39(21.0) | 4.79(11.6) | 5.54(1.4) | 5.16(8.8) | 5.14(17.9) | 5.14(6.2) | 4.77(12.1) | 6.06(9.0) |
| O54734 | Dolichyl-diphosphooligosaccharide–protein glycosyltransferase 48 kDa subunit | Ddost | 1.05(11.7) | 2.05(12.9) | 4.32(1.0) | 3.84(14.5) | 4.63(11.6) | 3.95(12.4) | 3.92(14.6) | 4.08(13.1) | 3.21(12.2) | 5.27(4.7) |
| Q922R8 | Protein disulfide-isomerase A6 | Pdia6 | 2.55(15.4) | 4.72(14.3) | 5.36(6.5) | 5.89(2.0) | 5.85(3.4) | 5.05(8.5) | 5.29(9.3) | 5.45(1.4) | 4.96(15.4) | 6.32(9.9) |
| Q91W90 | Thioredoxin domain-containing protein 5 | Txndc5 | 1.94(7.9) | 3.74(13.4) | 3.18(14.0) | 3.10(10.9) | 4.14(10.3) | 2.76(21.7) | 1.04(17.5) | 3.41(15.3) | 3.12(16.2) | 5.45(4.1) |
| Keratin | ||||||||||||
| Q61765 | Keratin, type I cuticular Ha1 | Krt31 | 8.16(14.5) | 7.11(15.9) | 6.55(15.6) | 7.48(14.4) | 7.74(11.6) | 6.16(12.8) | 6.48(17.0) | 6.23(9.5) | 6.32(3.0) | 7.77(8.5) |
| Q62168 | Keratin, type I cuticular Ha2 | Krt32 | 7.74(19.6) | 7.04(16.0) | 6.09(21.1) | 7.13(9.1) | 7.75(11.8) | 5.84(12.2) | 5.96(10.6) | 6.08(6.3) | 5.99(11.2) | 6.57(2.0) |
| Q61897 | Keratin, type I cuticular Ha3-II | Krt33b | 7.93(13.7) | 7.01(14.5) | 6.55(15.6) | 7.41(14.7) | 7.73(11.5) | 6.12(12.3) | 6.46(16.4) | 6.25(9.9) | 6.30(4.9) | 7.68(7.3) |
| Q497I4 | Keratin, type I cuticular Ha5 | Krt35 | 7.89(15.4) | 7.00(14.2) | 6.17(18.5) | 7.31(12.2) | 7.76(11.8) | 6.00(11.0) | 6.28(13.0) | 6.25(8.0) | 6.26(6.3) | 7.15(4.8) |
| B1AQ75 | Keratin, type I cuticular Ha6 | Krt36 | 7.78(17.6) | 6.86(14.4) | 5.84(21.9) | 7.13(9.6) | 7.61(10.5) | 5.80(12.9) | 5.96(10.6) | 6.07(6.1) | 5.99(11.2) | 6.64(1.3) |
| Q9QWL7 | Keratin, type I cytoskeletal 17 | Krt17 | 9.12(5.0) | 9.20(12.2) | 8.78(7.5) | 9.50(1.9) | 9.36(4.7) | 8.93(3.7) | 8.16(6.1) | 8.57(1.8) | 8.46(2.8) | 9.04(1.4) |
| Protein Phosphorylation | ||||||||||||
| P11440 | Cyclin-dependent kinase 1 | Cdk1 | 1.27(15.7) | 1.42(14.1) | 2.37(11.6) | 3.42(0.5) | 1.94(20.2) | |||||
| P31938 | Dual specificity mitogen-activated protein kinase kinase 1 | Map2k1 | 1.95(14.2) | 3.74(13.4) | 4.23(4.5) | 3.34(16.1) | 3.26(19.0) | |||||
| Q01279 | Epidermal growth factor receptor | Egfr | 1.42(14.1) | 1.89(11.5) | 2.44(12.3) | 1.60(19.6) | 3.10(10.1) | 5.82(4.3) | 4.11(22.0) | 4.57(19.5) | 4.67(5.4) | |
| P42567 | Epidermal growth factor receptor substrate 15 | Eps15 | 1.86(16.1) | 1.74(11.5) | 2.44(12.3) | 1.50(11.5) | 2.07(18.7) | 1.40(14.3) | 2.79(10.3) | |||
| P16092 | Fibroblast growth factor receptor 1 | Fgfr1 | 1.27(15.7) | 1.42(14.1) | 1.87(13.3) | 2.92(4.7) | 1.72(8.2) | |||||
| P18653 | Ribosomal protein S6 kinase alpha-1 | Rps6ka1 | 1.05(21.3) | 1.42(14.1) | 1.74(11.5) | 1.83(10.9) | 1.38(14.5) | |||||
| O55098 | Serine/threonine-protein kinase 10 | Stk10 | 1.16(14.0) | 3.01(16.6) | 1.74(11.5) | 1.76(11.4) | 1.62(12.3) | |||||
| P83741 | Serine/threonine-protein kinase WNK1 | Wnk1 | 1.04(9.6) | 1.42(14.1) | 1.89(11.5) | 1.44(13.9) | 1.60(19.6) | 1.17(8.5) | 2.35(12.8) | 3.60(5.2) | ||
| P16277 | Tyrosine-protein kinase Blk | Blk | 1.27(15.7) | 1.42(14.1) | 1.87(13.3) | 2.63(10.5) | 1.72(8.2) | |||||
| P41241 | Tyrosine-protein kinase CSK | Csk | 2.63(15.2) | 3.70(12.5) | 3.02(17.5) | 3.10(15.4) | 3.14(13.6) | |||||
| P14234 | Tyrosine-protein kinase Fgr | Fgr | 1.27(15.7) | 2.42(16.5) | 1.87(13.3) | 2.63(10.5) | 1.72(8.2) | |||||
| Q922K9 | Tyrosine-protein kinase FRK | Frk | 2.63(15.2) | 3.63(7.3) | 3.18(19.8) | 3.10(15.4) | 2.80(14.8) | |||||
| Protease | ||||||||||||
| P10605 | Cathepsin B | Ctsb | 1.05(21.3) | 2.83(21.0) | 3.60(22.8) | 2.79(12.7) | 3.00(20.7) | 5.16(16.1) | 4.24(17.5) | 5.24(14.7) | 4.86(2.9) | 5.15(15.0) |
| P18242 | Cathepsin D | Ctsd | 1.05(21.3) | 2.14(13.1) | 2.37(19.4) | 3.59(4.8) | 2.94(21.4) | 4.01(17.3) | 4.24(16.3) | 3.63(18.1) | 4.62(8.7) | 4.79(1.1) |
| P28293 | Cathepsin G | Ctsg | 4.44(15.9) | 3.02(17.5) | 1.60(14.4) | 2.10(18.7) | ||||||
| P49935 | Pro-cathepsin H | Ctsh | 2.90(22.1) | 2.04(8.9) | 1.68(17.7) | 1.35(14.8) | 2.78(21.9) | |||||
| P06797 | Cathepsin L1 | Ctsl | 1.53(16.7) | 1.17(8.5) | 1.18(10.8) | 1.46(11.4) | 1.17(8.5) | |||||
| Q9WUU7 | Cathepsin Z | Ctsz | 1.04(19.2) | 2.37(16.5) | 3.55(6.8) | 3.64(5.5) | 3.45(10.1) | 3.15(12.1) | 3.20(1.4) | 3.80(12.1) | 3.79(8.3) | 3.15(12.3) |
| P26262 | Plasma kallikrein | Klkb1 | 2.56(16.3) | 6.19(3.3) | 6.10(1.6) | 6.96(2.4) | 3.86(17.4) | |||||
| P21812 | Mast cell protease 4 | Mcpt4 | 3.04(16.4) | 2.42(12.4) | 3.32(15.1) | 3.34(15.0) | 4.43(11.3) | |||||
| P41245 | Matrix metalloproteinase-9 | Mmp9 | 6.81(5.2) | 6.26(12.2) | 5.96(12.8) | 2.97(16.8) | ||||||
| P21845 | Tryptase beta-2 | Tpsb2 | 1.04(9.6) | 1.42(14.1) | 1.42(14.1) | 1.74(17.3) | 1.62(18.5) | |||||
| Protease Inhibitors | ||||||||||||
| Q61247 | Alpha-2-antiplasmin | Serpinf2 | 3.70(21.3) | 3.66(1.2) | 4.17(18.8) | 2.27(9.7) | 2.17(13.8) | 6.12(1.4) | 5.58(11.6) | 6.70(2.5) | 1.78(22.0) | |
| Q61838 | Alpha-2-macroglobulin | Pzp | 2.63(19.0) | 7.36(9.8) | 6.91(3.3) | 7.59(9.7) | 6.27(8.2) | 6.93(3.8) | 10.39(3.6) | 10.41(0.5) | 10.75(2.5) | 7.81(2.9) |
| Q6GQT1 | Alpha-2-macroglobulin-P | A2mp | 1.04(19.2) | 7.32(12.8) | 6.50(2.7) | 7.79(12.6) | 5.95(8.5) | 2.71(12.4) | 5.87(6.6) | 5.99(1.6) | 6.32(2.9) | 3.83(15.3) |
| P32261 | Antithrombin-III | Serpinc1 | 1.04(19.2) | 6.00(12.1) | 5.18(15.9) | 5.69(14.1) | 3.91(13.2) | 2.38(19.6) | 7.03(4.6) | 6.21(6.2) | 7.35(3.6) | 4.17(16.3) |
| Q62426 | Cystatin-B | Cstb | 1.10(19.9) | 0.91(10.9) | 1.47(13.6) | 1.58(12.7) | 1.73(19.3) | |||||
| P49182 | Heparin cofactor 2 | Serpind1 | 1.04(19.2) | 2.05(12.9) | 3.05(14.6) | 3.29(22.8) | 2.96(16.9) | 2.27(13.1) | 5.83(8.0) | 5.42(8.2) | 6.15(4.1) | 3.44(2.1) |
| O08677 | Kininogen-1 | Kng1 | 2.65(18.7) | 7.63(0.6) | 6.83(6.3) | 7.90(6.2) | 3.70(14.3) | |||||
| P12032 | Metalloproteinase inhibitor 1 | Timp1 | 0.58(8.6) | 1.17(17.1) | 2.71(14.8) | 2.12(19.2) | ||||||
| P97290 | Plasma protease C1 inhibitor | Serping1 | 1.66(9.8) | 6.04(9.8) | 4.79(7.4) | 5.51(4.7) | 5.56(10.3) | 3.27(20.7) | 6.95(4.7) | 5.96(5.6) | 6.89(4.2) | 4.34(20.7) |
| ECM(Extra Cellular Matrix) | ||||||||||||
| P11087 | Collagen alpha-1(I) chain | Col1a1 | 2.71(22.8) | 2.05(12.9) | 5.08(20.0) | 4.40(13.6) | 5.02(17.5) | 3.56(15.6) | 4.11(11.1) | 3.86(3.8) | 3.90(6.6) | 7.05(4.9) |
| P08121 | Collagen alpha-1(III) chain | Col3a1 | 1.16(9.9) | 1.42(14.1) | 3.18(14.0) | 4.63(5.9) | 4.64(20.9) | 2.65(18.4) | 2.50(13.6) | 2.80(3.2) | 4.45(10.8) | 5.63(13.8) |
| Q04857 | Collagen alpha-1(VI) chain | Col6a1 | 2.34(31.1) | 4.74(21.1) | 6.26(12.8) | 4.46(14.2) | 4.68(8.4) | 4.03(21.8) | 2.82(20.9) | 3.51(18.9) | 3.14(6.2) | 7.32(17.7) |
| Q60847 | Collagen alpha-1(XII) chain | Col12a1 | 3.00(4.8) | 2.33(4.0) | 5.70(17.6) | 5.41(0.0) | 7.41(0.1) | 2.54(20.4) | 4.15(10.3) | 7.13(20.8) | 5.98(10.1) | 9.29(10.2) |
| Q80X19 | Collagen alpha-1(XIV) chain | Col14a1 | 4.04(10.0) | 5.32(16.3) | 7.21(11.4) | 7.68(2.9) | 8.23(9.5) | 6.63(19.4) | 6.94(19.1) | 5.43(11.7) | 7.01(2.8) | 9.08(6.5) |
| O35206 | Collagen alpha-1(XV) chain | Col15a1 | 1.55(20.4) | 1.42(14.1) | 2.68(16.4) | 1.60(10.2) | 1.72(5.8) | 3.63(11.1) | 1.04(17.5) | 3.51(10.9) | 2.49(7.0) | 4.06(19.7) |
| Q07563 | Collagen alpha-1(XVII) chain | Col17a1 | 0.17(17.6) | 1.16(21.1) | 0.89(11.2) | 1.32(15.2) | 1.39(14.4) | |||||
| P39061 | Collagen alpha-1(XVIII) chain | Col18a1 | 3.04(19.7) | (0.0) | 2.74(18.3) | 1.60(10.2) | 2.62(19.1) | 3.92(12.2) | 1.40(14.3) | 4.00(2.3) | 2.33(22.1) | 3.87(15.7) |
| Q01149 | Collagen alpha-2(I) chain | Col1a2 | 4.29(8.0) | 2.62(14.8) | 4.04(0.5) | 5.07(14.9) | 6.36(8.8) | 4.07(16.5) | 4.70(4.5) | 2.96(16.5) | 4.14(16.5) | 7.71(8.0) |
| Q02788 | Collagen alpha-2(VI) chain | Col6a2 | 4.92(21.5) | 3.74(13.4) | 3.93(17.5) | 4.29(19.3) | 3.76(2.3) | 2.75(20.8) | 1.95(17.8) | 1.01(11.6) | 2.99(22.6) | 6.62(21.0) |
| Q9D1D6 | Collagen triple helix repeat-containing protein 1 | Cthrc1 | 0.83(12.1) | 1.64(18.3) | 2.39(20.5) | 3.09(7.4) | 4.44(12.8) | 2.14(18.7) | 1.16(8.6) | 0.89(16.9) | 1.35(22.2) | 3.47(6.1) |
| Q80YX1 | Tenascin | Tnc | 3.05(13.6) | 6.86(18.4) | 8.73(2.0) | 8.74(4.1) | 2.07(19.9) | 5.80(24.3) | 7.01(21.7) | 7.43(5.4) | 8.25(2.7) | |
| Complement and Coagulation Factors | ||||||||||||
| P08607 | C4b-binding protein | C4bp | 4.63(4.2) | 3.57(5.0) | 4.49(6.3) | 2.39(20.9) | ||||||
| O88947 | Coagulation factor X | F10 | 3.28(13.5) | 3.82(14.2) | 1.60(14.4) | 1.38(21.8) | 1.56(19.2) | 4.81(19.6) | 2.47(19.5) | 4.98(15.5) | 1.23(7.5) | |
| Q80YC5 | Coagulation factor XII | F12 | 3.24(21.0) | 2.30(10.8) | 3.67(16.3) | 1.28(12.1) | ||||||
| Q8CG14 | Complement C1s-A subcomponent | C1s | 3.55(16.7) | 2.30(10.7) | 4.50(11.4) | 2.28(55.3) | ||||||
| P21180 | Complement C2 | C2 | 1.27(15.7) | 2.14(18.6) | 1.87(13.3) | 2.59(17.7) | 1.38(21.8) | 5.10(17.9) | 2.36(8.6) | 4.19(5.9) | 1.28(12.1) | |
| P01027 | Complement C3 | C3 | 3.99(8.5) | 8.52(11.7) | 8.20(4.9) | 8.61(8.1) | 7.36(3.9) | 7.57(2.4) | 11.07(1.9) | 10.64(1.7) | 11.05(2.5) | 8.22(2.2) |
| Q8K182 | Complement component C8 alpha chain | C8a | 6.39(5.5) | 4.02(14.0) | 3.14(6.2) | 3.36(25.6) | ||||||
| Q8VCG4 | Complement component C8 gamma chain | C8g | 0.58(17.2) | 5.10(20.0) | 2.30(17.8) | 4.34(13.4) | 1.39(14.4) | |||||
| P06683 | Complement component C9 | C9 | 0.38(14.8) | 6.04(10.3) | 4.76(5.5) | 4.98(15.8) | 3.78(16.2) | |||||
| P03953 | Complement factor D | Cfd | 0.36(12.1) | 1.69(19.5) | 2.69(10.8) | 2.86(15.5) | 1.29(8.6) | |||||
| Q61129 | Complement factor I | Cfi | 1.05(21.3) | 4.20(16.7) | 2.89(7.5) | 4.12(14.9) | 2.39(19.7) | 0.17(11.8) | 5.18(0.5) | 4.88(10.6) | 5.48(11.0) | 1.28(8.6) |
| E9PV24 | Fibrinogen alpha chain | Fga | 3.05(7.3) | 3.83(15.0) | 4.48(3.4) | 4.58(22.4) | 5.16(12.8) | 5.08(17.0) | 6.54(0.6) | 6.98(2.6) | 7.86(5.8) | 5.93(19.7) |
| Q8K0E8 | Fibrinogen beta chain | Fgb | 3.97(15.9) | 7.28(19.4) | 7.81(4.2) | 8.34(11.7) | 7.79(3.0) | 5.91(16.2) | 7.67(5.9) | 8.12(7.8) | 8.36(4.6) | 6.59(2.5) |
| Q8VCM7 | Fibrinogen gamma chain | Fgg | 5.51(18.1) | 6.21(19.9) | 6.69(5.4) | 7.48(11.6) | 6.48(7.3) | 5.97(17.4) | 7.74(5.3) | 8.04(9.0) | 8.56(4.4) | 6.43(5.3) |
| P20918 | Plasminogen | Plg | 4.40(18.4) | 8.01(5.2) | 7.53(11.6) | 8.46(11.8) | 6.76(15.4) | 4.91(11.7) | 9.34(2.1) | 9.19(1.8) | 9.65(2.0) | 5.69(19.7) |
| P19221 | Prothrombin | F2 | 2.73(20.8) | 6.40(16.6) | 6.08(11.8) | 6.61(17.7) | 5.26(7.3) | 2.81(16.7) | 7.39(8.9) | 7.07(5.4) | 8.15(3.3) | 5.52(0.9) |
| Immunomodulators | ||||||||||||
| P08071 | Lactotransferrin | Ltf | 1.04(19.2) | 7.58(3.5) | 6.91(6.1) | 7.57(9.7) | 6.49(0.4) | 3.39(16.9) | 9.88(6.2) | 9.70(6.4) | 9.63(5.0) | 5.94(21.5) |
| P11247 | Myeloperoxidase | Mpo | 1.04(19.2) | 6.70(15.2) | 6.48(9.4) | 6.42(16.4) | 5.04(9.7) | 3.17(18.9) | 7.62(5.8) | 7.52(6.9) | 7.69(7.2) | 3.13(14.7) |
| P50543 | Protein S100-A11 | S100a11 | 2.33(17.4) | 2.37(11.6) | 3.26(6.4) | 2.82(17.7) | 3.73(18.2) | 4.53(7.0) | 5.78(6.1) | 4.28(13.2) | 4.39(14.5) | |
| P14069 | Protein S100-A6 | S100a6 | 2.10(21.1) | 1.54(17.5) | 2.67(20.4) | 2.87(18.2) | 2.73(15.9) | |||||
| P27005 | Protein S100-A8 | S100a8 | 6.08(13.7) | 8.81(11.9) | 4.57(12.4) | 2.17(9.2) | ||||||
| P31725 | Protein S100-A9 | S100a9 | 7.76(10.2) | 8.15(10.3) | 7.48(13.0) | 2.03(17.7) | ||||||
| Macropage Markers | ||||||||||||
| O08691 | Arginase-2, mitochondrial | Arg2 | 1.83(22.2) | 2.04(14.7) | 2.10(17.3) | 1.61(13.8) | ||||||
| Q61176 | Arginase-1 | Arg1 | 1.38(21.1) | 6.07(11.3) | 5.63(9.2) | 5.95(7.6) | 4.52(16.7) | |||||
| Q61830 | Macrophage mannose receptor 1 | Mrc1 | 1.55(20.4) | 3.30(13.4) | 5.25(7.5) | 4.33(1.9) | 4.38(18.7) | 5.04(15.8) | 5.33(16.9) | 5.43(9.2) | 5.05(17.2) | 6.79(8.8) |
| Q64449 | C-type mannose receptor 2 | Mrc2 | 1.27(15.7) | 1.42(14.1) | 1.89(8.1) | 3.31(15.3) | 4.00(22.0) | 2.00(18.4) | 2.45(2.7) | 3.33(3.5) | 3.94(9.7) | 4.65(16.8) |
| Others | ||||||||||||
| O70456 | 14-3-3 protein sigma | Sfn | 5.69(5.2) | 6.61(8.1) | 7.13(2.9) | 7.19(3.8) | 6.73(4.8) | 6.42(14.9) | 5.09(15.1) | 5.56(4.3) | 6.18(2.0) | 6.30(10.3) |
| P63101 | 14-3-3 protein zeta/delta | Ywhaz | 5.88(5.0) | 6.69(10.8) | 7.29(6.1) | 7.36(2.7) | 6.80(2.8) | 6.81(10.5) | 5.82(18.7) | 6.59(1.1) | 6.72(5.4) | 6.62(9.9) |
| P62737 | Actin, aortic smooth muscle | Acta2 | 10.82(2.8) | 10.79(18.5) | 11.19(5.2) | 10.56(1.2) | 10.79(5.3) | 10.22(10.5) | 10.31(2.6) | 9.92(1.4) | 10.00(15.0) | 9.37(2.3) |
| Q9WV32 | Actin-related protein 2/3 complex subunit 1B | Arpc1b | 2.16(7.5) | 4.94(19.1) | 4.85(9.5) | 4.84(7.5) | 3.97(14.4) | 2.30(16.3) | 4.42(1.4) | 4.14(15.4) | 4.55(8.9) | 3.68(18.8) |
| Q9JM76 | Actin-related protein 2/3 complex subunit 3 | Arpc3 | 1.05(21.3) | 5.18(9.9) | 5.32(0.8) | 4.56(7.8) | 4.59(12.4) | 3.73(14.9) | 5.31(7.4) | 4.36(14.0) | 4.61(20.8) | 3.61(18.5) |
| Q91V92 | ATP-citrate synthase | Acly | 4.82(19.4) | 3.22(16.0) | 5.52(12.2) | 5.22(15.4) | 5.30(19.6) | 5.76(15.7) | 4.05(13.3) | 4.62(3.8) | 4.34(22.9) | 6.42(8.8) |
| P26231 | Catenin alpha-1 | Ctnna1 | 3.72(20.6) | 1.64(13.4) | 3.89(21.8) | 4.51(17.4) | 5.02(17.2) | 5.33(11.6) | 1.16(21.1) | 3.96(12.3) | 4.15(14.4) | 6.23(5.1) |
| Q61301 | Catenin alpha-2 | Ctnna2 | 2.82(19.4) | 5.08(20.6) | 3.39(10.2) | 3.73(16.4) | 3.89(12.5) | 3.59(21.5) | 1.16(21.1) | 1.80(22.7) | 2.35(21.3) | 4.32(14.6) |
| Q9CZ13 | Cytochrome b-c1 complex subunit 1, mitochondrial | Uqcrc1 | 2.45(10.3) | 3.80(10.0) | 1.89(8.1) | 2.10(14.3) | 2.29(18.1) | 4.51(22.4) | 3.66(12.5) | 4.31(8.9) | 3.88(16.1) | 4.37(9.4) |
| Q00612 | Glucose-6-phosphate 1-dehydrogenase X | G6pdx | 3.30(12.2) | 5.91(18.2) | 6.00(7.0) | 5.46(19.7) | 4.86(1.9) | 3.51(21.6) | 6.42(10.4) | 5.75(17.6) | 5.54(13.6) | 3.78(16.5) |
| P63017 | Heat shock cognate 71 kDa protein | Hspa8 | 7.55(13.6) | 7.99(5.6) | 8.01(8.0) | 8.41(3.7) | 8.41(3.9) | 8.02(2.5) | 7.85(6.4) | 7.75(7.7) | 7.40(6.1) | 8.49(2.6) |
| P09055 | Integrin beta-1 | Itgb1 | 1.55(20.4) | 3.96(5.5) | 4.62(12.5) | 4.93(11.1) | 4.85(22.8) | 4.31(3.9) | 3.84(18.2) | 4.15(22.9) | 3.30(18.8) | 4.98(17.5) |
| O70309 | Integrin beta-5 | Itgb5 | 2.05(12.9) | 3.82(7.1) | 3.26(6.4) | 2.10(10.6) | 3.42(18.1) | 3.02(12.7) | 3.05(17.7) | 2.57(15.6) | ||
| Q91WD5 | NADH dehydrogenase [ubiquinone] iron-sulfur protein 2, mitochondrial | Ndufs2 | 3.24(16.8) | 2.14(13.1) | 2.51(12.5) | 2.10(16.0) | 2.90(18.1) | 2.74(14.4) | 1.66(14.8) | 1.01(16.4) | 2.35(21.3) | 3.44(7.9) |
| Q9DCT2 | NADH dehydrogenase [ubiquinone] iron-sulfur protein 3, mitochondrial | Ndufs3 | 3.02(20.1) | 3.74(16.0) | 1.82(10.5) | 1.60(10.2) | 1.60(13.9) | 3.62(17.9) | 2.04(8.9) | 1.30(18.9) | 1.33(1.1) | 2.68(12.8) |
| O35468 | Protein Wnt-9b | Wnt9b | 1.04(19.2) | 1.86(16.1) | 2.04(14.7) | 2.83(14.1) | ||||||
| P63001 | Ras-related C3 botulinum toxin substrate 1 | Rac1 | 2.34(22.0) | 4.71(22.6) | 5.40(7.5) | 4.84(16.0) | 3.77(17.2) | 2.80(21.7) | 4.62(0.3) | 2.96(16.2) | 3.87(19.1) | 3.57(15.9) |
| Q8K2B3 | Succinate dehydrogenase [ubiquinone] flavoprotein subunit, mitochondrial | Sdha | 4.08(14.4) | 3.30(18.9) | 2.82(6.8) | 3.42(0.4) | 2.60(12.1) | 5.05(16.5) | 3.04(13.5) | 2.59(6.4) | 2.33(22.1) | 4.29(21.2) |
| Q93092 | Transaldolase | Taldo1 | 4.45(18.8) | 6.53(14.4) | 6.83(10.8) | 6.33(12.3) | 5.38(6.8) | 4.77(5.2) | 6.05(8.4) | 5.62(5.1) | 5.88(2.0) | 5.54(3.5) |
| Q9QUI0 | Transforming protein RhoA | Rhoa | 1.55(14.4) | 4.37(18.9) | 5.20(9.1) | 6.02(5.5) | 3.77(13.2) | 3.93(16.2) | 4.50(0.1) | 3.99(2.2) | 3.96(15.6) | 4.21(14.6) |
| Q9D4D4 | Transketolase-like protein 2 | Tktl2 | 2.04(14.7) | 2.64(11.7) | 2.89(15.4) | 3.51(16.5) | 1.82(16.2) | 1.21(20.1) | 3.13(17.7) | 2.34(22.4) | 2.74(8.2) | 2.86(5.4) |
| P20152 | Vimentin | Vim | 7.84(13.6) | 8.68(0.7) | 9.37(2.1) | 9.50(5.2) | 10.30(6.3) | 8.75(4.4) | 8.37(9.9) | 8.73(6.3) | 8.33(8.4) | 9.51(5.7) |
*Quantitative value is log2(protein area/total protein area) ×106.
Global protein profiling between Acomys and Mus skin over 14 days after full thickness skin wounding
We first compared the protein expression profiles to assess the trends between the two species during wound healing by a principal component analysis (PCA) of the common proteins (a total of 1545). This showed differences in the overall expression profiles between Acomys and Mus through 14 days (Fig. 3). Interestingly, the protein expression levels in Acomys from 0 to 3 days were clearly separated but, at 5, 7 and 14 days were clustered closely. Correspondingly, Mus at 0 day was well separated, at 3, 5, and 7 days clustering was apparent but not at 14 days which unexpectedly showed a return to the day 0 profile. This suggests that by day 14 the Mus skin has effectively completed its scarring process, but the Acomys skin is still in the process of new protein production and regeneration. To assess the statistical significance associated with biological variation from three biological replicates at the different time points, the coefficient of variations (CV) were determined and presented in the supplemental Fig. S3. This showed the high reproducibility across all samples.
Figure 3.

Principal components analysis (PCA) of the expression profiles of common proteins detected for skin samples from Acomys (left plot) and Mus (right plot) indicating red dots for day 0, dark blue dots for day 3, pale blue dots for day 5, pink dots for day 7 and green dots for day 14. Three replicates at day 0, 3, 5, 7, and 14 are delineated with the ellipses.
We next compared the global changes of the common proteins between Acomys and Mus over 14 days (see Fig. 4A–D). This showed no clear changes over the time periods, but common proteins were highly biased in Mus towards negative fold changes. This was not the case in Acomys where the fold changes were more evenly distributed than Mus between positive and negative.
Figure 4.

Volcano plots comparing fold changes of common proteins between Acomys and Mus over periods 0-3d (3A), 0-5d (3B), 0-7d (3C) and 0-14d (3D). The colors indicate the protein source, Acomys blue and Mus pink.
KEGG analysis of the differentially expressed proteins in Acomys and Mus skin during wound healing
Proteins were considered as differentially expressed in Acomys and Mus if they exhibited a fold change during the four time periods of >1.6 or <-2 with p- value < 0.01 among the biological replicates. When we analyzed the counts of differentially expressed proteins (DEPs) in the two species in terms of their cell locations, despite being similar in the normal skin at day 0 (Fig. 2) it was apparent that during regeneration/scarring differences appeared (Fig. 5). Whereas the DEPs in Acomys localized to cytosol, extracellular matrix, ER and cytoskeletal components, DEPs in Mus were far more strongly localized to the extracellular matrix and mitochondrial components. This suggests that these two cellular locations characterize Mus scarring and the more regenerative phenotype of Acomys is characterized by the ER and higher cytoskeletal and cytosolic representations.
Figure 5.
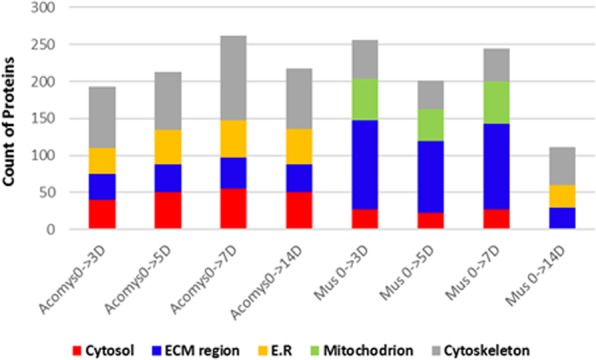
Gene ontology analyses of significantly changed (p <0.01) differentially expressed proteins (DEPs) by subcellular location in Acomys and Mus at day 0.
To obtain further insight into the functional roles for DEPs associated with wound healing in Acomys and Mus, we carried out GO-BP and KEGG pathway analyses. We first made pathway annotations based on the KEGG database for both positive and negative DEPs. Twenty- five categories were enriched (Fig. 6), among which fourteen were particularly prominent, in Acomys. On the other hand, nine were enriched in Mus with only three prominent, the hub proteins enriched in pathways in our study are given in Table S3. The most notably enriched categories in Acomys were those involved in tight junction formation, endocytosis, the ribosome pathway, the proteasome pathway, Wnt signaling, MAPK signaling and vasopressin-regulated water reabsorption. In contrast, there was little enrichment of pathways in Mus overall, except for the complement and coagulation cascades, PPAR signaling, (Table S3) ECM-receptor interactions and metabolic pathways (Fig. 6).
Figure 6.
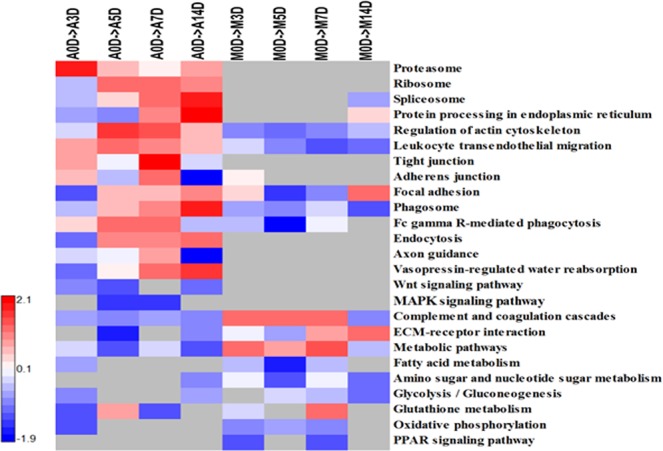
Heat-map shows the results of a pathway analysis related to GO biological process terms for DEPs between Acomys (A) and Mus (M) at different time periods of 0, 3, 5, 7, 14 days, (p < 0.01). The scaling bar indicates protein fold changes ranging from −2 to +2.1.
The fold changes of levels of proteins representative of five different pathways during different times from day 0 for Acomys and Mus are shown as volcano plots in Fig. 7A–D to show the changes over time rather than a static plot. These figures showed the trends of DEPs changes at different time points.
Figure 7.

Volcano plots showing fold changes of relative protein abundances for Acomys and Mus over periods 0–3d (A), 0–5d (B), 0–7d (C) and 0–14d (D). The proteins highlighted refer to processes/pathways related to protein degradation/ synthesis and inflammatory response. viz. red dots for ribosome, blue dots for spliceosome, green triangle for protein processing in E.R, black diamond for ubiquitin/proteasome and black cross for complement and coagulation cascades.
Ribosomal proteins showed clearly different behavior, being elevated in Acomys but depressed in Mus. Spliceosome proteins were elevated in Acomys through 14 days, but in Mus were initially (0–7d) little changed and then elevated after 14 days. The ubiquitin/proteasome pathways were elevated in Acomys throughout all time points. The complement proteins are elevated in both species but there are more representatives in Mus and the ER components show changes in both Acomys and Mus but at different time points.
Regulatory pathways of protein degradation /synthesis in Acomys
Ubiquitin-proteasome pathway (UPP) degradation mechanisms were highly activated in Acomys compared to those in Mus. Thus UBB, UBC, NEDD4, UBA1, and UBA52 which were detected in both species increased at day 7 in Acomys, but those in Mus were almost unchanged. Several of this class of proteins, namely UBE2E1, UBE2O, UBE2Q2, USP7, USP34 and RNF40 were only detected in Acomys (Table 1).
26S proteases having unfoldase function (PSMC3, PSMA5) showed significant increases in Acomys. Several proteins in ribosome pathways, especially 40S ribosomal proteins (S13, S17, S26, S27A) and 60S (L4, L13A, L27A) were identified in both species (Table 1). Most of them showed significant increase in Acomys, but not in Mus. We also observed DEPs in the spliceosome pathway such as SF3B3, SRSF2, SNRPD2, HNRNPA1, DDX39B and EFTUD2 which in Acomys showed a characteristic pattern of low level expression at day 0 rising to high levels by day whereas in Mus their levels were almost unchanged or slightly decreased over the same time period.
Proteins in the ER, especially two lectins CALR and CANX which are involved in the CNX/CRT cycle for phosphorylation, showed significant increase in Acomys. DDOST, PDIA6 and TXNDC5 were also elevated in Acomys to a higher degree than in Mus.
Of the 12 identified proteins involved in phosphorylation in Acomys (cell cycle proteins, growth factor receptors, tyrosine protein kinases) they generally did not increase significantly over time, but most strikingly only 3 of them (EFGR, EPS15 and WNK1) were identified in Mus. Representative DEPs enriched in these pathways in A. cahirinus are presented in Table 1.
Profiles of intermediate filaments (IFs) in Acomys and Mus
Keratins were highly abundant in both species and twenty-three are listed in Table S4. The amounts of various cytoskeleton keratins showed little change through 14 days with a couple of exceptions, but cuticular keratins (K31, K32, K33b, K35 and K36) were significantly higher in Acomys compared to Mus at day 0, subsequently showing fairly constant values over 14 days (Table 1). Vimentin, a fibroblast marker prominent in both species, was 1.5-fold elevated in Acomys from day 0 to day 7, and 2.5-fold upregulated at day 14 whereas Mus showed almost unchanged levels at the same time period (Table 1). Interestingly the only Wnt detected was Wnt 9b in Acomys. The small GTPases RhoA and Rac1 were detected at significantly higher levels in Acomys at most time points (Table 1).
Regulatory pathways of immune/inflammatory responses in Mus
Innate immune response-related proteins, especially those related to the complement pathway, were up-regulated in Mus. 16 complement and coagulation factors and 6 immuno-modulatory proteins were detected in Mus, with many showing temporary increases over 3-7 days before decreasing at day 14. Exclusive detection of complement and coagulation factors (C1S, C4BP, C8A, C8G, C9, CFD, and F12) as well as significantly elevated levels of C2, C3, CFI, FGA, FGB, FGG, F2, F10 and PLG were observed in Mus. Of these 22 proteins 10 were absent from Acomys extracts and the temporary increases in levels was again apparent but less pronounced (Table 1).
Myeloperoxidase as a neutrophil marker was highly increased in both species. However, arginase 1 was only identified in Mus and arginase 2 only in Acomys (Table 1). 10 proteases were identified and showed very different levels of expression between Acomys and Mus. Cathepsin G, mast cell protease 4 and tryptase beta 2 were only expressed in Acomys, whereas matrix metalloprotease 9, plasma kallikrein and pro-cathepsin H and cathepsin L1 were solely detected in Mus (Table 1). Cathepsins B, D, and Z were expressed in both species, they were at constant high levels in Mus but increased through 14 days in Acomys. A total of 17 serine protease inhibitors (SERPINs) were quantified in our study (Table 1 and S5). Strikingly, the vast majority were not detected in Acomys at any stage, for example only 2 of the 13 listed in Table S5 were identified in Acomys
Collagenous composition in extra cellular matrix (ECM)
Next, we investigated collagen levels in the two species and 10 collagens, all alpha isoforms, were identified. Only 1 could not be detected in Acomys, COL 17A1, and the remainder increased throughout the 14 days period in both species, but with a greater increase seen in Mus. The largest increase in Mus over Acomys was seen in COL12A1. The collagen triple helix repeat-containing protein 1 which is involved in collagen remodeling showed far higher levels in Acomys (Table 1).
Verification of fibrotic/non-fibrotic related proteins by western blot analysis
Since they are of particular interest due to their involvement in immune defense and ECM synthesis, we verified the expression of COL1, COL3, COL12, S1008, MMP9, TIMP and 14-3-3 by western blot analysis (Fig. 8). Wound collagens at day 14 revealed significant changes compared to day 0. COL1, COL3 and COL12 were 7.6 times, 5.5 times and 58 times increased in Mus and 5.7 times, 7.8 times and 21 times increased in Acomys respectively, confirming the generally higher levels in Mus that the proteomic analysis recorded (Table 1). S100A8 and MMP9 at day 5 and TIMP at day 7 were detected only in Mus. 14-3-3 δ at day 7 was increased 2.8 times in Acomys and less than 1 in Mus.
Figure 8.

Western blots of skin and wound lysates, with GAPDH as a loading control and detection by specific antibodies. Lane designations A, M, refer to Acomys and Mus, figures in brackets are days post-wounding; error bars on intensity values are standard deviations.
Protein -protein interaction analysis
To examine the interactions between DEPs detected in response to wound healing in Acomys and Mus, we constructed network models using DEPs from the STRING database (http://string-db.org) (Fig. 9A,B). From this map, we searched the key proteins and their interactions involved in biological processes that may influence the wound healing outcomes. Overall, several hub proteins exhibiting physical and co-expression interactions with multiple proteins in diverse pathways were identified in the two species. For Acomys (Fig. 9A) the number of smaller interaction groups were identified and consisted of cell signaling and protein degradation and synthesis pathway components. These included protein tyrosine kinase activities such as MAP2K1 and FGFR4, GTPase activity (RAC1, RHOA), cell adhesion (CTNNB1, Calr), protease binding (UBA52, S27A), RNA binding (HAPA8, EFTUD2), cytoskeletal structure (ARPC3, ARPC1B), and ribosome structure (L27A, S13) (Fig. 9A). In Mus, the interacting groups included integrin binding which would be associated with the higher levels of collagens that we detected, catalytic activity (ACAA2, UQCRC1), oxidoreductase activity (SDHA, GSR), NADH dehydrogenase (NDUFS2 and NDUFS3), serine peptidase inhibitor (KLKB1, F2), growth factor binding (COL6A1, ITGAV), peptidase inhibitor activity (KNG1, SERPIND1), protease binding (SERPINC1, SERPINF2) and transferase activity (TKT, TALDO1) (Fig. 9B). Additional DEPs not exhibiting interactions with other proteins found in this analysis also likely play indirect roles in wound healing for Acomys and Mus.
Figure 9.

Protein-protein interactions predicted for DEPs found in Acomys and Mus. The STRING database was used to examine proteins significantly changed in Acomys (A) or in Mus (B). Each node in the network represents a DEP. Interactions are shown by the blue lines connecting each node with the weight of each line representing the confidence of the interaction based on available evidence in the database. Clusters of interest are indicated by the colored labels.
Discussion
Acomys cahirinus retains a remarkable capacity for regenerative healing potential in a scar- free manner across multiple adult tissues. To reveal the mechanisms that support regeneration of Acomys on a molecular level we have undertaken a qualitative and quantitative proteomic analysis of Acomys compared to the scarring Mus using LC-MS/MS approaches. We identified proteins and their expression levels from skin tissue extracts with label free quantification through 0, 3, 5, 7 and 14 days as the wounds are undergoing re-epithelialization, the inflammatory phase and establishing granulation tissue. These stages were chosen as key time points for identifying protein differences potentially responsible for regeneration vs scarring and to correlate with our previous cellular and molecular studies17,18. The quantitative results of several proteins from skin wounds in this data were also validated by western blot analysis and demonstrate a good correlation of protein levels between our mass spectrometric based methodology and immunoblotting.
Re-epithelialization and histolysis are key early events required for the ability to regenerate complex tissues. Our proteomics studies revealed that the most enriched pathway and proteins among the DEPs were categorized as protein degradation/synthesis, especially, with the highly enriched ubiquitin/proteasome pathway present in Acomys. Accordingly, UBA, UBC and NEDD4 as ubiquitin enzymes are highly activated in Acomys, resulting in tagging and directing target/condemned protein into the proteasome, where they are degraded and recycled. These degraded proteins activate other proteins that contribute to cell cycle and cell survival mechanisms. A recent study demonstrates highly enriched ubiquitination/proteasomal degradation in liver regeneration, especially NEDD4 as an essential regulator by performing EPS15 ubiquitination which promotes EGFR internalization and efficient signaling in hepatocytes21. We were able to detect EGFR and EPS15 after wounding with a 2.7-fold increased NEDD4 at day7 in Acomys but EGFR and NEDD4 were either constant or significantly decreased in Mus, with little EPS15.
Although both Mus and Acomys can re-epithelialize their skin wounds the former does not normally replace the hairs and so the repaired skin remains hairless unless large wounds are made in some Mus strains, so called wound induced hair follicle neogenesis13. Acomys on the other hand regenerates all the hairs beginning as early as day 11 after wounding. The Wnt pathway plays a role in controlling epidermal stem cell renewal, in reciprocal interactions with the dermal papilla requirement and activation of the migrating wound epidermis22–25. Hair follicle induction specifically involves Wnt7a as ectopic expression of this gene in Mus induced hair follicle neogenesis26 and Wnt7a expression is specifically up-regulated in Acomys wounds17. The only Wnt that we detected here was Wnt9, only in Acomys (Table 1) and its levels increased 2-fold on day 7. However, many members of the Wnt pathway were identified as up-regulated in Acomys following a KEGG analysis confirming the role of this pathway in hair follicle regeneration.
Another feature of Acomys re-epithelialization is a 2x faster rate of cell migration11,27. We identified many keratins in this proteomic analysis, the majority of which showed no differences between Acomys and Mus except for some cuticular keratins such as K31, K32, K35 and K36 which were elevated in Acomys. We have also observed similar expression levels of K17, the embryonic keratin involved in follicle neogenesis but a 2 times higher expression of 14-3-3δ as well as strongly increased vimentin levels in Acomys. Since an interaction of keratin 17 with 14-3-3δ and with signaling proteins for the regulation of cell growth in wounds28 and a vimentin interaction with ribosomal protein S17 and 4-3-3δ for stimulating protein synthesis29 have been demonstrated, it is perfectly feasible that increased levels of intermediates such as 14-3-3 δ in Acomys could have significant stimulatory effects on regeneration. Furthermore, keratins can profoundly influence cytoarchitecture by regulating signaling pathways and modulating protein synthesis and cell growth during the process of tissue repair30 so these particular proteins may also be having some influence on the rate of re-epithelialization if not more profound effects on regeneration after injury in Acomys.
We know from previous molecular and cellular analyses that the immune and macrophage responses to injury are quite different between Acomys and Mus. In skin regeneration there is a huge immune cytokine response in Mus and M1 macrophages (F4/80) are present throughout the resolving granulation tissue after wounding whereas in Acomys the immune response is blunted and M1 macrophages are absent or deficient from an equivalent region18,31. The regenerating Mus ear cytokines are expressed at higher levels than in Acomys and similarly, the ear is nearly devoid of classically activated macrophages (CD86) but shows plenty of M2, CD206 macrophages19. The same is seen during skeletal muscle regeneration and kidney regeneration in Acomys32,33. Nevertheless macrophages are necessary for epimorphic regeneration19 so the M2 phenotype must provide these pro-regenerative cytokines. We have found that to be the case here using proteomics. Thus, several immune modulators including S100A6, S100A8 and S100A9 were detected only in Mus. Several complement and coagulation factors were detected only in Mus and many serine proteases (serpins), proteins associated with inflammation and fibrosis, were present exclusively in Mus (Table S5). With regards to macrophage markers, arginase 1 was observed only in Mus whereas arginase 2 was solely identified in Acomys. Previous studies showed that arginases 1 and 2 as macrophage phenotypic markers are differentially related to inflammatory responses34 with arginase 1 being widely expressed in either M1 or M2 polarized environments35 and upregulated Arg1 by some M1 macrophages36. Yang showed that iNos-independent pro-inflammatory responses mediated by Arg2 in macrophages are due to enhanced mitochondrial ROS, but how Arg2 affects mitochondrial function leading to ROS production in macrophages remains unclear34. Notably, an acute inflammatory response was characterized by a higher myeloperoxidase activity in Mus and elevated ROS production in Acomys19, just as we have seen here and ROS production has been suggested as an essential early signal for regeneration based on studies in Xenopus and zebrafish tail models of regeneration37,38. Although we have not directly shown that high ROS production is generated specifically by Arg2, its presence identified here in Acomys and high ROS production in Acomys ear regeneration19 may be no coincidence.
On the other hand, macrophage mannose receptor isomers, MRC1 (CD 206) and MRC2 (CD280) were present in both species. Several studies have demonstrated the critical role of the innate immune system in regulating regeneration and in the absence of macrophages Acomys ear regeneration and salamander heart regeneration is inhibited19,39. Presumably in these classes of macrophages are those that are crucial for non-fibrotic regenerative events across the vertebrates.
The profiles of extracellular matrix (ECM) proteins were different between Acomys and Mus. 11 members of the alpha collagen family were detected and, after wounding there is an increase in levels in all but one case with generally higher levels in Mus, the highest being for COLXII and COLXIV. Gawriluk et al. by transcriptomic studies of ear hole closure showed increased expression of collagen subunits in Mus relative to Acomys14. But in addition to matrix molecules there were several proteases and collagen remodeling proteins which were more highly or exclusively expressed in Acomys suggesting that despite the presence of relatively high levels of collagens a less fibrotic matrix could be generated which is certainly seen in histological analyses18. For example, CTHRC1 was more highly expressed in Acomys which can reduce collagen I mRNA and protein expression, inhibit TGF-β and promote cell migration40. The mast cells-related proteases cathepsin G, mast cell protease 4 and tryptase β2 were exclusively detected in Acomys and on the other hand the MMP inhibitors TIMP1 and cystatin were solely detected in Mus. Thus, a more fibrotic and rigid matrix is generated in Mus which may be why we saw integrin binding appearing as an interacting group in the network analysis of Mus proteins (Fig. 9B).
It is clear that many differences in protein expression between regenerative repair in Acomys and fibrotic repair in Mus can be identified. It will be important to design studies to determine if there are particular genetic or metabolic components that can trigger regeneration repair in favor the fibrotic/inflammatory pathways that are normally seen after wounding in mammals.
Materials and Methods
The following reagents were used: acetonitrile, water, formic acid (all LC-MS grade), TCEP (Tris (2-carboxyethyl) phosphine) and iodoacetamide were purchased from Sigma-Aldrich (St. Louis, MO). Sequence grade of modified trypsin (Pierce trypsin protease, MS grade # 90057) was obtained from Fisher Scientific (Fairlawn, NJ).
Animals
All experiments were performed following guidelines of the Guide for the Care and Use of Laboratory Animals of the National Institutes of Health. The protocols were approved by the Institutional Animal Care and Use Committee (IACUC) at the University of Florida (# 201203505 (Mus) and 201207707 (Acomys)) and animals were housed under the care of the University of Florida’s Animal Care Services. A. cahirinus were obtained from a breeding colony house at University of Florida and M. musculus of the CD-1 outbred strain was purchased from Charles River (Wilmington, MA). Animals were 6 months of age at time of experiments. Animals were anaesthetized with iso-fluorane, the hair on the dorsum was shaved and two 8 mm biopsy punch wounds made through the mid-dorsal full thickness skin. At various times after wounding (3, 5, 7, 14 days) the animals were sacrificed, and the wound tissue dissected out excluding the surrounding normal skin.
Protein sample preparation
The tissue (100 mg) was homogenized on ice for 30 seconds using a rotor stator type tissue homogenizer (ProScientific Bio-Gen PRO200 Homogenizer; Multi-Gen 7XL Generator Probes) in a protein extraction buffer (1 mL) containing Tris-Cl (50 mM, pH 7.4), NaCl (100 mM), ethylenediaminetetraacetic acid (EDTA, 1 mM), protease inhibitors (1:25 cOmplete UTLRA, Roche), phosphatase inhibitors (1:10 PhosSTOP, Roche) and kept at 4 °C for 1 h. Soluble proteins were separated from undissolved tissue by centrifugation at 80000 g for 30 min at 4 °C. Protein levels were measured using a BCA kit (Pierce) and protein amounts normalized (2 mg/mL) by dilution in protein extraction buffer. For each experiment and each experimental time point, a group size of 3 animals was used.
Protein digestion and peptide fractions
Protein samples (100 µg) were loaded on a gel (Novex, 8%, Bis-tris), All steps were carried out as described previously41. Briefly, electrophoretic migration was performed to fractionate the protein into 10 gel bands. Incised gel bands were reduced by adding 500 µl of TCEP (10 mM) in NH4HCO3 (100 mM) at 37 °C for 30 min, and then treated with 500 µl of IAA (55 mM) in NH4HCO3 (100 mM) at RT for 1 h in the dark. After removing the excess regents in-gel tryptic digestion was performed with trypsin (total protein: trypsin (50:1, in NH4HCO3 (50 mM) at 37 °C overnight). The following day, trypsinization was quenched by formic acid (10 µL). Digested samples were dried using a Speed Vac and were stored at -80° until used.
LC-MS/MS analysis
The tryptic digests were analyzed using an LTQ Velos Orbitrap mass spectrometer (Elite Version, Thermo Scientific, San Jose, USA) coupled with an EASY-nLC system (Thermo Scientific, USA) by a nano electrospray ion source. Samples were dissolved in 20 µl of buffer A (0.1% formic acid aq) and 5 µL (1 µg) were injected for each analysis. Data quality and instrument performance were assessed by examining the performance of HeLa protein digest standard (100 ng, cat # 88328, Thermo Scientific) throughout the sequence. Peptides were delivered to a trap column (Acclaim PepMap 100, 75 µm x 2 cm, nano Viper C18, 3 µm, Thermo Scientific) at a flow rate of 5 µL/ min in 100% buffer A. After 20 min of loading and washing, peptides were transferred to an analytical column (C18 AQ, 3 µm, 100 µm x 25 cm, Nano LC, USA) and separated using a 120 min gradient from 0-40% of solvent B (0.1% formic acid in acetonitrile) at a flow rate of 300 nL/min. The LTQ Velos Orbitrap mass spectrometer was operated in a data-dependent mode switching between MS and MS2. The MS acquisition parameters were as follows: resolution of full scans was 120000 at m/z 400; six data-dependent MS/MS scans were acquired by collision induced dissociation (CID) per one full scan; CID scans were acquired in linear trap quadrupole (LTQ) with 10 ms activation time and 35% normalized collision energy (NCE) in CID; and a 2.0 Da isolation window. Previously fragmented ions were excluded for 60 s for all MS/MS scans. The MS1 mass scan range was 400−2000 m/z. The electrospray voltage was 2.2 kV and the capillary temperature was set at 250 °C.
Database search and data validation
MS/MS spectra were extracted by the MM File Conversion Tool (Version3.9, http://www.massmatrix.net/mm-cgi/downloads.py) and sent to a database search using SEQUEST42. They were searched against the integrated proteomics pipeline (IP2): SEQUEST with modified parameters (precursor ion tolerance = 50 ppm, fragment ion tolerance 0 0.8 Da, missed cleavage ag2, modification , carbamidomethyl cysteine (fixed), methionine oxidation (variable), and enzyme (trypsin)). For peptide validation, a 1% false discovery rate (FDR) at the peptide spectral match (PSM) and/ or peptide level was used. We used the ProteinInferencer43 (Scripps Research Institute, La Jolla, CA; http://proteomicwiki.com/wiki/index.php/ProteinInferencer) for an integration of all data generated from the three search engines using an FDR <1.0% at protein level. The detailed calculation method and the search conditions using this program have been reported41. Data were searched against a target-decoy Swiss-Prot database, version 2016_08 from mouse (http://www.uniprot.org). We applied a label-free quantitation of the identified peptides to a protein with manual validation. Protein quantification based on the extracted ion chromatogram (XIC) was obtained by extracting the intensity corresponding to the m/z of the selected peptides along the LC-MS run and by integrating the peak area at their respective retention time (RT). Normalized protein quantitative values were calculated as log2 (protein area/total protein area) x 106. Reverse decoy matches were removed from the protein identification list. At least 2 unique peptides per protein were required for protein identification. Only proteins that were identified and quantifiable in at least two technical of at least three biological replicates in each group were used for relative quantification. The criteria for identifying differentially expressed proteins (DEPs) were at least a 2 fold change in levels in either direction with a p-value for significance of ≤ 0.01 and coefficients of variation (CV) <20%. Experiments were repeated at least three times and the results analyzed using the unpaired t-test assuming equal variance on the normalized, scaled dataset. and adjusted for the false discovery rate ( 0.01) using the Benjamini-Hochberg method (BH)44.
GO enrichment/pathway analysis
Classification and functional enrichment analysis of the DEPs were performed using DAVID (Database for Annotation, Visualization and Integrated Discovery, version 6.8), a Bioinformatics Database for the biological process (BP), cellular components (CC) and molecular function (MF). WEB-based Gene Set Analysis Toolkit (WebGestalt, http;//bioinfo.vanderbilt.edu/webgestalt) was used to map the DEPs to KEGG pathway for biological interpretation45. Principal components analysis (PCA) was performed using MetaboAnalyst 4.046. Protein-protein interaction were examined using STRING (v10.5)47.
Western blot analysis
Western blotting was performed on the original samples used for MS analysis or on new wounds (n = 3). The lysates from skin were electrophoresed, transferred to nitrocellulose, and probed for selected proteins as described earlier48. The primary antibodies used in this study were TIMP1 (1: 200, cat# AF980, R&D), MMP 9 (1: 1000, cat# LS-B2486, LSBio), 14-3-3 (1:500, cat# ab155037, Abcam), actin (1:1000, cat# mAbcam 8226, Abcam), GAPDH (1:5000, cat# mAbcam 9484, Abcam), collagen 1(1:1000, cat# 34710, Abcam), collagen III (1:500, cat# sc-8781, Santa Cruz), S100A8 (1:100, cat# ab178577, Abcam), collagen XII (rabbit polyclonal, kind.pngt of Dr. D. Birk, University of South Florida and Dr M. Mark, University of Cologne, Germany). The pixel density representing each protein was determined by subtracting a background pixel density using Alphaview version 2 from FluorChem E (Proteinsimple CA, USA).
Supplementary information
Acknowledgements
This work was funded by a grant from the WM Keck Foundation. We thank Dr Mikhail Soloviev of the Department of Biological Sciences, Centre for Biomedical Sciences at Royal Holloway University of London, UK for much help with bioinformatics.
Author contributions
J.H.Y. performed the experiments, analyzed the data and co-wrote the manuscript. K.C. and T.J.G. performed experiments and reviewed text. P.F. analyzed the data and co-wrote the manuscript. M.M. obtained funding for the project, designed the experiments and co-wrote the manuscript.
Data availability
MS data have been deposited in the repository with the dataset identified MassIVE MSV000084615.
Competing interests
The authors declare no competing interests.
Footnotes
Publisher’s note Springer Nature remains neutral with regard to jurisdictional claims in published maps and institutional affiliations.
Supplementary information
is available for this paper at 10.1038/s41598-019-56823-y.
References
- 1.Clark, R. A. F. & Henson, P. M. The molecular and cellular biology of wound repair. xxii, 597 (Plenum, 1988).
- 2.Seifert AW, Maden M. New insights into vertebrate skin regeneration. Rev. Cell Int. Mol. Biol. 2014;310:129–1699. doi: 10.1016/B978-0-12-800180-6.00004-9. [DOI] [PubMed] [Google Scholar]
- 3.Seifert AW, Monaghan JR, Voss SR, Maden M. Skin regeneration in adult axolotls: a blueprint for scar-free healing in vertebrates. PLoS One. 2012;7:e32875. doi: 10.1371/journal.pone.0032875. [DOI] [PMC free article] [PubMed] [Google Scholar]
- 4.Levesque M, Villard E, Roy S. Skin wound healing in axolotls: a scarless process. J. Exp. Zool. Part. B, Mol. Dev. Evol. 2010;314:684–697. doi: 10.1002/jez.b.21371. [DOI] [PubMed] [Google Scholar]
- 5.Larson BJ, Longaker MT, Lorenz HP. Scarless fetal wound healing: a basic science review. Plast. Reconstr. Surg. 2010;126:1172–1180. doi: 10.1097/PRS.0b013e3181eae781. [DOI] [PMC free article] [PubMed] [Google Scholar]
- 6.Lo DD, Zimmermann AS, Nauta A, Longaker MT, Lorenz HP. Scarless fetal skin wound healing update. Birth Defects Res. Part C. Embryo Today: Rev. 2012;96:237–247. doi: 10.1002/bdrc.21018. [DOI] [PubMed] [Google Scholar]
- 7.Satish, L., & Kathju, S. Cellular and molecular characteristics of scarless versus fibrotic wound healing. Derm. Res. Practice. 790234 (2010). [DOI] [PMC free article] [PubMed]
- 8.Olutoye OO, Barone EJ, Yager DR, Cohen IK, Diegelmann RF. Collagen induces cytokine release by fetal platelets: implications in scarless healing. J. Pedia. Surg. 1997;32:827–30. doi: 10.1016/S0022-3468(97)90629-1. [DOI] [PubMed] [Google Scholar]
- 9.Sullivan KM, Lorenz HP, Meuli M, Lin RY, Adzick NS. A model of scarless human fetal wound repair is deficient in transforming growth factor beta. J. Pedia. Surg. 1995;30:198–202. doi: 10.1016/0022-3468(95)90560-X. [DOI] [PubMed] [Google Scholar]
- 10.Vorontsova, M. A. & Liosner, L. D. Asexual Propagation and Regeneration (Pergamon 1960).
- 11.Seifert AW, et al. Skin shedding and tissue regeneration in African spiny mice (Acomys) Nature. 2012;489:561–565. doi: 10.1038/nature11499. [DOI] [PMC free article] [PubMed] [Google Scholar]
- 12.Clark LD, Clark RK, Heber-Katz E. A new murine model for mammalian wound repair and regeneration. Clin. Immunol. Immunopathol. 1998;88:35–45. doi: 10.1006/clin.1998.4519. [DOI] [PubMed] [Google Scholar]
- 13.Nelson AM, et al. Prostaglandin D2 Inhibits Wound-Induced Hair Follicle Neogenesis through the Receptor, Gpr44. J. Invest. Dermatol. 2013;133:881. doi: 10.1038/jid.2012.398. [DOI] [PMC free article] [PubMed] [Google Scholar]
- 14.Gawriluk TR, et al. Comparative analysis of ear-hole closure identifies epimorphic regeneration as a discrete trait in mammals. Nat. Commun. 2016;7:11164. doi: 10.1038/ncomms11164. [DOI] [PMC free article] [PubMed] [Google Scholar]
- 15.Santos DM, et al. Ear wound regeneration in the african spiny mouse Acomys cahirinus. Regeneration. 2016;3:52–61. doi: 10.1002/reg2.50. [DOI] [PMC free article] [PubMed] [Google Scholar]
- 16.Maden. M. Optimal skin regeneration after full thickness thermal burn injury in the spiny mouse, Acomys cahirinus. Burns. 2018;44:1509–1520. doi: 10.1016/j.burns.2018.05.018. [DOI] [PubMed] [Google Scholar]
- 17.Brant JO, Lopez M-C, Baker HV, Barbazuk WB, Maden M. A., Comparative analysis of gene expression profiles during skin regeneration in Mus and Acomys. PLoS One. 2015;10:e0142931. doi: 10.1371/journal.pone.0142931. [DOI] [PMC free article] [PubMed] [Google Scholar]
- 18.Brant JO, Yoon JH, Polvadore T, Barbazuk WB, Maden M. Cellular events during scar-free skin regeneration in the spiny mouse, Acomys. Wound. Repair. Regen. 2016;24:75–88. doi: 10.1111/wrr.12385. [DOI] [PubMed] [Google Scholar]
- 19.Simkin J, Gawriluk TR, Gensel JC, Seifert AW. Macrophages are necessary for epimorphic regeneration in African spiny mice. eLife. 2017;6:e24623. doi: 10.7554/eLife.24623. [DOI] [PMC free article] [PubMed] [Google Scholar]
- 20.Brant JO, et al. Comparative transcriptomic analysis of dermal wound healing reveals de nove skeletal muscle regeneration in Acomys cahirinus. PLoS One. 2019;14(5):e0216228. doi: 10.1371/journal.pone.0216228. [DOI] [PMC free article] [PubMed] [Google Scholar]
- 21.Bachofner M, et al. Large-scale quantitative proteomics identifies the ubiquitin ligase Nedd4-1 as an essential regulator of liver regeneration. Dev. Cell. 2017;42:616–625. doi: 10.1016/j.devcel.2017.07.025. [DOI] [PubMed] [Google Scholar]
- 22.Hsu YC, Li L, Fuchs E. Emerging interactions between skin stem cells and their niches. Nat. Med. 2014;20:847–856. doi: 10.1038/nm.3643. [DOI] [PMC free article] [PubMed] [Google Scholar]
- 23.Fuchs E. Scratching the surface of skin development. Nature. 2007;445:834–842. doi: 10.1038/nature05659. [DOI] [PMC free article] [PubMed] [Google Scholar]
- 24.Myung PS, Takeo M, Ito M, Atit RP. Epithelial Wnt ligand secretion is required for adult hair follicle growth and regeneration. J. Invest. Dermatol. 2013;133:31–41. doi: 10.1038/jid.2012.230. [DOI] [PMC free article] [PubMed] [Google Scholar]
- 25.Okuse T, Chiba T, Katsumi I, Imai K. Differential expression and localization of WNTs in an animal model of skin wound healing. Wound. Repair. Regen. 2005;13:491–497. doi: 10.1111/j.1067-1927.2005.00069.x. [DOI] [PubMed] [Google Scholar]
- 26.Ito M, et al. Wnt-dependent de novo hair follicle regeneration in adult mouse skin after wounding. Nature. 2007;447:316–320. doi: 10.1038/nature05766. [DOI] [PubMed] [Google Scholar]
- 27.Stewart DC, et al. Unique behavior of dermal cells from regenerative mammal, the African spiny Mouse, in response to substrate stiffness. J. Biomech. 2018;81:149–154. doi: 10.1016/j.jbiomech.2018.10.005. [DOI] [PubMed] [Google Scholar]
- 28.Kim S, Wong P, Coulombe PA. Keratin cytoskeletal protein regulates protein synthesis and epithelial cell growth. Nature. 2006;441:362–365. doi: 10.1038/nature04659. [DOI] [PubMed] [Google Scholar]
- 29.Staley JP, Woolford JJ. Assembly of ribosomes and spliceosomes: complex ribonucleoprotein machines. Curr. Opin. Cell Biol. 2009;21:109–118. doi: 10.1016/j.ceb.2009.01.003. [DOI] [PMC free article] [PubMed] [Google Scholar]
- 30.Gu LH, Coulombe PA. Keratin function in skin epithelia: a broadening palette with surprising shades. Curr. Opin. Cell Biol. 2006;19:13–23. doi: 10.1016/j.ceb.2006.12.007. [DOI] [PubMed] [Google Scholar]
- 31.Gawronska-Kozak, B. & Bukowska, J. Animal models of skin regeneration in animal models for the study of human disease (2nd edition), 343–356 (2017).
- 32.Maden M, et al. Perfect chronic skeletal muscle regeneration in adult spiny mice, Acomys cahirinus. Sci. Rep. 2018;8:8920. doi: 10.1038/s41598-018-27178-7. [DOI] [PMC free article] [PubMed] [Google Scholar]
- 33.Okamura, D. M. et al. Scarless repair of acute and chronic kidney injury in African Spiny mice (Acomys cahirinus). bioRxiv 315069 (2018).
- 34.Yang, Z. & Ming, X. F. Functions of arginase isoforms in macrophage inflammatory responses: impact on cardiovascular diseases and metabolic disorders. Front. Immunol., 10.3389/fimmu.2014.00533 (2014). [DOI] [PMC free article] [PubMed]
- 35.Murray P, Wynn TA. Protective and pathogenic functions of macrophage subsets. Nat. Immunol. 2011;11:723–737. doi: 10.1038/nri3073. [DOI] [PMC free article] [PubMed] [Google Scholar]
- 36.Jablonski KA, et al. Novel markers to delineate Murine M1 and M2 macrophages. PLoS One. 2015;10:e0145342. doi: 10.1371/journal.pone.0145342. [DOI] [PMC free article] [PubMed] [Google Scholar]
- 37.Gauron C, et al. Sustained production of ROS triggers compensatory proliferation and is required for regeneration to proceed. Sci. Rep. 2013;3:2084. doi: 10.1038/srep02084. [DOI] [PMC free article] [PubMed] [Google Scholar]
- 38.Love NR, et al. Amputation-induced reactive oxygen species are required for successful xenopus tadpole tail regeneration. Nat. Cell. Biol. 2013;15:222–228. doi: 10.1038/ncb2659. [DOI] [PMC free article] [PubMed] [Google Scholar]
- 39.Godwin JW, Debuque R, Salimova E, Rosenthal NA. Heart regeneration in the Salamander relies on macrophage-mediated control of fibroblast activation and the extracellular landscape. NPJ Reg. Med. 2017;2:22. doi: 10.1038/s41536-017-0027-y. [DOI] [PMC free article] [PubMed] [Google Scholar]
- 40.LeClair RJ, et al. Cthrc1 is a novel inhibitor of transforming growth factor-beta signaling and neointimal lesion formation. Circ. Res. 2007;100:826–833. doi: 10.1161/01.RES.0000260806.99307.72. [DOI] [PubMed] [Google Scholar]
- 41.Cho K, et al. Quantitative phosphoproteomics of the human neural stem cell differentiation into oligodendrocyte by mass spectrometry. Mass. Spectrom. Lett. 2012;3:93–100. doi: 10.5478/MSL.2012.3.4.93. [DOI] [Google Scholar]
- 42.Eng JK, McCormack AL, Yates JR. An approach to correlate tandem mass spectral data of peptides with amino acid sequences in a protein database. J. Am. Soc. Mass. Spectrom. 1994;5:976–8. doi: 10.1016/1044-0305(94)80016-2. [DOI] [PubMed] [Google Scholar]
- 43.Zhang Y, et al. ProteinInferencer: Confident protein identification and multiple experiment comparison for large scale proteomics projects. J. Proteom. 2015;129:25–32. doi: 10.1016/j.jprot.2015.07.006. [DOI] [PMC free article] [PubMed] [Google Scholar]
- 44.Benjamini Y, Hochberg Y. Controlling the False Discovery Rate: a practical and powerful approach to multiple testing. J. R. Statist. Soc. B. 1995;57:289–300. [Google Scholar]
- 45.Zhang B, Kirov S, Snoddy J. WebGestalt: an integrated system for exploring gene sets in various biological contexts. Nuceicl. Acids. Res. 2005;33:W741–748. doi: 10.1093/nar/gki475. [DOI] [PMC free article] [PubMed] [Google Scholar]
- 46.Chong J, et al. MetaboAnalyst 4.0: towards more transparent and integrative metabolomics analysis. Nucleic. Acids. Res. 2018;46:W486–94. doi: 10.1093/nar/gky310. [DOI] [PMC free article] [PubMed] [Google Scholar]
- 47.Szklarczyk D, et al. STRINGv10: Protein–protein interaction networks, integrated over the tree of life. Nucleic Acids Res. 2015;43:D447–D452. doi: 10.1093/nar/gku1003. [DOI] [PMC free article] [PubMed] [Google Scholar]
- 48.Yoon JH, et al. Comparative proteomic profiling of dystroglycan-associated proteins in wild type, mdx, and galgt2 transgenic mouse skeletal muscle. J. Proteome. Res. 2012;11:4413–4424. doi: 10.1021/pr300328r. [DOI] [PMC free article] [PubMed] [Google Scholar]
Associated Data
This section collects any data citations, data availability statements, or supplementary materials included in this article.
Supplementary Materials
Data Availability Statement
MS data have been deposited in the repository with the dataset identified MassIVE MSV000084615.