Abstract
Inflammatory bowel disease (IBD) includes ulcerative colitis (UC) and Crohn’s disease (CD). Glucocorticoids (GCs) are the most effective treatment for moderate to severe active UC. However, one-third of patients are not sensitive to GCs (i.e., they are GC resistant). The mechanism of GC resistance in IBD is unknown, and it remains unclear how to predict resistance in IBD patients. This study aimed to explore the possible correlation between miRNA expression and variability in GC-resistant and GC-sensitive patients with ulcerative colitis. A comparative serum microRNA analysis in GC-resistant and GC-sensitive patients with ulcerative colitis was conducted by microarray. Differential microRNA expression was further validated in serum samples by quantitative real-time PCR. We found that downregulated microRNAs had a significant correlation with several signal transduction pathways (the PI3K-Akt and MAPK signaling pathways) and target genes (HSP90B1, MAPK13, MAPK9, PIK3AP1 and TLR4) related to GC resistance. Eight downregulated microRNAs were chosen for further validation in 76 serum samples. The results showed that miR-16-2-3p, miR-30e-3p, miR-32-5p, miR-642a-5p, miR-150-5p, and miR-224-5p were significantly downregulated in the GC-resistant group. Receiver operating characteristic analysis showed that the area under the curves (AUCs) for those microRNAs were 0.94, 0.93, 0.85, 0.87, 0.92, and 0.99, with specificities of 97.30%, 89.20%, 59.50%, 73.00%, 97.30%, and 97.30% and sensitivities of 74.40%, 84.60%, 97.40%, 92.30%, 66.70%, and 89.70%, respectively. Our study provides preliminary evidence for the pathogenic mechanism of GC resistance and shows that serum microRNAs might serve as biomarkers for GC resistance in IBD.
Keywords: Ulcerative colitis, glucocorticoid resistance, molecular mechanism, MicroRNA
Introduction
Inflammatory bowel disease (IBD) is a term used to describe chronic and non-specific inflammatory disorders of the intestine, including ulcerative colitis (UC) and Crohn’s disease (CD). IBD is difficult to cure, and the symptoms recur often. The incidence of this disease in China and other Eastern countries is increasing every year [1].
Despite newer therapies with highly effective biological agents, glucocorticoids (GCs) are still the most effective treatment for inducing rapid remission in moderate to severe active UC. In clinical settings, one-third of patients are not sensitive to GCs (i.e., they are GC-resistant). Studies have reported that GC therapy is ineffective in approximately 20-40% of UC cases. However, the complex pathogenic mechanisms of GC resistance in IBD have not been fully elucidated, and little is known about predicting resistance in IBD patients. In recent years, several classic studies have indicated that GC resistance may be attributed to mutations and polymorphisms of the MDR1 gene, which encodes the drug efflux pump P-glycoprotein (which extrudes GCs from cells and lowers the intracellular concentration of GCs), and the GC receptor (GR) gene NR3C1. GR is a key player in the activity of GCs, and its function is influenced by chaperone and co-chaperone proteins, such as Hsp90 and Hsp70. Furthermore, GR is required for proper ligand binding, receptor activation and transcription. Abnormalities in the proteins that constitute the GR hetero-complex may contribute to alteration of GC responsiveness [2]. The present study confirmed that several kinases that facilitate GR phosphorylation, including the c-Jun amino terminal kinase (JNK), serine/tyrosine kinase (MAPKs p38), and extracellular signal regulated protein kinase (ERK), are closely related to GC resistance [3]. In addition, the proportion of GR (GR-α/GR-β) plays an important role in sensitivity to GCs. Extensive evidence shows that the activities of histone deacetylase 2 (HDAC2) and mitogen-activated protein kinase phosphatase 1 are attenuated in GC-resistant patients [4]. Furthermore, the role of immune cells, such as T helper 17 (Th17) cells and regulatory T (Treg) cells, and cytokines, such as IL-2, IL-10, IL-17, and TNF-α, in GC resistance suggest they have functional significance [5].
MicroRNAs (miRNAs) are small (~22 nucleotides) non-coding RNA molecules that bind to and downregulate expression of target mRNAs by degrading and/or blocking translation. Additionally, they serve as fine-tuning regulators of diverse biological processes, including the development and function of the immune system, apoptosis, metabolism, and inflammation. Emerging data indicates that miRNAs are associated with drug metabolism and drug sensitivity. Several research studies have shown that miRNAs are involved in the modulation of the GC response in multiple diseases, such as hematologic neoplasms and airway hyperresponsiveness. Zhao JJ et al. found that the miR-221-222/PUMA/BAK/BAX pathway can abrogate dexamethasone resistance in multiple myeloma [6]. It was reported that miR-103 is upregulated in GC-sensitive leukemia cells treated by the hormone. Additionally, miR-103 expression in GC-resistant cells facilitates GC-induced apoptosis, marking miR-103 as a potential molecule for therapeutic intervention in ALL [7]. Therefore, the causal relationship between the function of GCs and the expression of miRNAs is perplexing. Another study indicated that miR-19a could be a potential molecular biomarker for predicting and monitoring resistance to FOLFOX chemotherapy regimens in advanced colorectal cancer patients [8]. However, the possible correlation between the miRNA expression and variability in GC-resistant and GC-sensitive patients in IBD has not yet been evaluated.
Therefore, in this study, we systematically performed comparative serum miRNA analyses in 9 GC-resistant patients and 9 GC-sensitive patients with UC using a PCR-microRNA microarray. After analysis with a series of bioinformatic methods, several potential signaling pathways and targets of GC responses were identified. Differential microRNA expression was then further validated in 76 samples by quantitative real-time PCR. Potential biomarkers were determined by receiver operating characteristic (ROC) curve analysis.
Patients and methods
Ethical considerations
The study and protocol were reviewed and approved by the Bioethics Committee of the First Affiliated Hospital of Kunming Medical University. The study was carried out in accordance with the approved guidelines. Written informed consent was obtained from all patients and their legal guardians. All procedures in this study were performed in compliance with the Helsinki Declaration and national laws.
Subjects and samples
All UC patients were recruited from the inpatient population at the First Affiliated Hospital of Kunming Medical University from January 2013 to June 2016. Patients were included if they met the following criteria: had an initial UC episode; were not taking immunosuppressive agents or biological agents; and were free from infectious diseases, neoplastic diseases and autoimmune diseases. The enrolled patients were born in Yunnan, China, and had lived there for >20 years. The diagnosis of UC was based on standard clinical, radiological, endoscopic and histological criteria, and GC resistance was defined by the 2012 ECCO guidelines for inflammatory bowel disease. GC resistance in IBD was considered when the disease remained at an active stage (Mayo score >3) after treatment with 0.75 mg/kg/d prednisone or a prednisone equivalent for more than 4 weeks. A UC disease activity evaluation was performed using a modified Mayo scoring system. Approximately 94 patients with UC were included in this study and were divided into GC-resistant (GRG) and GC-sensitive (GSG) groups after treatment with a standard dose of GCs. All serum samples collected before treatment were preserved at -80°C until use. Overall, 18 samples were obtained from 9 GC-resistant patients who were randomly divided into three groups and 9 GC-sensitive patients who were similarly divided into 3 groups. The samples were screened for disease-associated miRNAs by PCR-microRNA array analysis. Approximately 76 samples obtained from 37 GC-resistant patients and 39 GC-sensitive patients were used to ensure the validity of the results by quantitative reverse-transcription polymerase chain reaction (qRT-PCR).
RNA extraction and miRNA PCR array
Total RNA was extracted from serum samples using a TRIzol-based (Invitrogen, Carlsbad, CA, USA) isolation kit (Shanghai Kangcheng Biotechnology Company, Shanghai, China) according to the manufacturer’s protocol. The concentration and purity of RNA was analyzed with a NanoDrop-1000 (Thermo Scientific, Waltham, MA, USA). Then, approximately 20-25 ng RNA was reverse-transcribed into cDNA using a MicroRNA Reverse Transcription Kit and RT Primer Pools (Exiqon, Denmark) according to the manufacturer’s protocol. qRT-PCR was conducted on an ABI PRISM7900 system (Applied Biosystems, Foster, CA, USA) with a microRNA PCR Panel (V3.M) (Exiqon, Denmark) that detected 752 human microRNAs using a miRCURY LNA TM Universal RT microRNA PCR system and Ready-to-use human panel I+II (Exiqon, Kangcheng, China). Three small RNA (U6snRNA, SNORD38B, and SNORD49A) and two microRNA (miR-103a-3p and miR-423-5p) reference genes were included in the panel. Fold changes in miRNA expression between the two groups were calculated using the 2-ΔCT method.
Computational analysis
The data obtained from the microRNA PCR panel were analyzed with the GenEx qPCR analysis software (www.exiqon.com/mirna-pcr-analysis) by KangChen Bio-tech, Shanghai, PR China. Gene ontology (GO) analysis (http://www.geneontology.org) and pathway analyses (pathway identifiers used in KEGG) were performed to describe the roles of the differentially expressed miRNAs. Furthermore, Microcosm (http://www.ebi.ac.uk/enright-srv/microcosm/htdocs/targets/v5/), Miranda (http://www.microrna.org/microrna/home.do) and Targetscan (http://www.targetscan.org/vert_60/) were used to analyze target genes associated with glucocorticoid resistance for the selected miRNAs. miRNA and mRNA networks were drawn using Cytoscape.
Quantitative real-time PCR analysis
The differentially altered miRNAs in the serum of 37 GC-resistant patients and 39 GC-sensitive individuals were further validated by qRT-PCR. Total RNA was extracted from freshly frozen serum using TRIzol reagent (Qiagen, Hilden, Germany). The complementary DNA was synthesized using SYBR PrimeScript RT reagent kits (TaKaRa, Dalian, China) according to the manufacturer’s instructions. Quantitative real-time PCR was performed on an ABI prism 7900 HT sequence detector (Applied Biosystems, Foster City, CA, USA) using SYBR green methodology. Briefly, in a 20 µl reaction volume, 1 µl of cDNA was added to 10 µl of SYBR green Master mix (Darmstadt, Germany) and 0.3 μmol/L of each primer. The specific primers of miR-162-3p (#HmiRQP0228), miR-30e-3p (#HmiRQP0399), miR-32-5p (#HmiRQP0404), miR-425-5p (#HmiRQP0495), miR-642a-5p (#HmiRQP0752), miR-150-5p (#HmiRQP0210), miR-224-5p (#HmiRQP0343), miR-486-3p (#HmiRQP0522) and RNU6 (#HmiRQP9001) were purchased from GeneCopoeia (Guangzhou, China). All PCR reactions were conducted identically according to the following sequence: 95°C for 10 min; 95°C for 15 sec and 60°C for 30 sec for 40 cycles; 65°C for 5 sec; and 95°C. The fluorescence signal was normalized to unify the internal reference level, and the threshold cycle (CT) was set in the exponential amplification phase of the PCR. The relative expression levels of miRNAs were calculated based on the number of PCR cycles for miRNAs. The comparative 2-ΔCT method was used to calculate the relative expression level of each target gene with RNU6 as the internal control. Each sample was run in triplicate.
Statistics
All statistical analyses were performed using SPSS 21 software. The data are presented as the mean ± SD (x̅ ± s). The differences in miRNA concentrations between GRG and GSG were analyzed by Student’s t-test or Welch’s t-test for equal or unequal variances. For GO and pathway analysis, Fisher’s exact test was used to evaluate the significance of GO terms or pathway identifier enrichment in differentially expressed genes. P<0.05 or P<0.01 was considered statistically significant.
Results
Clinical parameters in UC patients
As shown in Table 1, there were no significant differences among the patient groups with respect to sex, age, Mayo score, EBV-DNA, and CMV-DNA (P>0.05).
Table 1.
Characteristics of the entire patient cohort
| Variable | Analysis procedure | Validated procedure | ||||
|---|---|---|---|---|---|---|
|
| ||||||
| GRG | GSG | P value | GRG | GSG | P value | |
| No. subjects | 9 | 9 | - | 37 | 39 | - |
| Sex (M/F) | 5/4 | 4/5 | 0.50a | 17/20 | 21/18 | 0.32a |
| Age (years) | 40.66±14.45 | 41.11±14.92 | 0.95b | 43.51±13.39 | 42.64±12.88 | 0.69b |
| Mayo score | 9.44±2.12 | 9.67±1.32 | 0.79b | 9.59±1.77 | 9.31±2.00 | 0.24b |
| EBV-DNA | 125.97±220.93 | 73.78±117.52 | 0.29b | 41.64±97.62 | 44.18±106.41 | 0.99b |
| CMV-DNA | 20.52±39.42 | 14.68±25.83 | 0.53b | 30.99±65.78 | 33.62±68.59 | 0.80b |
GRG: glucocorticoids resistant group, GSG: glucocorticoids sensitive group, M: male, F: female. Age, Mayo score, EBV-DNA and CMV-DNA were presented as mean ± standard deviation (x̅ ± s), EBV-DNA and CMV-DNA were E+2.
Pearson Chi-Square;
Independent sample-t test.
Profiling of serum miRNAs by microarrays
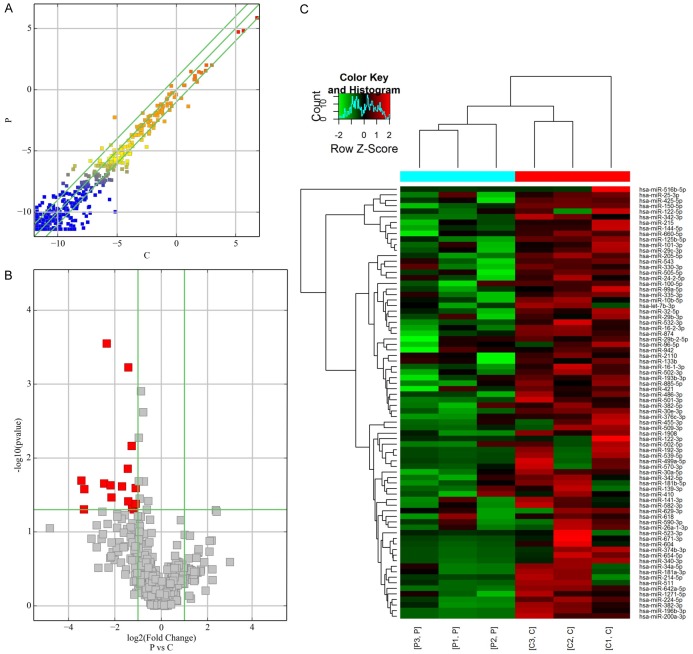
As shown in Figure 1A-C, 128 miRNAs were identified as differentially expressed between two groups with a fold change >2. Of these miRNAs, 50 were upregulated, and 78 were downregulated. We observed that only 16 miRNAs were significantly downregulated (P<0.05; 4.58-fold on average) in the GC-resistant group compared to the GC-sensitive group. The 50 upregulated miRNAs were not significantly different between the two groups (P>0.05). Hierarchical clustering analysis indicated that there were 128 differentially expressed miRNAs.
Figure 1.
miRNA profile of microarray data in the serum. A. Scatter-plot of miRNA expression. The miRNAs above the top green line and below the bottom green line indicate a more than 2.0-fold change between GC resistance and GC sensitive samples. B. Volcano plot of the differentially expressed miRNAs. The red points in the plot represent differentially expressed miRNAs with statistical significance. C. Hierarchical clustering shows a distinguishable miRNA expression profile between the two groups and homogeneity within groups. RNA was extracted from cartilage samples obtained from nine GC-resistant patients randomly divided into three groups (P: patient) and nine GC-sensitive patients similarly divided into three groups (C: control).
GO analysis and pathway analysis
In terms of GO analysis, upregulated transcripts were highly enriched for anatomical structure morphogenesis (ontology: biological process), intracellular (ontology: cellular component) and protein binding (ontology: molecular function). As shown in Figure 2A-C, downregulated transcripts were highly enriched for the regulation of cellular metabolic processes (ontology: biological process), intracellular part (ontology: cellular component), and protein binding (ontology: molecular function).
Figure 2.
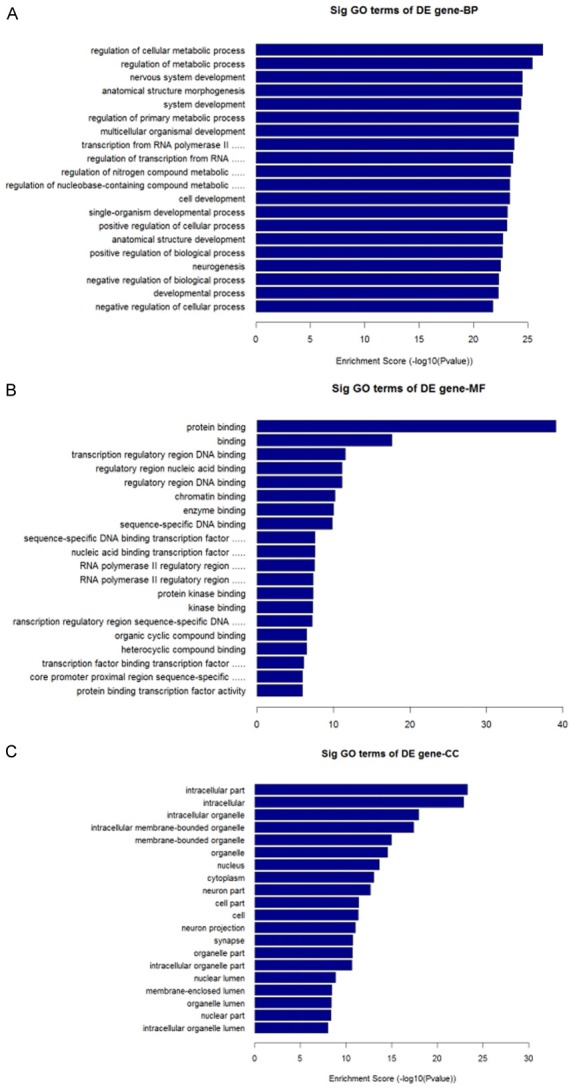
GO analysis of downregulated transcripts. A. Biological Process, BP. B. Cellular Component, CC. C. Molecular Function, MF.
Pathway analysis revealed that 43 pathways corresponded to upregulated transcripts, with the “neurotrophin signaling pathway” as the most represented pathway Figure 3A. With respect to downregulated transcripts, there were 69 pathways represented, and the most highly enriched was the “PI3K-Akt signaling pathway”. In particular, the “PI3K-Akt signaling pathway” and “MAPK signaling pathway”, which were associated with downregulated transcripts, were shown to be involved in GC mechanisms of action Figure 3B.
Figure 3.
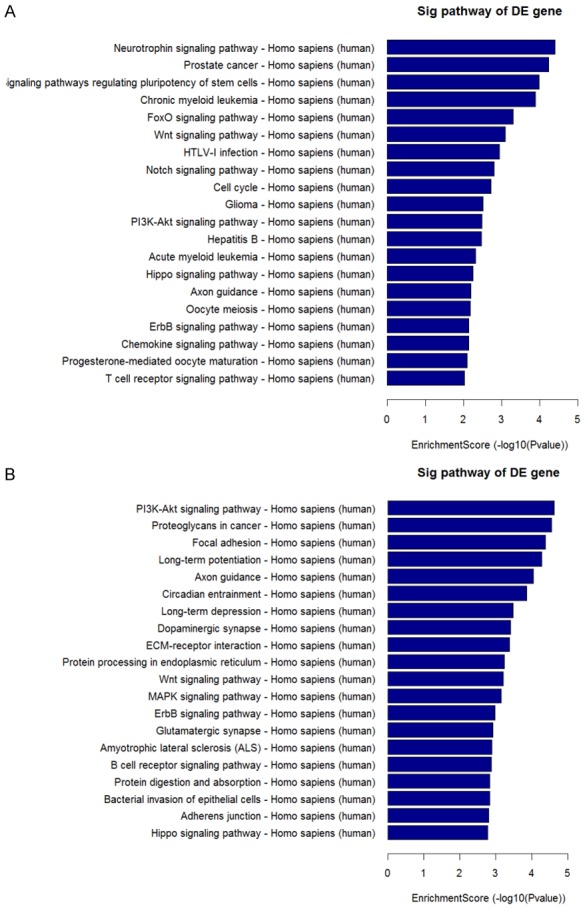
The result of pathway analysis. A. Pathways associated with upregulated transcripts. B. Pathways associated with downregulated transcripts.
miRNA target prediction
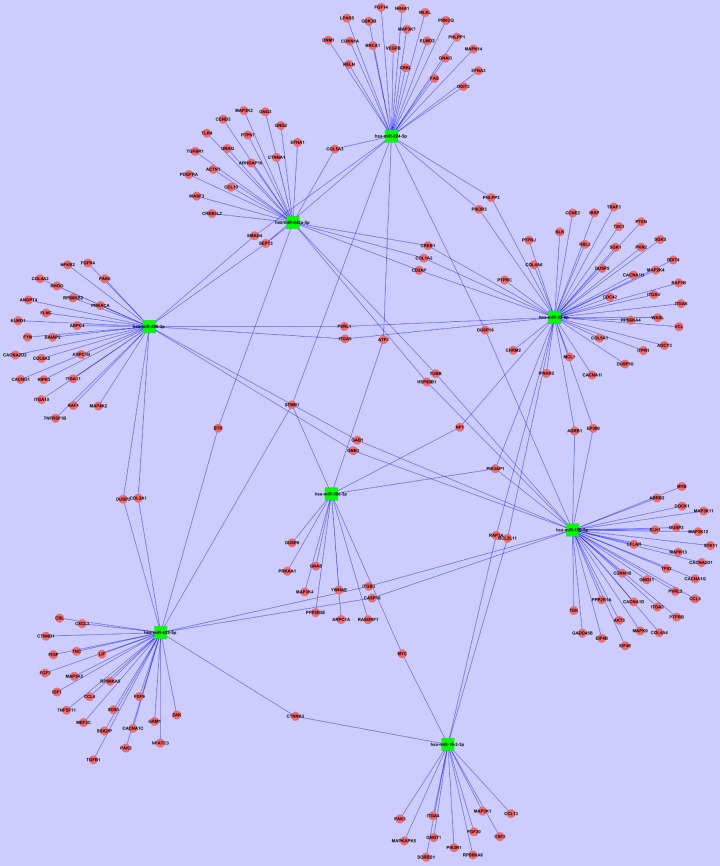
Based on the results of the miRNA PCR arrays and pathway analysis, we carefully selected 8 downregulated miRNAs (miR-16-2-3p, miR-30e-3p, miR-32-5p, miR-425-5p, miR-642a-5p, miR-150-5p, miR-224-5p and miR-486-3p) whose fold changes were >2.0 and P<0.05 for further analysis. The predicted target genes of these objective miRNAs are shown in Figure 4. The analysis found target genes related to the mechanisms of action of GCs, including HSP90B1, MAPK13, MAPK9, PIK3AP1, and TLR4.
Figure 4.
The predicted target genes of objective miRNAs. Green squares represent the objective miRNAs. Red circles represent the predicted target genes. Both objective miRNAs and predicted target genes were included in this network. Importantly, the network included a few genes related to GC resistance. Among them, HSP90B1 is a target gene for both miR-642a-5p and miR-150-5p. PIK3AP1 is a common target gene of miR-30e-3p, miR-32-5p, and miR-224-5p.
Validation of selected serum miRNAs
As shown in Figure 5, the expression levels of miR-16-2-3p, miR-30e-3p, miR-32-5p, miR-642a-5p, miR-150-5p, and miR-224-5p were significantly lower in GC-resistant patients than in GC-sensitive patients (P<0.05). The expression levels of miR-425-5p and miR-486-3p were not statistically different.
Figure 5.
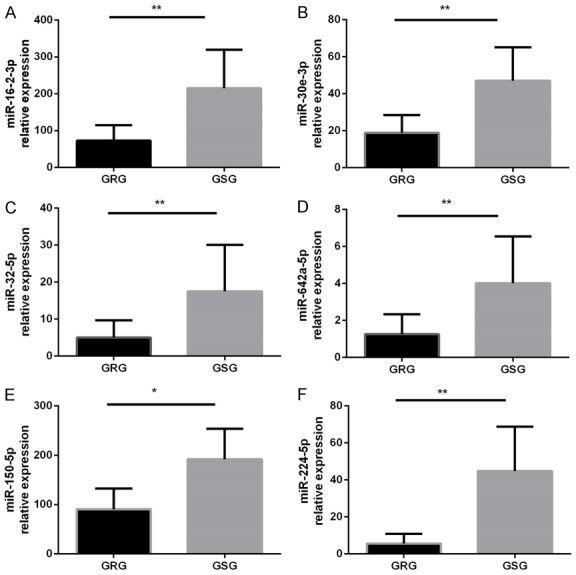
Further validation of miRNAs that are significantly downregulated in the serum. The miRNA levels were determined in the serum by qRT-PCR. GRG: GC-resistant group (n=37); GSG: GC-sensitive group (n=39). miRNA expression was normalized to baseline levels in each sample. *P<0.05, **P<0.01 versus the other groups. The data were expressed as the means ± SD.
Receiver operating characteristic (ROC) curve analysis
As shown in Figure 6, the ROC curve analysis showed that the area under the curves (AUC) for miR-16-2-3p, miR-30e-3p, miR-32-5p, miR-642a-5p, miR-150-5p, and miR-224-5p were 0.94 (95% confidence interval [CI] 0.891-0.986, P<0.0001), 0.93 (95% confidence interval [CI] 0.878-0.983, P<0.0001), 0.85(95% confidence interval [CI] 0.766-0.932, P<0.0001), 0.87 (95% confidence interval [CI] 0.794-0.950, P<0.0001), 0.92 (95% confidence interval [CI] 0.858-0.974, P<0.0001) and 0.99 (95% confidence interval [CI] 0.968-1.00, P<0.0001), with specificities of 97.30%, 89.20%, 59.50%, 73.00%, 97.30%, and 97.30% and sensitivities of 74.40%, 84.60%, 97.40%, 92.30%, 66.70%, and 89.70%, respectively.
Figure 6.
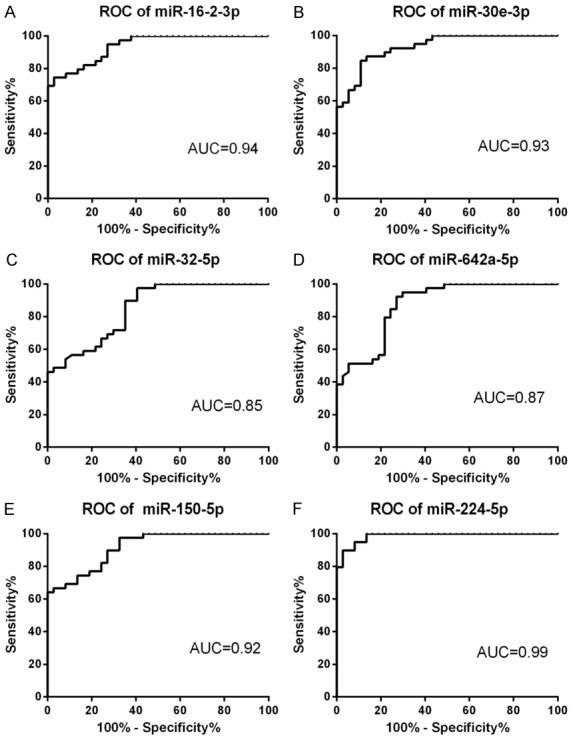
Receiver operating characteristics curve evaluation of serum microRNAs for predicting GC resistance in IBD: miR-16-2-3p (A), miR-30e-3p (B), miR-32-5p (C), miR-642a-5p(D), miR-150-5p (E) and miR-224-5p (F). AUC: area under the curve.
Discussion
In this study, we demonstrate distinct differences in miRNA expression profile from the sera from GC-resistant and GC-sensitive patients with UC in Yunnan, China. We chose patients in Yunnan, China, for the following reasons: (1) Growing evidence has indicated that different miRNAs are downregulated in different IBD populations, presumably owing to different environmental and genetic influences; (2) Yunnan is located in the southwest plateau of China where there are many ethnic minorities and high genetic diversity. Our previous epidemiological studies consistently established that the unique environment of this region plays an important role in modulating the subsequent risk of developing IBD [9]. Beginning with the population in this area, several novel mechanisms or potential biomarkers of GC resistance may be found.
We found 6 miRNAs (miR-16-2-3p, miR-30e-3p, miR-32-5p, miR-642a-5p, miR-150-5p, and miR-224-5p) that were significantly downregulated in GC-resistant patients. Among these miRNAs, miR-150-5p can sensitize the response to GC therapy in MM1S multiple myeloma cells by evoking GR-specific effects through indirect mRNA regulation of GR-interacting transcription factors, hormone receptors, and GR chaperones [10]. Another study indicated that miR-150 downregulation may contribute to pertuzumab resistance in ovarian cancer via the PI3K-Akt pathway [11]. Another study found that miR-642 increased cisplatin sensitivity in eight bladder cell lines [12]. Additionally, miR-224 was observed to promote the sensitivity of osteosarcoma cells to cisplatin [13]. Meanwhile, miR-224-5p was shown to function as an oncogene and induce platinum resistance in ovarian papillary serous carcinoma, which was at least partially promoted by downregulating PRKCD [14]. In addition, a study examining the drug sensitivity of Hsp90 inhibitors on human cancer cell lines showed that miR-16-2*, miR-30e*, miR-32 and 12 others significantly modulated miRNA and gene expression to affect drug responses [15]. These results show that downregulated miRNAs in our study might be closely related to GC resistance in IBD.
In addition, our analysis of target genes and the pathways of downregulated miRNAs included important genes related to GC-resistance, such as HSP90B1 (HSP90), MAPK13 (p38 MAPK), MAPK9 (JNK2), PIK3AP1 (PI-3Kδ), and TLR4. We also found several pathways related to the mechanism of GC resistance, such as the PI3K-Akt and MAPK signaling pathways.
HSP90, which is a 90-kDa molecular chaperone of GR, plays an important role in regulating GC effects. A previous study showed that steroid resistance in COPD is associated with impaired molecular chaperone Hsp90 expression by pro-inflammatory lymphocytes [16]. A C-terminal HSP90 inhibitor restored GC sensitivity in a mouse allograft model of Cushing’s disease [3]. Our study found that miR-642a-5p and miR-150-5p had the same target gene, HSP90B1. A recent study also found that HSP90 has the potential to assess the activity and prognosis of UC [17].
Many prior studies have shown that p38 MAPK and JNK, as mitogen-activated protein kinase (MAPK) family members, are key enzymes for GR phosphorylation and affect GC sensitivity. We found that all of the downregulated miRNAs could affect expression of various MAPK subtype target genes. For example, miR-150-5p clearly regulated the target genes for MAPK13 (p38 MAPK) and MAPK9 (JNK2).
Although there have been few studies investigating IBD, one found that p38 MAPK phosphorylation and membrane desmoglein-2 expression were reduced in colonic epithelial cells of GC-refractory patients [5]. The p38 MAPK-mediated synergism between IL-10 and GCs improved desmosome straightness and contributed to the recovery of intestinal epithelium and reduced contact between luminal antigens and lamina propria in UC. Another investigation showed that GCs regulated barrier function by increasing the activity of MAPK phosphatase-1 (MKP-1) and changing claudin expression. Barrier augmentation might potentially contribute to the therapeutic efficacy of GCs in IBD [18]. While an increasing number of studies concentrate on the blood and respiratory systems, these studies could provide a theoretical basis for understanding the mechanisms of GC resistance in IBD. For example, p38 MAPK inhibition could reverse GC insensitivity of peripheral blood mononuclear cells in patients with COPD by preventing phosphorylation of GR at serine 211 [19]. Specific gram-negative bacteria trigger TAK1/MAPK activation and induce GC resistance in asthma. Transforming growth factor-β-associated kinase-1 (TAK1) inhibition also restored cellular sensitivity to GCs [20]. This finding suggests that there is a strong relationship between the microbiome and GC resistance. Similarly, intestinal microflora abnormalities exist in patients with IBD, which might also be a cause of GC-resistance.
Similarly, we found that PIK3AP1, a common target gene for miR-16-2-3p, miR-30e-3p, miR-32-5p, and miR-224-5p, affected the activity of histone deacetylase and affected GC sensitivity. Related studies have mainly focused on respiratory system diseases, such as asthma and COPD. Theophylline, macrolide/fluoroketolide, solithromycin, and formoterol all could reverse GC insensitivity via PI3K-δ, and this effect may have occurred because the inhibition reduced the expression of impaired HDAC [21]. Despite these advancements, there have been no studies on GC resistance in IBD.
In addition, we detected an interesting target gene, TLR4, associated with miR-642a-5p. A study reported that miR-642a possibly binds to a genetic variation of rs11536889 that contributes to translational regulation of TLR4 [22]. Recently, research indicated that TLR4, which is a cell surface TLR, plays an essential role in the development of autoimmune diseases and offers multiple therapeutic targets. Kong et al. [23] found that GC resistance for TAK1 activation was associated with TLR4 engagement and might be an important contributor to GC resistance in inflammatory disorders. Although no research has shown that TLR4 is directly associated with GC resistance in IBD, it is well known that TLR4 initiates a variety of immune responses by detecting microbial products. A meta-analysis suggested that CMV-positive IBD patients have nearly double the risk of steroid resistance compared with CMV-negative IBD patients, indicating that CMV infection is a probable cause of steroid-resistant IBD [24]. Another study showed that beneficial bacteria, such as Lactobacillus rhamnosus and Bifidobacterium breve, have a similar effect on GCs, mainly by inducing regulatory T cells to secrete more IL-10 and by increasing CD4 T cell Foxp3 transcription. Additionally, these beneficial bacteria regulate the expression of Toll-like receptors (TLRs) and Nod-like receptors (NLRs), cytokines, and T cell transcription factors [25]. In dextran sulfate sodium-induced murine colitis, the anti-inflammatory action seems to operate via affecting the TLR4-mediated p38 mitogen-activated protein kinase pathway [26]. Thus, TLR4 might be an important factor causing GC resistance in IBD.
Finally, using ROC curve analysis, we found that miR-16-2-3p, miR-30e-3p, miR-32-5p, miR-642a-5p, miR-150-5p, and miR-224-5p displayed high specificity and sensitivity for diagnosis of GC resistance in IBD.
In conclusion, we demonstrate that miRNAs are downregulated in serum samples from GC-resistant patients with UC. These results, analyzed using bioinformatic methods and ROC curves, may provide a framework for understanding the mechanism of GC resistance and potential biomarkers for GC resistance. However, owing to the small sample size and lack of studies similar to our work, a well-designed, large-scale study with more samples is urgently needed to support our conclusions. Meanwhile, further research could reveal specific roles for miRNAs in GC resistance and could determine whether miRNAs can be developed as biomarkers and/or therapeutic targets for GC resistance in IBD.
Acknowledgements
This work was supported by the National Natural Science Foundation of China (81260074, 81160055); Applied Basic Research Key Projects of Yunnan Province (2016FA033); Social Development of Science and Technology Projects of Yunnan Province (2013CA021); Foundation of Yunnan Institute of Digestive Disease (2014NS123, 2016NS002, 2017NS004); Kunming Engineering Research Center of Digestive Disease (2015-3-A-02243).
Disclosure of conflict of interest
None.
References
- 1.Ye Y, Pang Z, Chen W, Ju S, Zhou C. The epidemiology and risk factors of inflammatory bowel disease. Int J Clin Exp Med. 2015;8:22529–22542. [PMC free article] [PubMed] [Google Scholar]
- 2.Scheschowitsch K, Leite JA, Assreuy J. New insights in glucocorticoid receptor signaling-more than just a ligand-binding receptor. Front Endocrinol (Lausanne) 2017;8:16. doi: 10.3389/fendo.2017.00016. [DOI] [PMC free article] [PubMed] [Google Scholar]
- 3.Lorén V, Cabré E, Ojanguren I, Domènech E, Pedrosa E, García-Jaraquemada A, Mañosa M, Manyé J. Interleukin-10 enhances the intestinal epithelial barrier in the presence of corticosteroids through p38 MAPK activity in Caco-2 monolayers: a possible mechanism for steroid responsiveness in ulcerative colitis. PLoS One. 2015;10:e0130921. doi: 10.1371/journal.pone.0130921. [DOI] [PMC free article] [PubMed] [Google Scholar]
- 4.Jiang Z, Zhu L. Update on molecular mechanisms of corticosteroid resistance in chronic obstructive pulmonary disease. Pulm Pharmacol Ther. 2016;37:1–8. doi: 10.1016/j.pupt.2016.01.002. [DOI] [PubMed] [Google Scholar]
- 5.Vazquez-Tello A, Halwani R, Hamid Q, Al-Muhsen S. Glucocorticoid receptor-beta up-regulation and steroid resistance induction by il-17 and il-23 cytokine stimulation in peripheral mononuclear cells. J Clin Immunol. 2013;33:466–78. doi: 10.1007/s10875-012-9828-3. [DOI] [PubMed] [Google Scholar]
- 6.Zhao JJ, Chu ZB, Hu Y, Lin J, Wang Z, Jiang M, Chen M, Wang X, Kang Y, Zhou Y, Ni Chonghaile T, Johncilla ME, Tai YT, Cheng JQ, Letai A, Munshi NC, Anderson KC, Carrasco RD. Targeting the miR-221-222/PUMA/BAK/BAX pathway abrogates dexamethasone resistance in multiple myeloma. Cancer Res. 2015;75:4384–4397. doi: 10.1158/0008-5472.CAN-15-0457. [DOI] [PMC free article] [PubMed] [Google Scholar]
- 7.Kfir-Erenfeld S, Haggiag N, Biton M, Stepensky P, Assayag-Asherie N, Yefenof E. MiR-103 inhibits proliferation and sensitizes hemopoietic tumor cells for glucocorticoid-induced apoptosis. Oncotarget. 2017;8:472–489. doi: 10.18632/oncotarget.13447. [DOI] [PMC free article] [PubMed] [Google Scholar]
- 8.Chen Q, Xia HW, Ge XJ, Zhang YC, Tang QL, Bi F. Serum miR-19a predicts resistance to FOLFOX chemotherapy in advanced colorectal cancer cases. Asian Pac J Cancer Prev. 2013;14:7421–7426. doi: 10.7314/apjcp.2013.14.12.7421. [DOI] [PubMed] [Google Scholar]
- 9.Niu J, Miao J, Tang Y, Nan Q, Liu Y, Yang G, Dong X, Huang Q, Xia S, Wang K, Miao Y. Identification of environmental factors associated with inflammatory bowel disease in a southwestern highland region of China: a nested case-control study. PLoS One. 2016;11:e0153524. doi: 10.1371/journal.pone.0153524. [DOI] [PMC free article] [PubMed] [Google Scholar]
- 10.Palagani A, Op de Beeck K, Naulaerts S, Diddens J, Sekhar Chirumamilla C, Van Camp G, Laukens K, Heyninck K, Gerlo S, Mestdagh P, Vandesompele J, Berghe WV. Ectopic microRNA-150-5p transcription sensitizes glucocorticoid therapy response in MM1S multiple myeloma cells but fails to overcome hormone therapy resistance in MM1R cells. PLoS One. 2014;9:e113842. doi: 10.1371/journal.pone.0113842. [DOI] [PMC free article] [PubMed] [Google Scholar]
- 11.Wuerkenbieke D, Wang J, Li Y, Ma C. MiRNA-150 downregulation promotes pertuzumab resistance in ovarian cancer cells via AKT activation. Arch Gynecol Obstet. 2015;292:1109–1116. doi: 10.1007/s00404-015-3742-x. [DOI] [PubMed] [Google Scholar]
- 12.Nordentoft I, Birkenkamp-Demtroder K, Agerbæk M, Theodorescu D, Ostenfeld MS, Hartmann A, Borre M, Ørntoft TF, Dyrskjøt L. MiRNAs associated with chemo-sensitivity in cell lines and in advanced bladder cancer. BMC Med Genomics. 2012;5:40. doi: 10.1186/1755-8794-5-40. [DOI] [PMC free article] [PubMed] [Google Scholar]
- 13.Geng S, Gu L, Ju F, Zhang H, Wang Y, Tang H, Bi Z, Yang C. MicroRNA-224 promotes the sensitivity of osteosarcoma cells to cisplatin by targeting Rac1. J Cell Mol Med. 2016;20:1611–1619. doi: 10.1111/jcmm.12852. [DOI] [PMC free article] [PubMed] [Google Scholar] [Retracted]
- 14.Zhao H, Bi T, Qu Z, Jiang J, Cui S, Wang Y. Expression of miR-224-5p is associated with the original cisplatin resistance of ovarian papillary serous carcinoma. Oncol Rep. 2014;32:1003–1012. doi: 10.3892/or.2014.3311. [DOI] [PubMed] [Google Scholar]
- 15.Yang DS. Novel prediction of anticancer drug chemosensitivity in cancer cell lines: evidence of moderation by microRNA expressions. Conf Proc IEEE Eng Med Biol Soc. 2014;2014:4780–4786. doi: 10.1109/EMBC.2014.6944693. [DOI] [PubMed] [Google Scholar]
- 16.Hodge G, Roscioli E, Jersmann H, Tran HB, Holmes M, Reynolds PN, Hodge S. Steroid resistance in COPD is associated with impaired molecular chaperone Hsp90 expression by pro-inflammatory lymphocytes. Respir Res. 2016;17:135. doi: 10.1186/s12931-016-0450-4. [DOI] [PMC free article] [PubMed] [Google Scholar]
- 17.Abou El Azm AR, Yousef M, Kobtan A, Awad A, Elkassas G, Elfert A. Colonic mucosal expression of heat-shock proteins may have a potential prognostic value in ulcerative colitis. Arab J Gastroenterol. 2015;16:20–24. doi: 10.1016/j.ajg.2015.02.005. [DOI] [PubMed] [Google Scholar]
- 18.Fischer A, Gluth M, Weege F, Pape UF, Wiedenmann B, Baumgart DC, Theuring F. Glucocorticoids regulate barrier function and claudin expression in intestinal epithelial cells via MKP-1. Am J Physiol Gastrointest Liver Physiol. 2014;306:G218–228. doi: 10.1152/ajpgi.00095.2013. [DOI] [PubMed] [Google Scholar]
- 19.Khorasani N, Baker J, Johnson M, Chung KF, Bhavsar PK. Reversal of corticosteroid insensitivity by p38 MAPK inhibition in peripheral blood mononuclear cells from COPD. Int J Chron Obstruct Pulmon Dis. 2015;10:283–291. doi: 10.2147/COPD.S72403. [DOI] [PMC free article] [PubMed] [Google Scholar]
- 20.Goleva E, Jackson LP, Harris JK, Robertson CE, Sutherland ER, Hall CF, Good JT Jr, Gelfand EW, Martin RJ, Leung DY. The effects of airway microbiome on corticosteroid responsiveness in asthma. Am J Respir Crit Care Med. 2013;188:1193–1201. doi: 10.1164/rccm.201304-0775OC. [DOI] [PMC free article] [PubMed] [Google Scholar]
- 21.Matsumura Y. Inflammatory cellular phenotypes and molecular mechanisms of glucocorticoid resistance in patients with bronchial asthma. Antiinflamm Antiallergy Agents Med Chem. 2013;12:189–200. doi: 10.2174/18715230113129990010. [DOI] [PubMed] [Google Scholar]
- 22.Sato K, Yoshimura A, Kaneko T, Ukai T, Ozaki Y, Nakamura H, Li X, Matsumura H, Hara Y, Ogata Y. A single nucleotide polymorphism in 3’-untranslated region contributes to the regulation of Toll-like receptor 4 translation. J Biol Chem. 2012;287:25163–25172. doi: 10.1074/jbc.M111.338426. [DOI] [PMC free article] [PubMed] [Google Scholar]
- 23.Kong F, Laryea G, Liu Z, Bhattacharyya S. Transforming growth factor-β-activated kinase 1 resistance limits glucocorticoid responsiveness to Toll-like receptor 4-mediated inflammation. Immunology. 2015;145:136–149. doi: 10.1111/imm.12434. [DOI] [PMC free article] [PubMed] [Google Scholar]
- 24.Wu XW, Wu L, Ji HZ, Wang FY. Relationship between cytomegalovirus infection and steroid resistance in inflammatory bowel disease: a meta-analysis. Dig Dis Sci. 2015;60:3203–3208. doi: 10.1007/s10620-015-3733-6. [DOI] [PMC free article] [PubMed] [Google Scholar]
- 25.Sagar S, Morgan ME, Chen S, Vos AP, Garssen J, van Bergenhenegouwen J, Boon L, Georgiou NA, Kraneveld AD, Folkerts G. Bifidobacterium breve and Lactobacillus rhamnosus treatment is as effective as budesonide at reducing inflammation in a murine model for chronic asthma. Respir Res. 2014;15:46. doi: 10.1186/1465-9921-15-46. [DOI] [PMC free article] [PubMed] [Google Scholar]
- 26.Lin S, Li Y, Shen L, Zhang R, Yang L, Li M, Li K, Fichna J. The anti-inflammatory effect and intestinal barrier protection of HU210 differentially depend on TLR4 signaling in dextran sulfate sodium-induced murine colitis. Dig Dis Sci. 2017;62:372–386. doi: 10.1007/s10620-016-4404-y. [DOI] [PubMed] [Google Scholar]


