Abstract
Ketamine abuse has dramatically increased in recently years. With the widely application of ketamine, its side effects, especially cystitis induced by long-term use, have attracted more and more attention from the public. In the present study, we aimed to explore the potential generative mechanism of ketamine-induced cystitis by determining the endogenous metabolites at different time points after ketamine treatment. Body weight, bladder/body coefficient, urinary frequency, urinary potassium, serum IL-6, and TNF-α were determined at different time points after ketamine treatment. H&E staining was used to observe the changes of histopathology. Metabonomics was performed to determine the changes of endogenous metabolites. After 12 weeks of treatment, obvious inflammatory reaction was noticed in the KET group; the body weight and urinary potassium of the KET group were significantly lower than the NS group (P < 0.05) and other factors, such as urinary frequency, bladder/body coefficient, serum TNF-α and IL-6 were higher than the NS group (P < 0.05). A total of 30, 28, and 32 significantly changed metabolites were identified at the 1st week, 4th week and 12th week, respectively. Metabolic pathway analysis showed that different metabolic pathways were affected during the treatment process. Linoleic acid metabolism, beta-alanine metabolism, glyoxylate and dicarboxylate metabolism were only affected following long-term administration of ketamine. Those metabolic pathways may have a close relationship with cystitis induced by ketamine.
Keywords: Metabolomics, ketamine, cystitis, GC-MS
Introduction
Ketamine, a potent non-competitive receptor antagonist of N-methyl-D-aspartate (NMDA) that was first synthesized in 1962 and applied to humans in 1965 [1]. Ketamine is the only intravenous anesthetic drug with sedative, analgesic, and anesthetic effects [2]. In recent years, studies also demonstrate that ketamine has anti-depressive [3,4] and brain protective effects [5]. As every coin has two sides, ketamine exhibited hallucinogenic and addictive characteristics has been abused in entertainment. According to one report, ketamine abuse has dramatically increased in recently years [6]. With the wide application of ketamine, its side effects have attracted more and more attention from the public.
Bladder damage is one of the side effects of ketamine. In 2007, Shahani et al. firstly reported that long-term use of ketamine can cause urinary system injury, especially damage of bladder [7]. Since then, more and more studies have been carried out to investigate this problem [8,9]. Cystitis induced by ketamine gradually attracted people’s attention. The main clinical manifestations of ketamine-induced cystitis are lower urinary tract symptoms such as dysuria, urinary incontinence, hematuria, bladder wall thickening, and a reduced capacity of the bladder [10,11]. Although studies have proven that ketamine can cause urinary system injury, the mechanism of toxicity is still under-studied, especially regarding the direct toxic effects of ketamine and its metabolites [12,13], as well as bladder barrier dysfunction caused by long-term use of ketamine [14-16] and the neurotoxic effects [17,18].
Furthermore, cystitis is likely to be a complicated dysfunction caused by multiple factors. Metabonomics, first proposed by Nicholson, is a systems level approach for studying endogenous metabolites. This method can not only diagnose and monitor diseases, but also provide new thoughts for exploring mechanisms by identifying specific metabolites and metabolic pathways related to diseases [19]. In our previous work, we have studied the urinary metabolomics of Sprague-Dawley (SD) rats and found some metabolites were significantly changed after short-term administration of ketamine [20]. In the present study, we studied the long-term bladder toxicity of ketamine using a method of metabonomics to determine the dynamic changes of endogenous metabolites. This work helps to explain the generative mechanism of cystitis associated with ketamine.
Materials and methods
Animal treatment
Male adult SD rats were purchased from the Experimental Animal Center of DaShuo Co.Ltd (Chengdu, Sichuan, China) and kept in an animal facility (with temperature of 23 ± 2°C, relative humidity of 50 ± 10%, 12/12 h light-dark cycle, with freely available water and food) for one week. All animal care and experimental procedures were conducted in according to the National Institutes of Health Guide for the Care and Use of Laboratory Animals. All rats were randomly divided into two groups: the normal saline (NS) group and the ketamine (KET) group (n = 24 per group). Each group was subdivided into three subgroups based on the time of ketamine treatment (1 week, 4 weeks and 12 weeks). Animals in the KET group were intraperitoneally injected with 50 mg/kg ketamine (provided by the Sichuan Public Security Department) each day for scheduled days. The NS groups received same volume of normal saline. All rats were weighed weekly to adjust the quantity of ketamine administrated.
Urinary frequency and sample collection
Urinary frequency was determined by housing the rats individually in metabolic cages as published [14]. Micturition was recorded for 2 h biweekly, and the number of urinations was counted based on the blue spots observed. During the experiment, 8 rats from each group were sacrificed at the 1st week, 4th week and 12th week, respectively. Blood was drawn from the heart and serum was then prepared by centrifugation at 3000 × g for 10 min at 4°C. The bladder was removed and weighed to calculate bladder/body coefficient by the following equation: Bladder/body coefficient = bladder weight/body weight * 100.
Determination of urinary potassium, serum IL-6, and TNF-α
Urinary potassium was measured by automated chemical analyzer. Serum IL-6 and TNF-α were determined by rat IL-6 and TNF-α ELISA kits (KeyGEN BioTECH, JiangSu, China) according to the standard procedures provided by the manufacturer, respectively.
Histopathologic analysis
Bladder tissues were fixed in 4% phosphate-buffered paraformaldehyde, dehydrated in serial alcohol concentrations, embedded and sliced. Slices were then subjected to routine hematoxylin and eosin (H&E) staining. Stained sections were observed by a light microscope at 200 × magnification (Olympus BX53, Tokyo, Japan).
Metabolomic research
Sample preparation
Frozen urine samples were thawed and pretreated by a method similar to a previous report with only slight modifications [21]. First, 50 μL urine was put into an Eppendorf tube; 150 μL of acetonitrile (FuYu Chemical Reagent, Tianjin, China) was added to precipitate protein; the mixture was vortexed for 2 min and centrifuged at 12000 × g for 10 min at 4°C. Second, 100 μL of the supernatant was transferred to a GC vial, concentrated and lyophilized for 12 h. Next, 30 μL methoxyamine hydrochloride (Sigma-Aldrich, St.Louis, USA) in pyridine (FuYu Chemical Reagent, Tianjin, China) solution was added to the vial, mixed for 1 min and finally placed in the dark for 16 h of oximation at 16°C. After completing oximation, 30 μL of BSTFA with 1% TMCS (Sigma-Aldrich, St.Louis, USA) was quickly added, vortexed for 5 min and incubated at 70°C for silanization for 1 h. Then, 100 μL methyl stearate (Sigma-Aldrich, St.Louis, USA) (10 μg/mL), as internal standard, was added, the mixture was vortexed for 2 min and centrifuged for 15 min to collect approximately 100 μL of the supernatant to perform GC-MS analysis.
GC-MS analysis
Processed samples were detected and analyzed with an Agilent 7890A/5975C GC/MS instrument (Agilent, CA, USA). The specific parameters were as follows: Column-DB-5 MS, 0.25 mm × 30 m × 0.25 μm; sample volume: 1 μL; Carrier gas: Helium; flow rate: 1.0 mL/min; Inlet temperature: 250°C; Split ratio: 5:1; Temperature program: initial temperature was 60°C, held for 1 minute, then 10°C/min to 325°C until the last 10 minutes; and MS interface temperature: the temperature of the ion source and quadrupole temperatures was 280°C, 230°C and 150°C, respectively.
Data collection, processing and statistical analysis
The GC-MS spectrum data was confirmed by the automated mass spectral deconvolution and identification system (AMDIS) software and the National Institute of Standards and Technology (NIST) mass spectral library. The peak area of each metabolite was normalized (area normalization method: The ratio of each peak area to total peak area). Subsequently, the data were imported to the SIMCA-P v11.5 software (Umetrics AB, Sweden) for partial least squares-discriminant analysis (PLS-DA). Characteristic metabolites were identified through the importance of variables (VIP) > 1 and the Kruskal-Wallis test (P < 0.05). Pathway analysis was performed with the Metabo Analyst 3.0 (http://www.metaboanalyst.ca/MetaboAnalyst) [22].
Statistical analysis
All the data from the body weights, urinary frequency, bladder/body coefficient, urinary potassium, serum TNF-α, and IL-6 are expressed as mean ± SD. Independent sample t-tests were used to analyze all the data with the SPSS 19.0 software (SPSS, Inc., Chicago, IL, USA). Statistical significance was set at P < 0.05.
Results
Behavior and body weight were altered after long-term administration of ketamine
During the entire treatment duration, rats in the NS group displayed normal feeding and drinking, normal activity, and color gloss. Rats in the KET group, especially after 12 weeks treatment, displayed messy and withered hair, decreased activity, and listlessness. The body weights of both groups were all increased along with the treatment, however the growth trend of the NKT group was slower than the NS group. After 12 weeks, the body weight of the KET group was significantly lower than the NS group (P < 0.05) (Figure 1).
Figure 1.
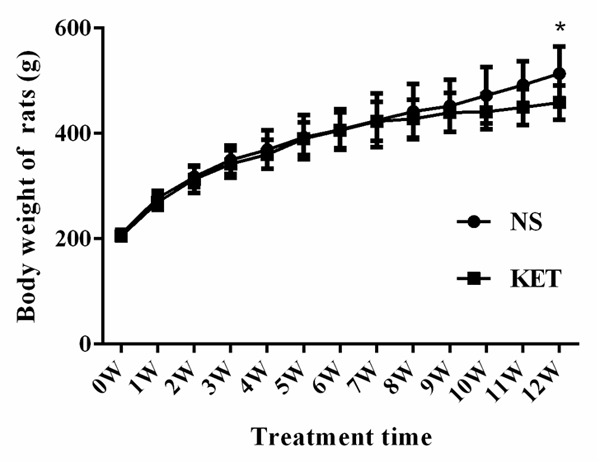
Body weights were decreased after long-term administration of ketamine vs. the NS group, *P < 0.05.
Urinary frequency and bladder/body coefficient were increased after long-term administration of ketamine
The results of urinary frequency were seen from Figure 2A-C. At the early stage of treatment (0-6 Weeks treatment), rats in the NS group and the KET group had almost the same urinary frequency (P > 0.05), but after 8 weeks, rats in the KET group had significantly increased urinary frequency compared with the NS group (P < 0.05). Bladder/body coefficient only showed a significant difference at the 12th week, which indicated that bladder tissues grew big and heavy with long-term use of ketamine (Figure 2D).
Figure 2.
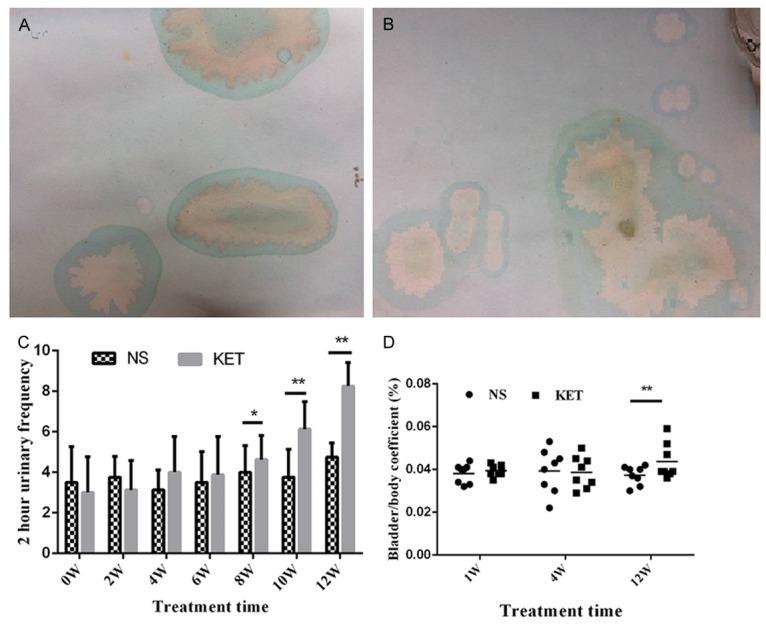
Urinary frequency and bladder/body coefficient were increased after long-term administration of ketamine. A: Representative urine spots of the NS group after 12 weeks treatment, 2 h urinary frequency was about 3 times; B: Representative urine spots of the KET group after 12 weeks treatment, 2 h urinary frequency was about 10 times; C: 2 h urinary frequency of the NS group and the KET group during treatment; D: Bladder/body coefficient of the NS group and the KET group during treatment. vs. the NS group, *P < 0.05; **P < 0.01.
Long-term administration of ketamine decreased urinary potassium and increased serum TNF-α and IL-6
As shown in Figure 3, on the intra-group level, urinary potassium, serum TNF-α and IL-6 didn’t show significant changes along with treatment in the NS group (12th week vs. 1st week or 4th week; P > 0.05); urinary potassium was significantly decreased while serum TNF-α and IL-6 were significantly increased after long-term administration of ketamine in the KET group (12th week vs. 1st week or 4th week; P < 0.05); On the inter-group level, when compared with the NS group, urinary potassium in the KET group was almost same at 1st week and 4th week (P > 0.05) and significantly decreased at 12th week (P < 0.05); serum TNF-α in the KET group was almost same at 1st week and 4th week (P > 0.05) and significantly increased at 12th week (P < 0.01); serum IL-6 didn’t changed at 1st week (P > 0.05) and significantly increased at 4th week (P < 0.05) and 12th week (P < 0.01).
Figure 3.
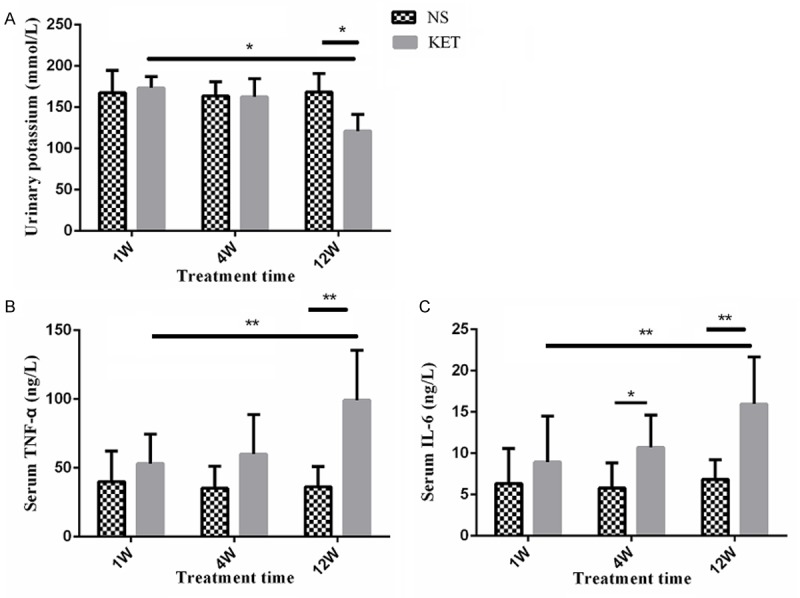
Urinary potassium, serum TNF-α, and IL-6 were altered after long-term administration of ketamine. A: Urinary potassium of the NS group and the KET group during treatment. Urinary potassium was almost unchanged in the NS group while significantly deceased in the KET group after 12 weeks treatment; B: Serum TNF-α of the NS group and the KET group during treatment. Serum TNF-α was almost unchanged in the NS group while significantly increased in the KET group after 12 weeks treatment; C: Serum IL-6 of the NS group and the KET group during treatment. Serum IL-6 was almost unchanged in the NS group while significantly increased in the KET group after 4 weeks treatment. *P < 0.05; **P < 0.01.
Histopathologic analysis
Bladder pathologic changes were shown in Figure 4. From Figure 4A, 4C and 4E, it is clear that the NS group showed no abnormality at all three time points, while the KET group had a small amount of inflammatory cells infiltrated into the bladder the 1st week (Figure 4B). At the 4th week, the bladder epithelial showed necrosis and shedding, accompanied by microvascular congestion and bleeding (Figure 4D) and at 12th week, the bladder epithelial cells appeared with large amounts of red blood cells and with a large number of infiltrating neutrophils (Figure 4F).
Figure 4.
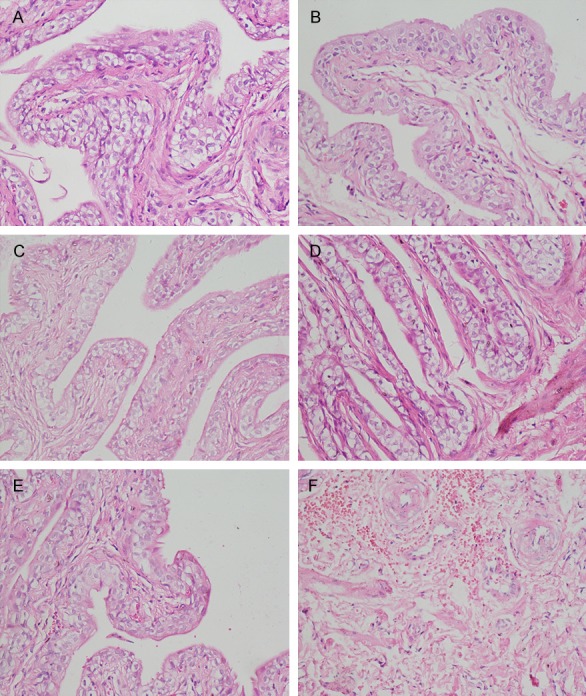
Representative H&E staining (× 200). A: NS group at 1st week. No abnormality was observed; B: KET group at 1st week. Only a small amount of inflammatory cells infiltrated the bladder; C: NS group at 4th week. No abnormality was observed; D: KET group at 4th week. Most of the bladder epithelial showed necrosis and shedding, accompanied by microvascular congestion and bleeding; E: NS group at 12th week. No abnormality was observed; F: KET group at 12th week. The bladder epithelial cells appeared to include large amounts of red blood cells and with a large number of neutrophils infiltration.
Metabolomic research
PLS-DA analysis and characteristic metabolite identification
PLS-DA, a method possessing the similar principle with PCA, was used to observe the samples distribution. As shown in Figure 5A-C, the PLS-DA score plot demonstrated notable distribution between the NS and the KET group at 1st week (R2Y = 99.1% and Q2 = 94.8%), 4th week (R2Y = 99.4% and Q2 = 99.5%) and 12th week (R2Y = 99.3% and Q2 = 95.2%), respectively. On the basis of the VIP threshold (VIP > 1) and P < 0.05, characteristic metabolites between the NS group and the KET group at different time points were selected for further analysis. Finally, a total of 30, 28, and 32 metabolites had identified at the 1st week, 4th week and 12th week, respectively (Table 1).
Figure 5.
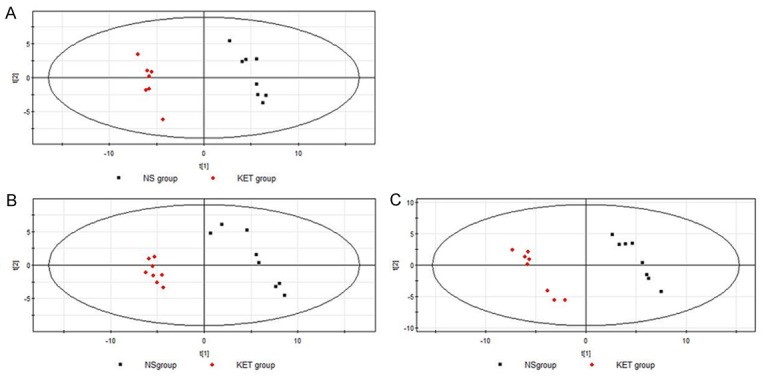
PLS-DA score plots of urine from rats at different time points after treatment. A: 1st week after treatment; B: 4th week after treatment; C: 12th week after treatment.
Table 1.
Characteristic metabolites between the NS group and the KET group at different time points after treatment
| 1W | 4W | 12W | |||
|---|---|---|---|---|---|
|
| |||||
| RT | Metabolites | RT | Metabolites | RT | Metabolites |
| 5.755 | Propionic acid | 5.962 | Butyric acid | 5.755 | Propionic acid |
| 5.913 | Lactic acid | 6.157 | 2-ketobutyric acid | 6.157 | 2-ketobutyric acid |
| 6.157 | 2-ketobutyric acid | 8.19 | Malonic acid | 9.408 | Phenylacetic acid |
| 7.192 | Propylamine | 9.627 | Succinic acid | 9.505 | 3-Aminoisobutyric acid |
| 9.505 | 3-Aminoisobutyric acid | 10.187 | Fumaric acid | 10.918 | Butyric acid |
| 9.931 | Uracil | 10.918 | Butyric acid | 11.149 | Beta-Alanine |
| 10.053 | Acetic acid | 11.356 | Glycine | 11.356 | Glycine |
| 10.187 | Fumaric acid | 12.038 | Erythritol | 12.135 | Salicylic acid |
| 10.854 | Malonic acid | 12.318 | Pyroglutamic acid | 12.574 | Creatinine |
| 10.918 | Butyric acid | 12.476 | Cinnamic acid | 12.781 | 3-Hydroxybutyric acid |
| 11.356 | Glycine | 12.574 | Creatinine | 13.377 | 2-isopropylmalic acid |
| 11.539 | Cytosine | 12.781 | 3-Hydroxybutyric acid | 13.548 | L-Glutamic acid |
| 12.038 | Erythritol | 13.377 | 2-isopropylmalic acid | 13.743 | 4-hydroxyphenylacetic acid |
| 12.318 | Pyroglutamic acid | 13.548 | L-Glutamic acid | 14.425 | Suberic acid |
| 12.476 | Cinnamic acid | 14.473 | Xylitol | 14.473 | Xylitol |
| 12.574 | Creatinine | 14.692 | Fucose | 14.632 | Dulcite |
| 12.671 | Glutaric acid | 15.837 | Myoinositol | 14.692 | Fucose |
| 13.077 | 3-Hydroxyphenylacetic acid | 15.874 | S-carboxymethylcysteine | 15.715 | Citric acid |
| 13.548 | L-Glutamic acid | 16.336 | Ascorbic acid | 16.008 | Hippuric acid |
| 14.425 | Suberic acid | 16.519 | Mannose | 16.336 | Ascorbic acid |
| 14.692 | Fucose | 16.787 | Glucuronic acid | 16.519 | Mannose |
| 14.96 | Trans-Aconitic acid | 16.86 | Mannitol | 16.787 | Glucuronic acid |
| 15.496 | Azelaic acid | 16.969 | Pyridoxine | 17.469 | Pantothenic acid |
| 15.837 | Myoinositol | 17.469 | Pantothenic acid | 17.505 | Adenosine diphosphate ribose |
| 16.008 | Hippuric acid | 17.822 | Palmitic acid | 18.504 | Uric acid |
| 16.336 | Ascorbic acid | 19.77 | Oleic acid | 19.198 | 7-Methylguanine |
| 16.969 | Pyridoxine | 21.012 | Arachidonic acid | 19.247 | Linoleic acid |
| 18.504 | Uric acid | 23.703 | Benzoic acid | 20.72 | Purine riboside |
| 20.574 | Uridine | 21.012 | Arachidonic acid | ||
| 21.012 | Arachidonic acid | 21.28 | Oleic acid | ||
| 21.816 | 5-Methyluridine | ||||
| 26.638 | Cholesterol | ||||
Note: RT: Retention time.
Metabolic pathway analysis
Pathway analysis of characteristic metabolites was analyzed with MetaboAnalyst 3.0. The impact value threshold calculated from pathway topology analysis was set to 0.1. Potential target pathways were filtered out above this threshold. At the 1st week, different metabolites between the NS group and the KET group were involved in D-glutamine and D-glutamate metabolism (impact value = 1.0), arachidonic acid metabolism (impact value = 0.33), glycine, serine and threonine metabolism (impact value = 0.29), alanine, aspartate and glutamate metabolism (impact value = 0.26) and Inositol phosphate metabolism (impact value = 0.14). At the 4th week, different metabolites were involved in D-glutamine and D-glutamate metabolism (impact value = 1.0), ascorbate and aldarate metabolism (impact value = 0.40), arachidonic acid metabolism (impact value = 0.35), glycine, serine and threonine metabolism (impact value = 0.31), alanine, aspartate and glutamate metabolism (impact value = 0.26) and Inositol phosphate metabolism (impact value = 0.15). At the 12th week, different metabolites were involved in linoleic acid metabolism (impact value = 1.00), beta-alanine metabolism (impact value = 1.00), ascorbate and aldarate metabolism (impact value = 0.44), arachidonic acid metabolism (impact value = 0.40), alyoxylate and dicarboxylate metabolism (impact value = 0.33), alycine, serine and threonine metabolism (impact value = 0.30) and alanine, aspartate and glutamate metabolism (impact value = 0.29). From the results we can see that the 1st week and 4th week shared the most similar metabolic pathways, such as D-glutamine and D-glutamate metabolism, arachidonic acid metabolism, glycine, serine, and threonine metabolism. Alanine, aspartate, and glutamate metabolism and inositol phosphate metabolism were also altered. Ascorbate and aldarate metabolism was affected after 4 weeks treatment. After 12 weeks treatment, different metabolic pathways such as linoleic acid metabolism, beta-alanine metabolism and glyoxylate and dicarboxylate metabolism were affected. Those changes were not detected at the 1st week and 4th week analysis. The major metabolic pathways affected are shown in Figure 6.
Figure 6.
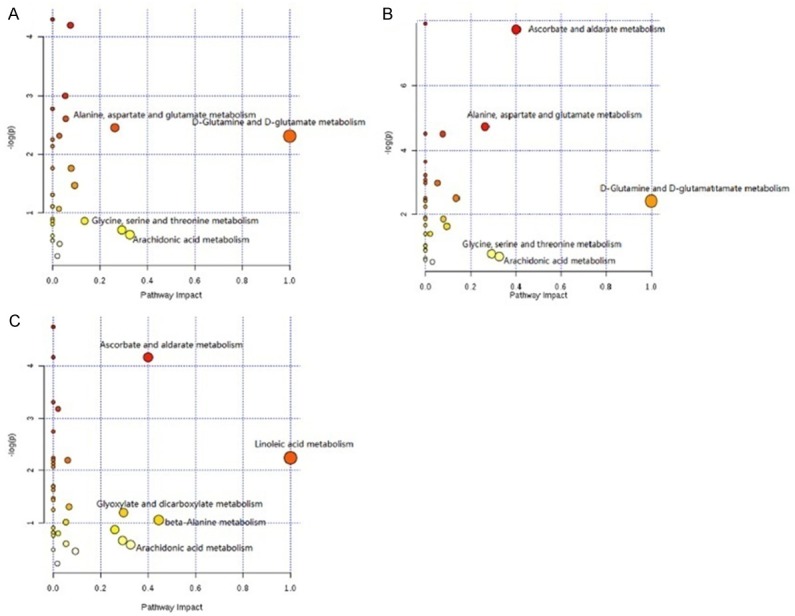
Metabolic pathway analysis of different metabolites between the NS group and the KET group at different time points after treatment. A: 1st week; B: 4th week; C: 12th week.
Discussion
In this study, rat model was used to determine the effects and possible mechanism of ketamine. From the results we observed, no significant change was found between the NS group and the KET group regarding to the body weight, bladder/body coefficient, urinary frequency, urinary potassium, serum TNF-α and IL-6, as well as the H&E staining results in a short period of treatment; However, after a long-term duration of treatment, those observation indexes were significantly changed and bladder damage was successfully induced in rats. Metabolomic study showed that different metabolic pathways were affected during the treatment process.
Body weight, behavior and bladder/body coefficient were affected by long-term ketamine abuse. In our study, the body weight of rats in the NS group and the KET group exhibited non-significant difference after 11 weeks treatment. At the 12th week, the body weight of rats in the KET group was significantly lighter than the NS group. This was consistent with one report that claimed long-term ketamine abuse caused weight loss [14]. One of the reasons behind this phenomenon may be that long-term use of ketamine can lead to abnormal emotion such as fear, depression, anxiety, long time stress, which in turn impacted the body’s digestion and absorption function and results in weight loss [23]. Unlike the body weight, bladder/body coefficients of rats in the KET group were increased after long-term use of ketamine; this is because that ketamine can increase the bladder weight of rats [24].
Our experiment also demonstrated that urinary frequency was increased after long-term administration of ketamine. This may be associated with a decrease in bladder volume and voiding interval, and progressive decrease in bladder function [25]. Studies have shown that bladder epithelial dysfunction may lead to decreased urinary potassium [26,27], which makes urinary potassium a reliable parameter to evaluate the bladder epithelial function. In the present study, we found the urinary potassium was significantly lower in the KET group at 12th week which indicated that long-term use of ketamine could cause bladder epithelial dysfunction. The decreased concentration of urinary potassium may be one of the reasons for frequent urination, urgency and dysuria [27].
The concentrations of serum IL-6 and TNF-α were significantly higher in the KET group than those in the NS group at 12th week, suggesting that inflammatory was involved in the pathogenesis of ketamine induced cystitis, which was in accord with our results of H&E staining. In the H&E staining, we observed that, at the 12th week, significant inflammatory reaction existed in the KET group. This pathologic change was in line one clinical report that focused on ketamine abusers and 71% patients had various degrees of epithelial inflammation [28].
In addition, we used metabolomics to seek the change of endogenous metabolites correlated with ketamine cystitis. A total of 30, 28, and 32 significant changed metabolites were identified at the 1st, 4th week and 12th week between the NS group and the KET group, respectively. The results showed that, at the 1st and 4th week, there were 15 identical changed metabolites. Metabolic pathway analysis also showed that, at the 1st and 4th week, characteristic metabolites were involved in almost same major metabolic pathways; such as D-glutamine and D-glutamate metabolism: arachidonic acid metabolism; glycine, serine and threonine metabolism; alanine, aspartate and glutamate metabolism; inositol phosphate metabolism. Ascorbate and aldarate metabolism, which are mainly involved the metabolism of glucuronic acid and ascorbic acid, were significantly affected at the 4th week. Those changed metabolites, together with the above-mentioned evidence, indicates that the changes were similar at the early stage of ketamine administration. Unlike the other two time points, at 12th week, rats in the KET group exhibited significant inflammatory reaction and characteristic metabolites were obviously different from the 1st and 4th week. Metabolic pathway analysis showed that linoleic acid metabolism, beta-alanine metabolism, glyoxylate and dicarboxylate metabolism were only affected at the 12th week. Linoleic acid is a key metabolite involved in Linoleic acid metabolism that produces arachidonic acid which plays an important regulatory role in inflammation and immune response, indicating that the inflammatory reaction raised at the later period of ketamine administration. This was in line with our pathologic observations. Beta-alanine metabolism in the body mainly involves the alanine-glucose cycle and this metabolic pathway suggested that energy metabolism was disturbed at the later phase of ketamine administration. Citric acid, involved in glyoxylate and dicarboxylate metabolism, is a key regulator of energy production, which was also down-regulated after 12 weeks ketamine treatment, and again demonstrated that energy metabolism was disturbed by long-term administration of ketamine.
Conclusion
Linoleic acid metabolism, beta-alanine metabolism, glyoxylate and dicarboxylate metabolism were only affected by long-term administration of ketamine. Those metabolic pathways may have a close relationship with cystitis induced by ketamine.
Acknowledgements
This study was supported by the National Natural Sciences Foundation of China (No. 81373239, 30973369).
Disclosure of conflict of interest
None.
References
- 1.Corssen G, Domino EF. Dissociative anesthesia: further pharmacologic studies and first clinical experience with the phencyclidine derivative CI-581. Anesth Analg. 1966;45:29–40. [PubMed] [Google Scholar]
- 2.Chen L, Malek T. Follow me down the K-hole: ketamine and its modern applications. Crit Care Nurs Q. 2015;38:211–216. doi: 10.1097/CNQ.0000000000000064. [DOI] [PubMed] [Google Scholar]
- 3.Reus GZ, Carlessi AS, Titus SE, Abelaira HM, Ignacio ZM, da Luz JR, Matias BI, Bruchchen L, Florentino D, Vieira A, Petronilho F, Quevedo J. A single dose of S-ketamine induces long-term antidepressant effects and decreases oxidative stress in adulthood rats following maternal deprivation. Dev Neurobiol. 2015;75:1268–1281. doi: 10.1002/dneu.22283. [DOI] [PubMed] [Google Scholar]
- 4.Zanos P, Moaddel R, Morris PJ, Georgiou P, Fischell J, Elmer GI, Alkondon M, Yuan P, Pribut HJ, Singh NS, Dossou KS, Fang Y, Huang XP, Mayo CL, Wainer IW, Albuquerque EX, Thompson SM, Thomas CJ, Zarate CA Jr, Gould TD. NMDAR inhibition-independent antidepressant actions of ketamine metabolites. Nature. 2016;533:481–486. doi: 10.1038/nature17998. [DOI] [PMC free article] [PubMed] [Google Scholar]
- 5.Wang C, Liu F, Patterson TA, Paule MG, Slikker W Jr. Preclinical assessment of ketamine. CNS Neurosci Ther. 2013;19:448–453. doi: 10.1111/cns.12079. [DOI] [PMC free article] [PubMed] [Google Scholar]
- 6.Trujillo KA, Smith ML, Sullivan B, Heller CY, Garcia C, Bates M. The neurobehavioral pharmacology of ketamine: implications for drug abuse, addiction, and psychiatric disorders. Ilar J. 2011;52:366–378. doi: 10.1093/ilar.52.3.366. [DOI] [PMC free article] [PubMed] [Google Scholar]
- 7.Shahani R, Streutker C, Dickson B, Stewart RJ. Ketamine-associated ulcerative cystitis: a new clinical entity. Urology. 2007;69:810–812. doi: 10.1016/j.urology.2007.01.038. [DOI] [PubMed] [Google Scholar]
- 8.Muetzelfeldt L, Kamboj SK, Rees H, Taylor J, Morgan CJ, Curran HV. Journey through the K-hole: phenomenological aspects of ketamine use. Drug Alcohol Depend. 2008;95:219–229. doi: 10.1016/j.drugalcdep.2008.01.024. [DOI] [PubMed] [Google Scholar]
- 9.Chu PS, Kwok SC, Lam KM, Chu TY, Chan SW, Man CW, Ma WK, Chui KL, Yiu MK, Chan YC, Tse ML, Lau FL. ‘Street ketamine’-associated bladder dysfunction: a report of ten cases. Hong Kong Med J. 2007;13:311–313. [PubMed] [Google Scholar]
- 10.Winstock AR, Mitcheson L, Gillatt DA, Cottrell AM. The prevalence and natural history of urinary symptoms among recreational ketamine users. BJU Int. 2012;110:1762–1766. doi: 10.1111/j.1464-410X.2012.11028.x. [DOI] [PubMed] [Google Scholar]
- 11.Wei YB, Yang JR, Yin Z, Guo Q, Liang BL, Zhou KQ. Genitourinary toxicity of ketamine. Hong Kong Med J. 2013;19:341–348. doi: 10.12809/hkmj134013. [DOI] [PubMed] [Google Scholar]
- 12.Baker SC, Shabir S, Georgopoulos NT, Southgate J. Ketamine-induced apoptosis in normal human urothelial cells: a direct, N-Methyl-d-Aspartate receptor-independent pathway characterized by mitochondrial stress. Am J Pathol. 2016;186:1267–1277. doi: 10.1016/j.ajpath.2015.12.014. [DOI] [PMC free article] [PubMed] [Google Scholar]
- 13.Wai MS, Luan P, Jiang Y, Chan WM, Tsui TY, Tang HC, Lam WP, Fan M, Yew DT. Long term ketamine and ketamine plus alcohol toxicity - what can we learn from animal models? Mini Rev Med Chem. 2013;13:273–279. doi: 10.2174/1389557511313020009. [DOI] [PubMed] [Google Scholar]
- 14.Gu D, Huang J, Yin Y, Shan Z, Zheng S, Wu P. Long-term ketamine abuse induces cystitis in rats by impairing the bladder epithelial barrier. Mol Biol Rep. 2014;41:7313–7322. doi: 10.1007/s11033-014-3616-5. [DOI] [PubMed] [Google Scholar]
- 15.Parsons CL, Boychuk D, Jones S, Hurst R, Callahan H. Bladder surface glycosaminoglycans: an epithelial permeability barrier. J Urol. 1990;143:139–142. doi: 10.1016/s0022-5347(17)39897-x. [DOI] [PubMed] [Google Scholar]
- 16.Lee CL, Jiang YH, Kuo HC. Increased apoptosis and suburothelial inflammation in patients with ketamine-related cystitis: a comparison with non-ulcerative interstitial cystitis and controls. BJU Int. 2013;112:1156–1162. doi: 10.1111/bju.12256. [DOI] [PubMed] [Google Scholar]
- 17.Ricci V, Martinotti G, Gelfo F, Tonioni F, Caltagirone C, Bria P, Angelucci F. Chronic ketamine use increases serum levels of brain-derived neurotrophic factor. Psychopharmacology (Berl) 2011;215:143–148. doi: 10.1007/s00213-010-2121-3. [DOI] [PubMed] [Google Scholar]
- 18.Meng E, Chang HY, Chang SY, Sun GH, Yu DS, Cha TL. Involvement of purinergic neurotransmission in ketamine induced bladder dysfunction. J Urol. 2011;186:1134–1141. doi: 10.1016/j.juro.2011.04.102. [DOI] [PubMed] [Google Scholar]
- 19.Allen J, Davey HM, Broadhurst D, Heald JK, Rowland JJ, Oliver SG, Kell DB. High-throughput classification of yeast mutants for functional genomics using metabolic footprinting. Nat Biotechnol. 2003;21:692–696. doi: 10.1038/nbt823. [DOI] [PubMed] [Google Scholar]
- 20.Lu X, Tang Q, Ye Y, Guo R, Chen F, Dai X, Yan Y, Liao L. A preliminary urinary metabolomics study of sprague-dawley rats after short-term ketamine administration by proton nuclear magnetic resonance spectroscopy. Journal of Forensic Science and Medicine. 2016;2:91–97. [Google Scholar]
- 21.Kanani H, Chrysanthopoulos PK, Klapa MI. Standardizing GC-MS metabolomics. J Chromatogr B Analyt Technol Biomed Life Sci. 2008;871:191–201. doi: 10.1016/j.jchromb.2008.04.049. [DOI] [PubMed] [Google Scholar]
- 22.Xia J, Mandal R, Sinelnikov IV, Broadhurst D, Wishart DS. MetaboAnalyst 2.0--a comprehensive server for metabolomic data analysis. Nucleic Acids Res. 2012;40:W127–133. doi: 10.1093/nar/gks374. [DOI] [PMC free article] [PubMed] [Google Scholar]
- 23.Morgan CJ, Curran HV. Ketamine use: a review. Addiction. 2012;107:27–38. doi: 10.1111/j.1360-0443.2011.03576.x. [DOI] [PubMed] [Google Scholar]
- 24.Lee YL, Lin KL, Chuang SM, Lee YC, Lu MC, Wu BN, Wu WJ, Yuan SF, Ho WT, Juan YS. Elucidating mechanisms of bladder repair after hyaluronan instillation in ketamine-induced ulcerative cystitis in animal model. Am J Pathol. 2017;187:1945–1959. doi: 10.1016/j.ajpath.2017.06.004. [DOI] [PubMed] [Google Scholar]
- 25.Tsai TH, Cha TL, Lin CM, Tsao CW, Tang SH, Chuang FP, Wu ST, Sun GH, Yu DS, Chang SY. Ketamine-associated bladder dysfunction. Int J Urol. 2009;16:826–829. doi: 10.1111/j.1442-2042.2009.02361.x. [DOI] [PubMed] [Google Scholar]
- 26.Parsons CL, Greene RA, Chung M, Stanford EJ, Singh G. Abnormal urinary potassium metabolism in patients with interstitial cystitis. J Urol. 2005;173:1182–1185. doi: 10.1097/01.ju.0000148361.82074.77. [DOI] [PubMed] [Google Scholar]
- 27.Parsons CL. The role of a leaky epithelium and potassium in the generation of bladder symptoms in interstitial cystitis/overactive bladder, urethral syndrome, prostatitis and gynaecological chronic pelvic pain. BJU Int. 2011;107:370–375. doi: 10.1111/j.1464-410X.2010.09843.x. [DOI] [PubMed] [Google Scholar]
- 28.Cottrell A, Warren K, Ayres R, Weinstock P, Kumar V, Gillatt D. The destruction of the lower urinary tract by ketamine abuse: a new syndrome? BJU Int. 2008;102:1178–1179. doi: 10.1111/j.1464-410X.2008.08146_2.x. author reply 1179. [DOI] [PubMed] [Google Scholar]


