Abstract
Breast cancer (BRCA) is one of the most common malignancies in women. The gene expression profile of GSE103512 from the GEO database was downloaded in order to find key genes involved in the occurrence and development of BRCA. 75 samples, including 65 cancer and 10 normal samples, were included in this analysis. Differentially expressed genes (DEGs) between BRCA patients and health people were chosen using R tool. We next performed gene ontology (GO) analysis and Kyoto Encyclopedia of Gene and Genome (KEGG) pathway analysis using the Database for Annotation, Visualization and Integrated Discovery (DAVID). Moreover, Cytoscape with Search Tool for the Retrieval of Interacting Genes (STRING) was utilized to visualize protein-protein interaction (PPI) of these DEGs. The related genes and medicines specific to hub genes were predicted by CBioportal. We screened a total of 357 DEGs including 77 up-regulated and 280 down-regulated. A series of BRCA related GO terms and pathways were identified by analysis of these DEGs. Insulin-like growth factor 1 (IGF1); epidermal growth factor receptor (EGFR); v-jun avian sarcoma virus 17 oncogene homolog (JUN) and Estrogen Receptor 1 (ESR1) of the DEGs were screened by construction of the PPI network and the degree of connectivity. IGF1 and ESR1 were finally selected as potential hub genes and treatment targets of BRCA. In conclusion, this bioinformatics analysis demonstrated that DEGs and hub genes, such as IGF1, might regulate the development of gastric cancer. These DEGs could be used as new biomarkers for diagnosis and to guide the combination medicine of BRCA.
Keywords: Breast cancer, bioinformatics analysis, differential expression genes, biomarker, therapeutic
Introduction
Breast cancer is currently the main cause of death among women in the world [1]. Although the mortality of breast cancer has decreased, owing to the development of modern therapeutic approaches, the morbidity is still very high [2]. About 1,700,000 new cases of breast cancer and 521,900 deaths every year have been reported worldwide [3]. In China, especially in rural areas where people have lower income and less access to health care facilities, the morbidity of breast cancer has reached 24.20 per 100,000 [4]. In the United States, 231,840 women were diagnosed with and 40,290 died from breast cancer in 2015 [5]. Women of African descent show a lower incidence, but higher mortality rates and earlier age of onset [6]. Although China is a low-lying area relative to western countries, epidemiological data in recent years show that with the development of industrialization and the change of people’s lifestyle, the overall incidence of breast cancer is increasing and the age of onset is decreasing [7,8]. However, current diagnostic technologies, including imaging, molecular detection, and immunohistochemistry (IHC) have inherent limitations and may provide uncertain results [9,10]. Thus, the early diagnosis and treatment of breast cancer are becoming more and more important.
Recently, many biomarkers and therapeutic target genes have emerged. Estrogen receptor (ER), progesterone receptor (PR), human epidermal growth factor receptor-2 (HER2), and proliferation marker Ki-67 have been used to identify the subtypes and diagnose the breast cancer [2]. The most common treatment strategies today are endocrine therapy, chemotherapy, and targeted therapy using antibodies recognizing cancer biomarkers; however, they are not always successful and may cause adverse effects and drug tolerance [11,12]. Therefore, there is a constant need to investigate the development mechanism for breast cancer diagnosis and therapy.
High throughput sequencing is increasingly being widely used and it has been a very significant tool for life sciences, such as cancer grading, cancer early diagnosis, and prognosis prediction [12]. In this study, to further understand breast cancer, the GSE103512 was downloaded from GEO datasets and analyzed by R bioconductor for DEGs. Analysis of the biological process (BP), molecular function (MF), cellular component (CC), and KEGG pathways of the DEGs and three modules were performed. The regulatory network of these DEGs was constructed using string and the key genes with high degree of connectivity were selected by Cytoscape. Finally, the correlation between genes, survival, and disease was confirmed based on Kaplan Meier plotter online database (http://kmplot.com/analysis/) [13] and TCGA database.
Materials and methods
Data source and DEGs identification
The GSE103512 datasets including 65 breast cancer with 10 matched normal; 57 colorectal cancers with 12 matched normal; 60 non-small cell lung cancers with 9 matched normal; 60 prostate cancers with 7 matched normal, was downloaded from GEO. The breast cancer data were chosen to perform the differential expression genes analysis. The Bioconductor package of R was applied to detect the DEGs with cut-off criteria (adjust P value < 0.01 and |logFC| ≥ 1) [14]. A total of 357 genes with significant differential expression were selected after the analysis of GSE103512; of which, 77 were up-regulated genes and 280 were down-regulated (Table 1).
Table 1.
DEGs with P < 0.01 and |logFC| > 1
| EXPRESSION | GENE SYMBOL |
|---|---|
| Down-regulated | HBA2///HBA1 HBA2///HBA1 LYVE1 ADH1B |
| HSPB6 HBB FABP4 PDK4 ADH1B CD36 CD36 HSPB6 HBA2///HBA1 CD36 PLIN1 CCL15-CCL14///CCL15///CCL14 HBA2///HBA1 FHL1 FHL1 LPL LYVE1 HBB GPX3 FOS CD36 FOSB FHL1 PDK4 NTRK2 PLA2G2A IGF1 SRPX IGSF10 IGF1 DPT TNXB///TNXA TWIST2 CCL18 GPX3N PIGR ADIPOQ EFEMP1 CXCL12 FHL1 FHL1 TFPI OGN FABP4 ALPL MMP19 PTGIS NTRK2 MT1M DST ENPP2 PDK4 CIDEC ABCA6 PIGR ADAMTS5 EGR1 PTGDS | |
| SVEP1 DPT MEG3 CD209 HBB IGFBP6 SYNM CFD ALPL PTGIS CCL18 CAV1 C2orf40 MEG3 AOC3 SAA2///SAA1 MATN2 OGN SOCS3 PTGIS NTRK2 LINC01279 MYH11 ABCA8 VIM CCL28 SAA2///SAA1 CXCL2 ADAM33 EGR1 ANXA1 TGFBR3 TNXB///TNXA CCDC80 GALNT16 | |
| KIT CAV1 COL14A1 TFPI ENPP2 DUSP1 FAM126A CRISPLD2 SLIT3 SCARA5 EBF1 IGF1 MEG3 BTNL9 CHRDL1 RHOJ OSR1 ITM2A IGF1 CAPN6 TNXB///TNXA CCL21 CEBPD MFAP4 CCL28 KLF4 PALMD CCDC80 COL14A1 SOD3 RGCC MYH11 TNXB ACACB SAMD5 SVEP1 ANK2 MYH11 | |
| MAO APDGFRA LRRN4CL G0S2 ANXA1 SYNPO2 TSHZ2 TFPI SCARA5 CCDC80 PLTP ABCA9 SLC16A7 DUSP1 PTGDS MEST KLF4 EBF1 EMP1 ABI3BP PLPP3 COL14A1 DST PTGDS CXCL2 SOD2 PALMD RUNX1T1 JUN RHOJ PDGFD PLPP3 PDGFD TGFBR2 RHOJ ACACB JUN ANK2 C7 EDNRB ACACB AOX1 F13A1 PCDH18 CD248 EBF1 DPT ITM2A ZFP36 GAS1 LPL | |
| ADAMTS1 LIFR PLPP3 SNORD114-3 RHOJ ADD3 TGFBR3 AQP1 ITIH5 EGFR COL14A1 CXorf36 GPAM CLEC3B C1R MYH11 CDR1 CCL13 MEDAG SVEP1 ADGRA2 AOX1 FMO2 ATF3 CFHR1///CFH SYNPO2 TNXB FIGF LDB2 RND3 FLRT2 TTN ADAMTSL4 CD209 EDNRB RHOU APCDD1 TNS1 CD163 GAS7 IGHD TBX18 MS4A4A KCNIP2 SYNPO2 AQP1 TNS1 PLIN4 ADGRA2 CD34 PRNP RHOJ TBX18 CNN1 DCLK1 ADAMTS5 ADD3 GNG11 | |
| FMO2 PROS1 EFEMP1 LHFP RSPO3 ADAMTS5 KLF2 CAPN6 LILRB5 LINC00341 KCNMB1 TF RCAN1 ANGPTL2 CLDN11 ADD3 CD163 COL15A1 CDC42EP5 PER1 MS4A4A GPM6B ISM1 | |
| Up-regulated | INTS7 IRX5 SBK1 MSI2 F11R SDC1 DDR1 EPS8L2 SYNE4 CERS6 F7 MSI2 |
| MYO6 RAB25 CAMSAP3 FKBP4 DHTKD1 PLEKHF2 HACD3 FAM83H HN1L | |
| STRBP SPINT1 IQGAP3 LLGL2 PMEPA1 GRHL2 DDR1 PRR5 DNAH14 CST4 | |
| CYTH2 UBE2C HSPA1B///HSPA1A CERS6 ESRP1 ELF3 MSI2 HN1L MAL2 | |
| ESYT2 SRP9 KDM4B DDR1 PRSS8 ERBB3 TFAP2A INHBA TPD52 ERBB3 | |
| ERBB3 TRPS1 KIFC2 TPD52 MMP11 KRT8 PARD6B SULF1 CELSR1 PRLR | |
| SULF1 STARD10 TRPS1 KRT18 ESRP1 LOC692247 TPD52 NPNT COL11A1 | |
| MUC1 GPRC5A COL10A1 COL11A1 COL10A1 ESR1 |
Gene ontology and KEGG pathway enrichment analysis
To identify characteristic biological alterations in high throughput genome and transcriptome data, gene ontology analysis (GO), an online tools containing numerous database, is a usual method for annotating genes and gene products [15]. Kyoto Encyclopedia of Genes and Genomes (KEGG) is a collection of databases dealing with genomes, biological pathways, diseases, drugs, and chemical substances [16]. DEGs from GSE were uploaded to DAVID to perform the BP (biological process), CC (cellular component), MF (molecular function) and pathway enrichment analysis. P < 0.05 was set as the cut-off criterion.
PPI network construction and core genes analysis
The STRING database (http://string-db.org) aims to provide a critical assessment and integration of protein-protein interactions, including direct (physical) as well as indirect (functional) associations [17]. DEGs from GSE103512 were uploaded to STRING for the known and predicted interactions analysis (confidence score ≥ 0.15, maximum number of interactors = 0). Next, the result was imported to Cytoscape for the core genes screening with degree cutoff = 25 [18].
Survival analysis of key genes
To assess the effect of 54,675 genes on survival using 10,461 cancer samples, 5,143 breast, 1,816 ovarian, 2,437 lung and 1,065 gastric cancer patients with a mean follow-up of 69/40/49/33 months [19] were analyzed. The primary purpose of the tool is as a meta-analysis based biomarker assessment [19]. In this study, key genes (ESR1, IGF1, EGFR, JUN) were assessed for their effect on survival with 95% confidence intervals and log rank P value < 0.01.
Correlation between hub genes and breast cancer
Study on the correlation between hub genes and breast cancer was performed by the online tools GEPIA (http://gepia.cancer-pku.cn/index.html). GEPIA is a web server for analyzing the RNA sequencing expression data of 9,736 tumors and 8,587 normal samples from the TCGA and the GTEx projects, using a standard processing pipeline [20].
Medicine and regulatory factors of hub genes prediction
CBioPortal (http://www.cbioportal.org/) website integrates the data of 126 tumor genome research, including TCGA and ICGC, covering the data of twenty-eight thousand specimens. Here we used this website for prediction of medicine and regulation factors of hub genes based on such database including PhosphoSite, KEGG Drugs, pid, HumanCyc, Reactome, PANTHER and DrugBank [21].
Results
Screening of DEGs
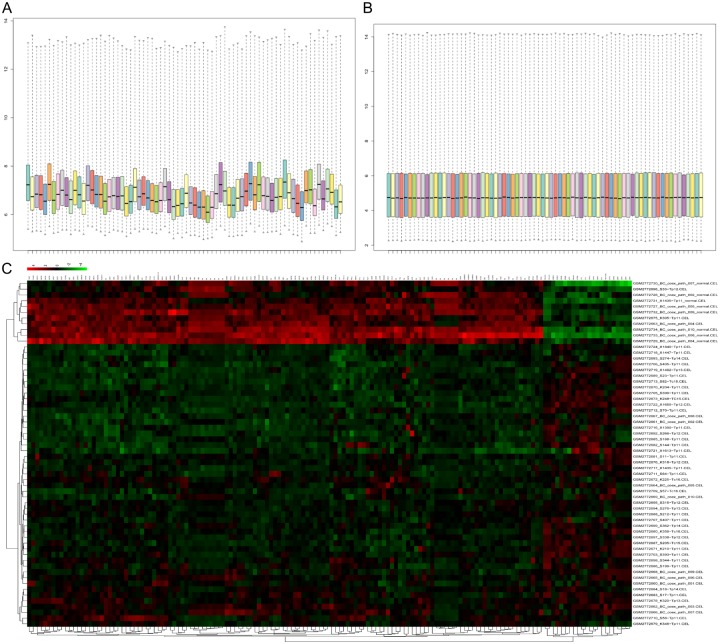
To observe the alteration between breast cancer and normal tissues on the transcriptome level, 65 breast cancer and 10 matched normal mRNA expression values of GSE103512 datasets were analyzed by R conductor package. Cassette figures before (Figure 1A) and after (Figure 1B) data standardization are shown. We set the adjust P value < 0.01 and |logFC| ≥ 1 as cut-off criteria. The alignment of black dots on the same line indicates good standardization. Analysis of the mRNA expression fold-change of the DEGs showed a highly significant difference between BRCA and normal tissues (Figure 1C). These results revealed that the data can be directly used for further analysis. Finally, a total of 357 differential expressed genes were detected after the analysis of GSE103512, of which 77 were up-regulated genes and 280 were down-regulated (Table 1).
Figure 1.
DEG screening of GSE 103512 datasets. Cassette figures before (A) and after (B) data standardization. (C) Hierarchical clustering of the first 150 DEGs. The color scale shown at the top illustrates the relative expression level of an mRNA. Red color represents a high relative expression level and a green color represents a low relative expression level.
Identification of GO terms and pathways related to DEGs
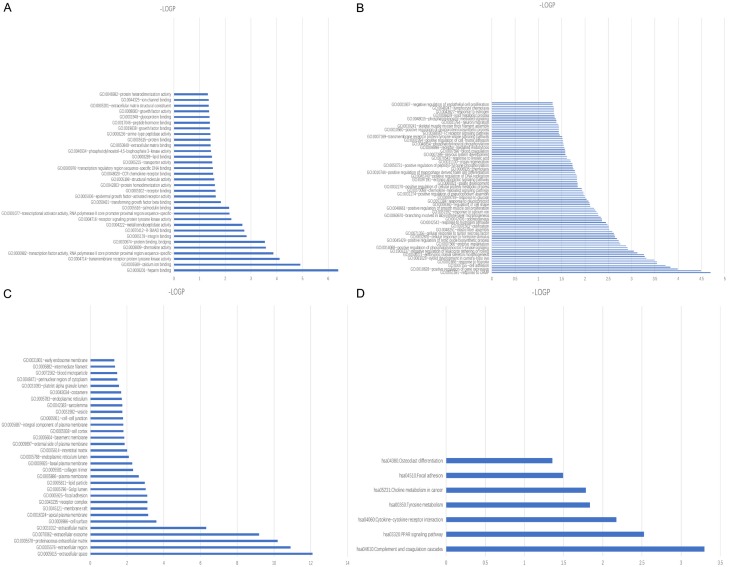
The Database for Annotation, Visualization and Integrated Discovery is an online bioinformatics resource that provides tools for the functional enrichment of large lists of genes or proteins [22]. To better understand breast cancer development, molecular function (Figure 2A), biological process (Figure 2B), cellular component (Figure 2C) and signaling pathway (Figure 2D) alteration in the disease were analyzed by DAVID.
Figure 2.
GO and KEGG pathway analysis of DEGs using-log p. A. Analysis of molecular function enrichment. B. Analysis of biological process enrichment. C. Analysis of cellular component enrichment. D. Analysis of KEGG pathway analysis.
PPI network analysis reveals the hub genes among DEGs
The potential main regulators may be the focal point for therapeutic and drug design. In this analysis, 77 up-regulated and 280 down-regulated genes were selected based on our criterion. To obtain the core genes during breast cancer development, we constructed the regulatory network by analysis of PPI and then IGF1 (degree = 36), EGFR (degree = 36), JUN (degree = 33), ESR1 (degree = 34) were selected as the hub genes (Figure 3).
Figure 3.
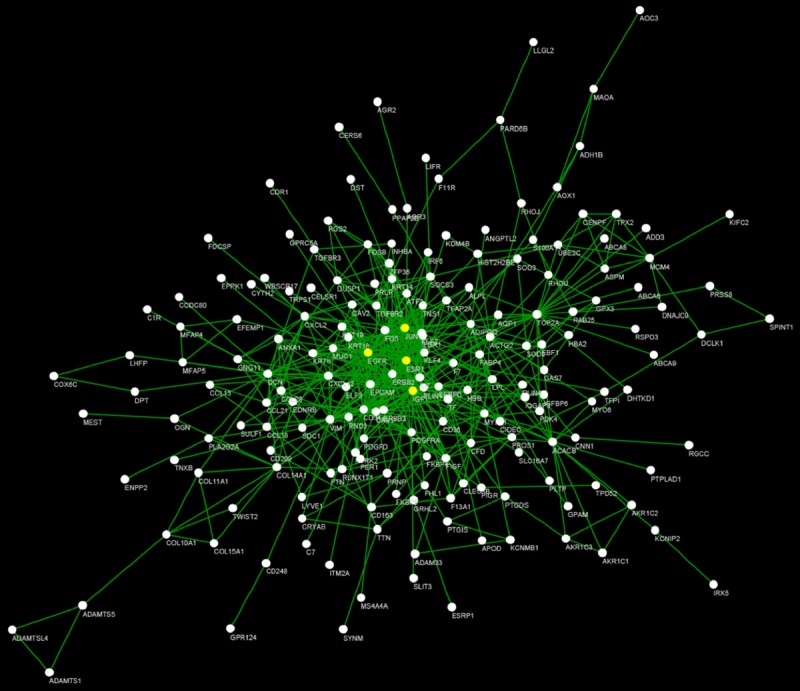
PPI network construction of DEGs. The yellow node in the network represents the core node with degree ≥ 25.
IGF1 and ESR1 alterations may play important role in breast cancer patient’s survival
Survival analysis is widely used in clinical and epidemiological research, in randomized clinical trials for comparing the efficacy of treatments, and in observational (non-randomized) research to determine and test the existence of epidemiological association [22]. In our study, survival analysis was performed to assess the hub genes in patient’s survival. The results suggest that expression of IGF1 (HR = 0.75 (0.68-0.84) log rank P = 4.2e-07) (Figure 4A) and ESR1 (HR = 0.67 (0.6-0.74) log rank P = 2.5e-13) (Figure 4B) but not JUN (HR = 0.88 (0.79-0.98) log rank P = 0.02) (Figure 4C) and EGFR (HR = 0.87 (0.74-1.01) log rank P = 0.074) (Figure 4D) was associated with worse overall survival (OS) for breast cancer patients. To determine the correlation between hub genes and breast cancer, IGF1, and ESR1 expression was evaluated by GEPIA. Indeed, expression of IGF1 (Figure 5A) was down-regulated and ESR1 (Figure 5B) was up-regulated in breast cancer.
Figure 4.
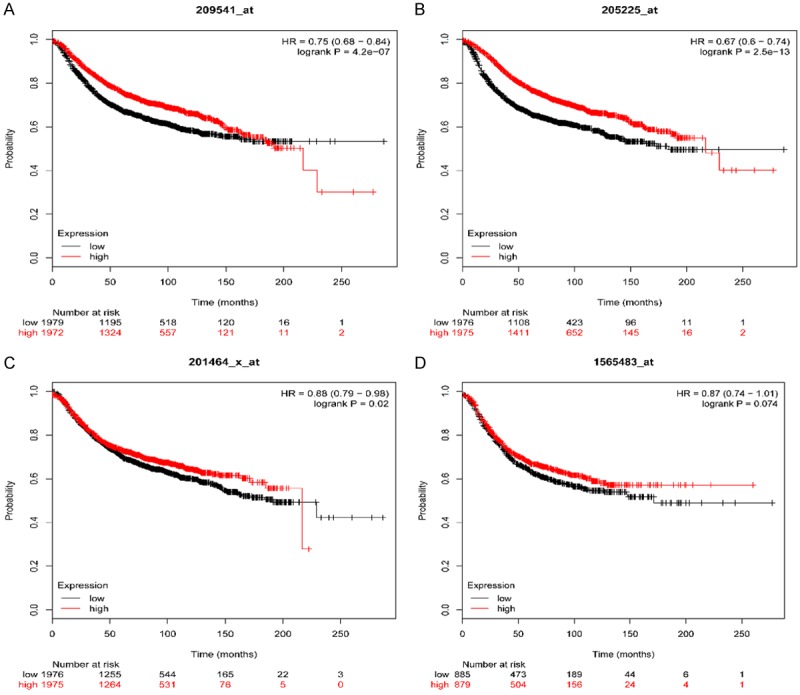
Prognostic value of four genes (IGF1 (A), ESR1 (B), JUN (C), EGFR (D)) in BRCA patients. The desired Affymetrix IDs are valid: 209541_at (IGF1), 201464_x_at (ESR1), 202311_s_at (JUN), 1565483_at (EGFR). HR: hazard ratio, CI: confidence interval.
Figure 5.
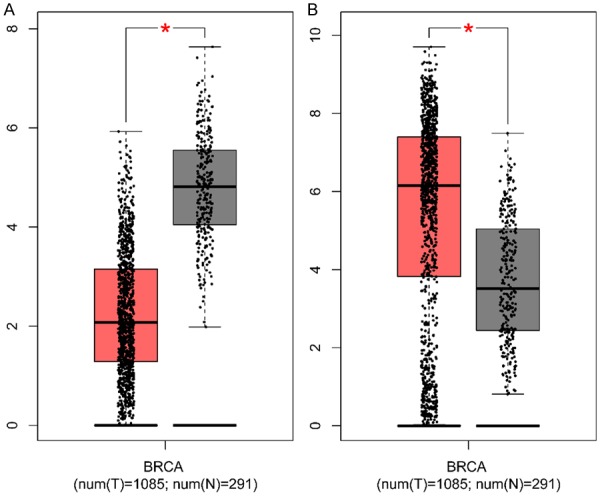
Expression level of IGF1 (A) and ESR1 (B) in cancer and normal tissues. BRCA: breast cancer, T: tumor tissues, N: normal tissues, *P < 0.05.
Various genes and medicines specific to IGF1 and ESR1 reveal IGF1 and ESR1 as potential targets for breast cancer treatment
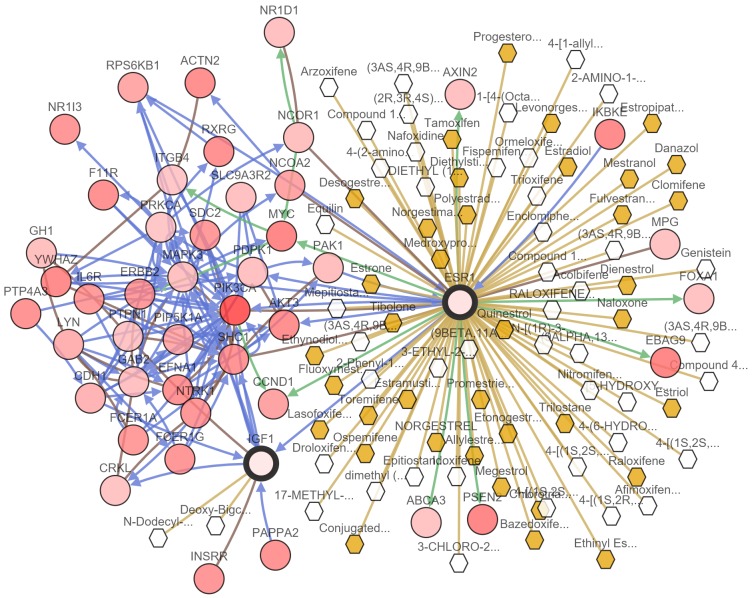
To evaluate if IGF1 and ESR1 could be targets for breast cancer therapeutics, a website integrated PhosphoSite, KEGG Drugs, pid, HumanCyc, Reactome, PANTHER, and DrugBank databases, to analyze genes and drugs. In our results, 37 FDA approved drugs and 41 non-FDA approved drugs were selected for ESR1. Only Deoxy-Bigchap was selected for IGF1 (Figure 6). There were also many proteins that could regulate IGF1 and ESR in transport, phosphorylation, expression, and other potential ways (Figure 6).
Figure 6.
Medicine and regulatory factors of IGF1 and ESR1 prediction. Pink circles: genes, white hexagon: drugs not approved by FDA, yellow hexagon: FDA approved drugs, Pink arrows: transport controls, turquoise arrows: phosphorylation controls, green arrows: controls expression, yellow lines: targeted by drug.
Discussion
Approximately 232,340 new cases of invasive breast cancer and 39,620 breast cancer deaths are expected to occur among US women in 2013. Although exemestane is currently approved by the US Food and Drug Administration to prevent breast cancer recurrence, promising results from clinical trials led the American Society of Clinical Oncology to include exemestane in their guidelines as a third option for chemoprevention [23]. Continued progress in the control of breast cancer will require sustained and increased efforts to provide high-quality screening, diagnosis, and treatment to all segments of the population.
Biomarker identification for any disease helps in the development of improved diagnostics and clinical treatment efficacy. Microarray data analysis has been widely used for disease biomarker discovery [23-26]. In this study, gene transcription alteration of breast cancer and normal in GSE103512 was analyzed. 77 up-regulated and 280 down-regulated DEGs were observed including an usual biomarker ESR1 in BRCA. These results indicate that these DEGs may be biomarkers of breast cancer. To have a better understanding of the biological contribution of these DEGs, MF, and BP analysis were executed. The response to cAMP, extracellular matrix organization, positive regulation of gene expression, cell chemotaxis, cell adhesion of BP and heparin binding, calcium ion binding, transmembrane receptor protein tyrosine kinase activity, transcription factor activity, RNA polymerase II core promoter proximal region sequence-specific binding were identified, indicating the association of these GO term and breast cancer. In the cellular component analysis, most of these DEGs were enriched in GO terms such as extracellular space, extracellular region, proteinaceous extracellular matrix, extracellular exosome, extracellular matrix, cell surface, apical plasma membrane and membrane raft, etc. These GO terms are totally associated with membranes and suggest that secreted protein and membrane protein reactions such as some receptors and ligands interaction may play important roles in the breast cancer progression. Coincidentally, this speculation was assessed in the KEGG pathway analysis which contains the cytokine-cytokine receptor interaction term. Other pathways in our study may also associate with breast cancer development.
As the protein and protein interaction maybe essential for breast cancer, the PPI network of DEGs was constructed using STRING in our research. This data shows us a complicated regulation network in the breast cancer. But there should be some hub genes for breast cancer therapeutics, therefore, the core node with high connective degree was selected by Cytoscape. With this approach, 4 genes including IGF1, EGFR, ESR1 and JUN were selected for our analysis.
To assess the results of our analysis, survival analysis and expression comparison of the 4 genes was executed based on TCGA and other cancer databases. EGFR and JUN were without a significant effect on patient’s survival and were excluded in our study. Studies have shown that diabetes is a risk factor for breast cancer development and is associated with poor prognosis for breast cancer patients [27]. IGF1, a polypeptide protein similar to insulin molecular structure, its precursor could induce breast cancer cell proliferation via the IGF1 receptor [28]. However, there was no direct evidence for the effect of IGF1 on breast cancer diagnosis and therapeutics. Here, we demonstrate that the mRNA level of IGF1 was significantly decreased between BRCA tumor and normal tissues and seemed to be the core factor among these DEGs. There are many studies that have shown that mutation of ESR1 was essential for breast cancer and this gene has been applied as a breast cancer biomarker [2,3,29]. It also indicated the effectiveness of our analysis. In addition, the breast cancer patients in our study are ESR1 high expressers, but it is interesting that breast cancer patients with high ESR1 present higher survival than low ESR1 expression. We suspect this phenomenon is a self-protection mechanism against breast cancer and deserves experimental verification.
We also predict the potential drugs for breast cancer therapeutics according to our analysis, and this also highlights the potential of IGF1 and ESR1 as targets of breast cancer therapeutics. Screening of these drugs should be performed. The genes that regulate ESR1 transport, phosphorylation, expression, and other potential ways may also participate in the human self-protection against BRCA.
Our bioinformatics analysis identified DEGs that might play a central role in the occurrence, development, and prognosis of breast cancer. In this study, a total of 357 DEGs were selected, and EGFR, JUN, IGF1, and ESR1 might be the core genes of breast cancer. In order to get more accurate correlation results, we performed a series of verification experiments later to confirm the results of this prediction. Finally, IGF1 and ESR1 were selected as hub genes for diagnosis and treatment of breast cancer. Overall, this study provides some powerful evidence for future genomic individualized diagnosis and treatment of breast cancer.
Acknowledgements
We are grateful to Brouwer-Visser J, Cheng W, Bauer-Mehren A, Maisel D, Lechner K, Andersson E, Dudley JT, Milletti F who provided the GSE103580 dataset for this analysis, and it is our pleasure to acknowledge their contributions. This study was supported by the National Natural Science Foundation of China (No. 81771173 and 31060136).
Disclosure of conflict of interest
None.
References
- 1.DeSantis C, Ma J, Bryan L, Jemal A. Breast cancer statistics, 2013. CA Cancer J Clin. 2014;64:52–62. doi: 10.3322/caac.21203. [DOI] [PubMed] [Google Scholar]
- 2.Donepudi MS, Kondapalli K, Amos SJ, Venkanteshan P. Breast cancer statistics and markers. J Cancer Res Ther. 2014;10:506–511. doi: 10.4103/0973-1482.137927. [DOI] [PubMed] [Google Scholar]
- 3.Torre LA, Bray F, Siegel RL, Ferlay J, Lortet-Tieulent J, Jemal A. Global cancer statistics, 2012. CA Cancer J Clin. 2015;65:87–108. doi: 10.3322/caac.21262. [DOI] [PubMed] [Google Scholar]
- 4.Azim HA, Ibrahim AS. Breast cancer in Egypt, China and Chinese: statistics and beyond. J Thorac Dis. 2014;6:864–866. doi: 10.3978/j.issn.2072-1439.2014.06.38. [DOI] [PMC free article] [PubMed] [Google Scholar]
- 5.DeSantis CE, Fedewa SA, Goding Sauer A, Kramer JL, Smith RA, Jemal A. Breast cancer statistics, 2015: convergence of incidence rates between black and white women. CA Cancer J Clin. 2016;66:31–42. doi: 10.3322/caac.21320. [DOI] [PubMed] [Google Scholar]
- 6.Deloumeaux J, Gaumond S, Bhakkan B, Manip M’Ebobisse N, Lafrance W, Lancelot P, Vacque D, Negesse Y, Diedhiou A, Kadhel P. Incidence, mortality and receptor status of breast cancer in African Caribbean women: data from the cancer registry of Guadeloupe. Cancer Epidemiol. 2017;47:42–47. doi: 10.1016/j.canep.2017.01.004. [DOI] [PubMed] [Google Scholar]
- 7.Chu J, Zhou C, Guo X, Sun J, Xue F, Zhang J, Lu Z, Fu Z, Xu A. Female breast cancer mortality clusters in Shandong Province, China: a spatial analysis. Sci Rep. 2017;7:105. doi: 10.1038/s41598-017-00179-8. [DOI] [PMC free article] [PubMed] [Google Scholar]
- 8.Lu S, Qian Y, Huang X, Yu H, Yang J, Han R, Su J, Du W, Zhou J, Dong M, Yu X, Duijnhoven F, Kampman E, Wu M. The association of dietary pattern and breast cancer in Jiangsu, China: a population-based case-control study. PLoS One. 2017;12:e0184453. doi: 10.1371/journal.pone.0184453. [DOI] [PMC free article] [PubMed] [Google Scholar]
- 9.Lindenberg MA, Miquel-Cases A, Retel VP, Sonke GS, Wesseling J, Stokkel MPM, van Harten WH. Imaging performance in guiding response to neoadjuvant therapy according to breast cancer subtypes: a systematic literature review. Crit Rev Oncol Hematol. 2017;112:198–207. doi: 10.1016/j.critrevonc.2017.02.014. [DOI] [PubMed] [Google Scholar]
- 10.Gunn S, Yaziji H, Sims C, Govender S, Moore M, Cotter P, Jones S. A clinically validated DNA microarray for high-resolution HER2 testing defines a new genomic subtype in high-risk breast cancer with equivocal results by IHC and FISH. Cancer Res. 2017;77:9. [Google Scholar]
- 11.Harbeck N, Gnant M. Breast cancer. Lancet. 2017;389:1134–1150. doi: 10.1016/S0140-6736(16)31891-8. [DOI] [PubMed] [Google Scholar]
- 12.Kulasingam V, Diamandis EP. Strategies for discovering novel cancer biomarkers through utilization of emerging technologies. Nat Clin Pract Oncol. 2008;5:588–599. doi: 10.1038/ncponc1187. [DOI] [PubMed] [Google Scholar]
- 13.Szasz AM, Lanczky A, Nagy A, Forster S, Hark K, Green JE, Boussioutas A, Busuttil R, Szabo A, Gyorffy B. Cross-validation of survival associated biomarkers in gastric cancer using transcriptomic data of 1,065 patients. Oncotarget. 2016;7:49322–49333. doi: 10.18632/oncotarget.10337. [DOI] [PMC free article] [PubMed] [Google Scholar]
- 14.Gentleman RC, Carey VJ, Bates DM, Bolstad B, Dettling M, Dudoit S, Ellis B, Gautier L, Ge Y, Gentry J, Hornik K, Hothorn T, Huber W, Iacus S, Irizarry R, Leisch F, Li C, Maechler M, Rossini AJ, Sawitzki G, Smith C, Smyth G, Tierney L, Yang JY, Zhang J. Bioconductor: open software development for computational biology and bioinformatics. Genome Biol. 2004;5:R80. doi: 10.1186/gb-2004-5-10-r80. [DOI] [PMC free article] [PubMed] [Google Scholar]
- 15.Ashburner M, Ball CA, Blake JA, Botstein D, Butler H, Cherry JM, Davis AP, Dolinski K, Dwight SS, Eppig JT, Harris MA, Hill DP, Issel-Tarver L, Kasarskis A, Lewis S, Matese JC, Richardson JE, Ringwald M, Rubin GM, Sherlock G. Gene ontology: tool for the unification of biology. The gene ontology consortium. Nat Genet. 2000;25:25–29. doi: 10.1038/75556. [DOI] [PMC free article] [PubMed] [Google Scholar]
- 16.Du J, Yuan Z, Ma Z, Song J, Xie X, Chen Y. KEGG-PATH: Kyoto encyclopedia of genes and genomes-based pathway analysis using a path analysis model. Mol Biosyst. 2014;10:2441–2447. doi: 10.1039/c4mb00287c. [DOI] [PubMed] [Google Scholar]
- 17.Szklarczyk D, Franceschini A, Wyder S, Forslund K, Heller D, Huerta-Cepas J, Simonovic M, Roth A, Santos A, Tsafou KP, Kuhn M, Bork P, Jensen LJ, von Mering C. STRING v10: protein-protein interaction networks, integrated over the tree of life. Nucleic Acids Res. 2015;43:D447–452. doi: 10.1093/nar/gku1003. [DOI] [PMC free article] [PubMed] [Google Scholar]
- 18.Muetze T, Goenawan IH, Wiencko HL, Bernal-Llinares M, Bryan K, Lynn DJ. Contextual hub analysis tool (CHAT): a cytoscape app for identifying contextually relevant hubs in biological networks. F1000Res. 2016;5:1745. doi: 10.12688/f1000research.9118.2. [DOI] [PMC free article] [PubMed] [Google Scholar]
- 19.Hou GX, Liu P, Yang J, Wen S. Mining expression and prognosis of topoisomerase isoforms in non-small-cell lung cancer by using Oncomine and Kaplan-Meier plotter. PLoS One. 2017;12:e0174515. doi: 10.1371/journal.pone.0174515. [DOI] [PMC free article] [PubMed] [Google Scholar]
- 20.Tang Z, Li C, Kang B, Gao G, Li C, Zhang Z. GEPIA: a web server for cancer and normal gene expression profiling and interactive analyses. Nucleic Acids Res. 2017 doi: 10.1093/nar/gkx247. [Epub ahead of print] [DOI] [PMC free article] [PubMed] [Google Scholar]
- 21.Gao J, Aksoy BA, Dogrusoz U, Dresdner G, Gross B, Sumer SO, Sun Y, Jacobsen A, Sinha R, Larsson E, Cerami E, Sander C, Schultz N. Integrative analysis of complex cancer genomics and clinical profiles using the cBioPortal. Sci Signal. 2013;6:pl1. doi: 10.1126/scisignal.2004088. [DOI] [PMC free article] [PubMed] [Google Scholar]
- 22.Flynn R. Survival analysis. J Clin Nurs. 2012;21:2789–2797. doi: 10.1111/j.1365-2702.2011.04023.x. [DOI] [PubMed] [Google Scholar]
- 23.Landi MT, Dracheva T, Rotunno M, Figueroa JD, Liu H, Dasgupta A, Mann FE, Fukuoka J, Hames M, Bergen AW, Murphy SE, Yang P, Pesatori AC, Consonni D, Bertazzi PA, Wacholder S, Shih JH, Caporaso NE, Jen J. Gene expression signature of cigarette smoking and its role in lung adenocarcinoma development and survival. PLoS One. 2008;3:e1651. doi: 10.1371/journal.pone.0001651. [DOI] [PMC free article] [PubMed] [Google Scholar]
- 24.Hasan AN, Ahmad MW, Madar IH, Grace BL, Hasan TN. An in silico analytical study of lung cancer and smokers datasets from gene expression omnibus (GEO) for prediction of differentially expressed genes. Bioinformation. 2015;11:229–235. doi: 10.6026/97320630011229. [DOI] [PMC free article] [PubMed] [Google Scholar]
- 25.Cooper CS, Campbell C, Jhavar S. Mechanisms of disease: biomarkers and molecular targets from microarray gene expression studies in prostate cancer. Nat Clin Pract Urol. 2007;4:677–687. doi: 10.1038/ncpuro0946. [DOI] [PubMed] [Google Scholar]
- 26.Scherzer CR, Eklund AC, Morse LJ, Liao Z, Locascio JJ, Fefer D, Schwarzschild MA, Schlossmacher MG, Hauser MA, Vance JM, Sudarsky LR, Standaert DG, Growdon JH, Jensen RV, Gullans SR. Molecular markers of early Parkinson’s disease based on gene expression in blood. Proc Natl Acad Sci U S A. 2007;104:955–960. doi: 10.1073/pnas.0610204104. [DOI] [PMC free article] [PubMed] [Google Scholar]
- 27.Wairagu PM, Phan AN, Kim MK, Han J, Kim HW, Choi JW, Kim KW, Cha SK, Park KH, Jeong Y. Insulin priming effect on estradiol-induced breast cancer metabolism and growth. Cancer Biol Ther. 2015;16:484–492. doi: 10.1080/15384047.2015.1016660. [DOI] [PMC free article] [PubMed] [Google Scholar]
- 28.De Santi M, Annibalini G, Barbieri E, Villarini A, Vallorani L, Contarelli S, Berrino F, Stocchi V, Brandi G. Human IGF1 pro-forms induce breast cancer cell proliferation via the IGF1 receptor. Cell Oncol (Dordr) 2016;39:149–159. doi: 10.1007/s13402-015-0263-3. [DOI] [PubMed] [Google Scholar]
- 29.O’Brien KM, Cole SR, Engel LS, Bensen JT, Poole C, Herring AH, Millikan RC. Breast cancer subtypes and previously established genetic risk factors: a bayesian approach. Cancer Epidemiol Biomarkers Prev. 2014;23:84–97. doi: 10.1158/1055-9965.EPI-13-0463. [DOI] [PMC free article] [PubMed] [Google Scholar]


