Abstract
Objective: To determine the effects of H19 gene on the proliferation and invasion of A375 human melanoma cells. Methods: A375 cells were infected with a lentiviral vector overexpressing H19 or transfected with H19 RNA interference constructs. The proliferation and invasion of A375/H19+ cells were measured by MTT cell viability and transwell assays, respectively. The mRNA and protein expression levels of matrix metalloproteinase 2 (MMP2) and MMP9 were measured by quantitative PCR (qPCR) and Western blotting, respectively, and the protein expression of Akt, phosphorylated Akt (p-Akt), Slug and E-cadherin were examined by Western blot analysis. Results: The optical density value of A375/H19+ cells increased after incubation with MTT reagent for 12 h (P < 0.05), and the transwell assay showed that the average penetration rate of A375/H19+ cells significantly increased (P < 0.001). The expression levels of MMP2 and MMP9 were significantly increased in A375/H19+ cells, as determined by qPCR and Western blotting (P < 0.001). Moreover, A375/H19+ cells had upregulated levels of Slug and p-Akt and downregulated E-cadherin (P < 0.001). The weight and volume of A375/H19+ cell xenografts in nude mice were significantly increased, but its inhibition rate was smaller (P < 0.05 and P < 0.001, respectively). Conclusions: The results of this study showed that H19 overexpression promoted the proliferation, invasion, and growth of A375 cells. In addition, it upregulated the mRNA and protein expression levels of MMP2 and MMP9, which in turn promoted cell invasion. Furthermore, H19 appeared to enhance Akt phosphorylation, directly suppress E-cadherin, and upregulate Slug expression to promote A375 cell invasion.
Keywords: H19, proliferation, invasion, human melanoma
Introduction
Cutaneous melanoma (CM) is the most lethal form of skin cancer, and its incidence has continued to increase worldwide. The incidence of CM ranges from 0.5 and 1.1 per 100,000 people in Asia and Africa, respectively, to 8.6, 13.8, and 29.8 per 100,000 people in Europe, North America, and Oceania, respectively [1]. Excessive exposure to ultraviolet (UV) is one clear cause of melanoma, as UV rays can burn the skin and induce DNA mutations. Both ultraviolet A (UVA) and ultraviolet B (UVB) can damage the skin and cause melanoma. In particular, UVB radiation is considered to be the main cause of sunburn and skin cancer as it destroys melanocytes and induces pathogenesis; UVA can suppress certain functions of the immune system and accelerate the formation of tumors [2]. Individuals with a large number of ordinary or dysplastic nevi or with a family history of skin cancer are believed to be at high risk of melanoma [3]; however, the reasons for this higher incidence remain unclear. In its early stages, CM can be treated with surgical excision, but its marked metastatic potential and resistance to current treatments pose a therapeutic challenge to clinicians [4]. Due to the poor prognosis and lack of effective therapeutic options for patients with metastases, much effort has been made to determine the etiology and pathogenesis of melanoma and its biological targets.
The H19 gene, which transcribes a long non-coding RNA (lncRNA), is a maternally expressed imprinted gene that plays a vital role in mammalian development [5]. High H19 expression has been observed during embryogenesis, but the transcripts are not expressed in most tissues after birth, with the exception of the heart and skeletal muscle [6]. H19 is also highly expressed in the majority of human cancers, including breast, colon, liver, and gastric cancers [7], and correlates with a poor prognosis [8]. However, little is known about the role of H19 in the proliferation and invasion of melanoma.
The purpose of this study was to determine the effects of H19 on the proliferation and invasion of melanoma cells upon infection of human melanoma A375 cells with a lentiviral vector overexpressing H19.
Materials and methods
Cell lines and culture
The A375 human melanoma and 293T packaging cell lines were purchased from the cell bank of the Chinese Academy of Science (Shanghai, China) and cultured in RPMI-1640 Medium and Dulbecco’s Modified Eagle Medium (Gibco Life Technologies, Carlsbad, CA, USA) supplemented with 10% fetal bovine serum (Takara Co., Dalian, China) and 1% penicillin-streptomycin (100 μg/mL; Invitrogen Life Technologies, Beijing, China) at 37°C with 5% CO2.
Construction of the H19 lentiviral overexpression vector and lentivirus packaging system
According to the reported nucleotide sequences of human gene H19 (Gene ID: 283120), the target DNA gene fragment was subcloned into the pHBLV-CMVIE-ZsGreen-Puro lentiviral vector (Hanbio Biotechnology, Shanghai, China) to construct a lentiviral vector overexpressing H19 (pHBLV-CMVIE-ZsGreen-Puro-H19). The H19 fragment was identified using a PCR Kit (Promega, Madison, WI, USA) according to the manufacturer’s instructions, with double digestion performed using EcoRI and BamHI enzymes followed by DNA sequencing. HEK 293T cells in the exponential growth phase were seeded onto 10 cm cell culture dishes at a density of 2-2.5 × 10⁶ cells/dish. Approximately 1,800 mL of the lentiviral vector packaging system was added to cells at a density of 60-70%. After the supernatant was collected, the high concentration of lentivirus was used to infect the 293T cells. The ratio of positive cells was determined by flow cytometry, and the virus titer was detected using a double dilution assay.
Lentiviral transfection of A375 cells
A375 cells in the exponential growth phase were seeded onto 24-well culture plates at a density of 3-5 × 10⁴ cells/well. The viral supernatants with pHBLV-CMVIE-ZsGreen-Puro-H19 and green fluorescent protein (GFP) were added respectively to cells at a density of 70-80%. After 72 h, the transfection ratio was determined by fluorescence microscopy. Cells with a transfection ratio > 80% were used as the target cells.
Knockdown of the H19 gene in A375 cells via CRISPR/Cas9
Specific target genes were selected as follows: Upstream, Target-1: GACTCTGGAATCCGGGCTGT; Target-2: GGACTCTGGAATCCGGGCTG; Downstream: Target-3: GTCCGGTGGACGTGACAAGC; and Target-4: GGCCAAGACGCCAGGTCCGG (http://crispr.mit.edu/). The px458-H19-T4 vector (Takara) was constructed as follows: Positive, caccGGCCAAGACGCCAGGTCCGG; Negative, aaacCCGGACCTGGCGTCTTGGCC using a CRISPR/Cas9 Kit (Invitrogen Tech. Co., Beijing, China), according to the manufacturer’s instructions. Then specific plasmids were purified using the PureLinkTM HiPure Plasmid FP (Filter and Precipitator) Maxiprep Kit (Invitrogen, Grand Island, NY, USA). The screening of transfection reagents was conducted in 96-well plates using Lipofectamine® 3000 Reagent (ThermoFisher Scientific Inc, Shanghai, China). One day prior to transfection, adherent cells were plated onto 24-well plates at a density of 0.4 to 1.5 × 10⁵ cells per well in 500 mL growth medium so that the cells were 40-70% confluent at the time of transfection. The ratio of positive cells was determined by flow cytometry, and the virus titer was detected using a double dilution assay. The transfected GFP-positive cells were selected by methods of recovery and dilution, and plated into 10 cm culture dishes, with observing cell clone obviously. The A375 cells clones propagated in a 96-well plate, and then were transferred to a 6-well plate. Lastly, the loci of target genes were amplified with a PCR Kit (Promega) according to the manufacturer’s instructions, followed by DNA sequencing. Four experimental groups of cells were used: Group 1 (control group, A375), Group 2 (empty vector group, A375/GFP), Group 3 (H19 overexpression group, A375/H19+), and Group 4 (H19 knockdown, A375/H19-). All experiments were performed in triplicate at a minimum.
MTT assay
Four groups of cells at a volume of 200 µL/well (approximate density: 1 × 10⁵ cells/mL) were seeded onto 96-well plates. At time points of 0, 12, 24, 48, 56, and 68 h, 20 mL MTT (working concentration: 5 mg/mL) was added. The optical density (OD) value of the cells was determined by spectrophotometry at a wavelength of 490 nm (GE Healthcare, Uppsala, Sweden).
Transwell® invasion assay
Transwell® filters (Costar, Sigma, St. Louis, MO, USA) were coated with Matrigel® (3.9 μg/μL, 60-80 μL). Four groups of cells were re-suspended in 100 μL serum-free RPMI-1640 medium and added to the upper compartment of the chambers. The cells migrating from the Matrigel® into the pores of the inserted filter were fixed in 100% methanol and stained with hematoxylin. Positive cells in four randomly selected visual fields were counted.
Quantitative polymerase chain reaction
Quantitative PCR (qPCR) was used to quantify differences in matrix metalloproteinase 2 (MMP2) and MMP9 mRNA expression levels among the four groups. Total RNA was extracted using TRIzol reagent (TaKaRa Bio Inc., Japan), following the manufacturer’s instructions. In this procedure, we used the prepared cDNA, Power SYBR Green Master Mix (Applied Biosystems, Cheshire, UK), and primers for human MMP2, MMP9, and β-actin genes (1:1,000, Cell Signaling Technology, Danvers, MA, USA). All experiments were repeated three times. The primer sequences used are listed in Table 1. Each PCR reaction contained 0.5 mL SYBR green, 20.5 mL molecular grade water, 2 mL of each forward and reverse primer, and 2 mL cDNA. Amplification was performed using the following conditions: 94°C for 4 min, 94°C for 20 s, 60°C for 30 s, and 35 cycles at 72°C for 30 s. These signals were determined at 72°C. qPCR was performed under standard conditions, and all of the experiments were conducted in triplicate. Relative MMP2 and MMP9 mRNA expression levels were compared among the four groups. qPCR data were analyzed using the comparative cycle threshold (CT) method [9]. A difference in CT (ΔCT) was determined as the difference in MMP2 and MMP9 mRNA expression levels among the different groups. ΔΔCT was calculated by calculating the difference between the A375/H19+ group and the other three groups.
Table 1.
Primer sequences
| Gene | Forward/reverse | Primer sequence | Product size (bp) |
|---|---|---|---|
| MMP-2 | forward | 5’-TTTGACGGTAAGGACGGACTC-3’ | 146 |
| reverse | 5’-TACTCCCCATCGGCGTTC-3’ | ||
| MMP-9 | forward | 5’-CCGGACCAAGGATACAGTTTG-3’ | 179 |
| reverse | 5’-TCAGGGCGAGGACCATAGAG-3’ | ||
| β-actin | forward | 5’-TGACGTGGACATCCGCAAAG-3’ | 205 |
| reverse | 5’-CTGGAAGGTGGACAGCGAGG-3’ |
Note: MMP: Matrix metalloproteinases.
Western blot analysis
Total protein was extracted from the four groups of cells. Approximately 30 μg protein was subjected to sodium dodecyl sulfate-polyacrylamide gel electrophoresis followed by electrophoretic transfer to nitrocellulose membranes (Whatman, Sigma). The membranes were incubated with primary antibodies against MMP2 and MMP9 (1:800 dilution; Cell Signaling Technology). The antigen-antibody reaction was visualized using ultra-enhanced chemiluminescence Western blotting detection reagents (Sigma). Moreover, protein expression levels of Akt (1:1,000; Cell Signaling Technology), phosphorylated Akt (p-Akt) (1:1,000, Cell Signaling Technology), Slug, and E-cadherin (1:1,000, Sigma) were measured at 24 h and 48 h in A375/H19+ and the other three groups by Western blot analysis respectively. The expression of β-actin (1:5,000, Abcam, Cambridge, UK) was used as the internal reference.
Effects of H19 gene on the growth of xenograft tumors in nude mice
BALB/C nude mice (6-8 weeks old) from the National Institutes for Food and Drug Control Laboratory Animal Center (Beijing, China) were bred and kept under standard pathogen-free conditions. All animal studies were performed in accordance with institutional guidelines under the approved protocols by The First Hospital of Harbin Animal Research Ethics Committee (Harbin, China) and the license number is SCXK(Jing)2014-0004. Xenografts were initiated by subcutaneous injection of 2 × 10⁷ A375 cells in 200 μL phosphate-buffered saline (PBS) into the right flank near the axillary fossa. The mice were euthanized when the longest diameter of the tumor reached 10 mm, after which the tumor was aseptically dissected and mechanically minced. Then 2 mm3 pieces of tumor tissue were transplanted into the right flank near the axillary fossa of mice. Tumors were measured every 3 days with calipers. When the longest tumor diameter was 1.5 cm, mice were randomly assigned to one of four experimental groups. The weight and volume of tumors were estimated, and the inhibition rates of tumor growth were subsequently calculated. (Inhibition Rates) = (Mean volume of control group-Actual group mean volume)/Mean volume of control group × 100%.
Statistical analysis
The data were analyzed using SPSS software version 11.5 (SPSS Inc., Chicago, IL, USA). One-way analysis of variance (ANOVA) was conducted to investigate differences within groups for quantitative variables, and the Dunnett’s method was used for multiple comparisons. P values < 0.05 were considered statistically significant, and those < 0.01 were deemed highly significant.
Results
Construction of the H19 overexpression lentiviral vector and cell transfection
The pHBLV-CMVIE-ZsGreen-Puro-H19 was constructed and identified by PCR and DNA sequencing. PCR analysis showed a single band of approximately 2.3 kDa in size on a 1% agarose gel (Figure 1). DNA sequencing confirmed that the recombinant plasmid contained the H19 gene fragment. The pHBLV-CMVIE-ZsGreen-Puro-H19 vector with a virus titer of 2.0 × 10⁸ TU/mL was used to transfect the human melanoma A375 cells. Visualization of green fluorescence in the infected cells under fluorescence optics indicated successful transfection (Figure 2).
Figure 1.
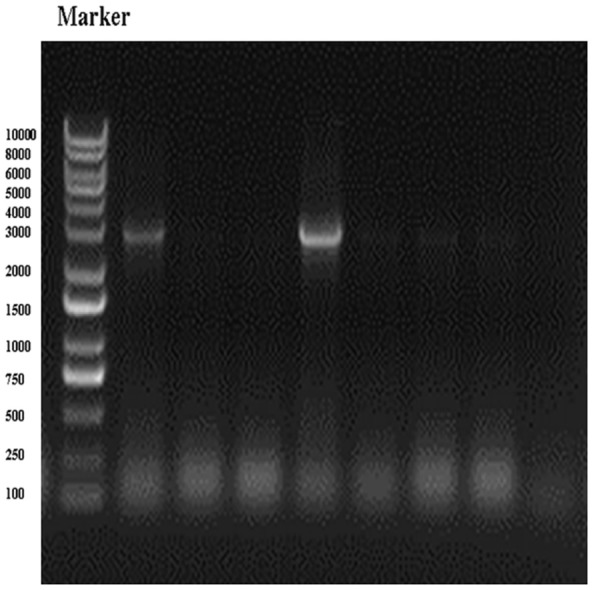
PCR products of the homeodomain overexpression lentiviral vector (pHBLV-CMVIE-ZsGreen-Puro) on 1% agarose gel electrophoresis. Expression of pHBLV-CMVIE-ZsGreen-Puro-H19 was constructed and identified by PCR with double digestion using the endonucleases EcoRI and BamHI. A single fragment was visualized as a band of approximately 2.3 kDa in size. M: marker: Fermentas SM0331.
Figure 2.
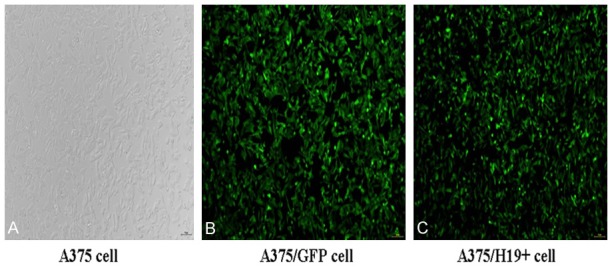
Transfection ratio of pHBLV-CMVIE-ZsGreen-Puro-H19 in A375 cells. Expression of green fluorescence observed in A375 cells confirmed successful transfection. A: Untransfected A375 cells (A375); B: A375 cells transfected with GFP (A375/GFP); C: A375 cells transfected with pHBLV-CMVIE-ZsGreen-Puro-H19 (A375/H19+) (magnification: 200 ×).
Knockdown of H19 gene in A375 cells using CRISPR/Cas9
After knockdown of H19 in A375 cell with using CRISPR/Cas9, the loci of H19 genes were constructed and identified by PCR and DNA sequencing. PCR analysis showed the fragments of the sixth and eighth cell clones target regions were deleted with larger deletions in a 1% agarose gel, and these cell clones were sequenced to further detect the target fragments of mutations (Figure 3). DNA sequencing confirmed that the positive cell clones of H19 gene were selected. We also found that one allele was missing 1215 bases and the other allele was missing 1356 bases.
Figure 3.
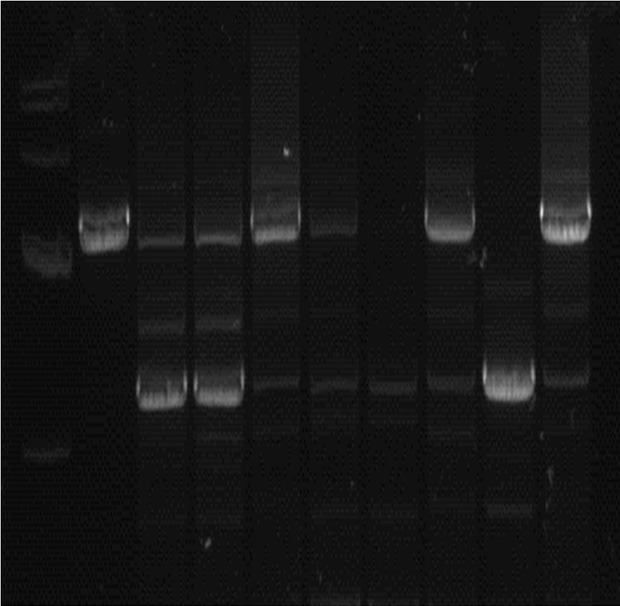
Construction of knockdown of H19 in A375 cells using CRISPR/Cas9. PCR analysis showed the fragments of the sixth and eighth cell clones target regions were deleted with larger deletions in a 1% agarose gel, and these cell clones were sequenced to further detect the target fragments of mutations.
H19 promotes the proliferation of A375 cells
To study the effects of H19 on the proliferation of A375 cells, the cell viability of transfected and untransfected A375 cells was measured at 0, 12, 24, 48, 56, and 68 h using the MTT method. As shown in Figure 4 and Table 2, the OD value of the A375/H19+ cells was higher than that of the A375/GFP, A375, and A375/H19- cells after culturing for 12 h (P < 0.05), and the difference was more obvious with longer culture times (P < 0.01 for 24, 48, 56, and 68 h). No statistical differences were observed at various time points between the A375/GFP and A375 cells (P > 0.05). These results suggested that H19 could promote the proliferation of A375 cells.
Figure 4.
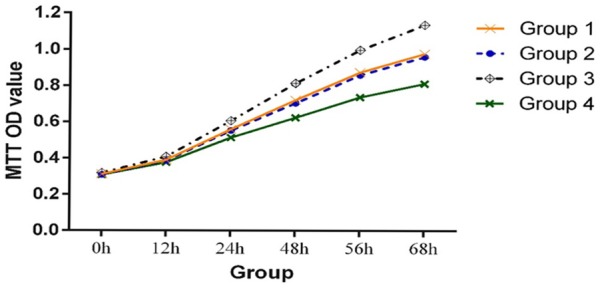
Comparison of OD values among the four groups of A375 cells by the MTT assay. The OD value of A375/H19+ cells was higher than that of A375/GFP, A375, and A375/H19- cells at 24, 48, 56, and 68 h after transfection (P < 0.01).
Table 2.
OD of the four groups of A375 cells following culture for 12, 24, 48, 56, and 68 h
| Optical density | ||||||
|---|---|---|---|---|---|---|
|
|
||||||
| 0 h | 12 h | 24 h | 48 h | 56 h | 68 h | |
| Group 1 | 0.312 | 0.391 | 0.560 | 0.721 | 0.874 | 0.977 |
| Group 2 | 0.309 | 0.387 | 0.553 | 0.704 | 0.859 | 0.960 |
| Group 3 | 0.319 | 0.409 | 0.607 | 0.814 | 0.997 | 1.136 |
| Group 4 | 0.309 | 0.377 | 0.514 | 0.623 | 0.737 | 0.812 |
| P1vs2 | 0.798 | 0.898 | 0.824 | 0.717 | 0.841 | 0.937 |
| P1vs3 | 0.174 | 0.041 | 0.005 | 0.003 | 0.002 | 0.007 |
| P1vs4 | 0.734 | 0.136 | 0.005 | 0.002 | 0.001 | 0.005 |
Statistical difference was analyzed with the paired-samples t-test from 12 h to 68 h. The OD value of the A375/H19+ cells was higher than that of the A375/GFP, A375, and A375/H19- cells after culturing for 12 h (P < 0.05), and the difference was more apparent with longer culture times (P < 0.01 for 24, 48, 56, and 68 h).
The effects of H19 on the invasive capacity of A375 cells
We examined the effects of H19 on the invasive capacity of A375 cells by using the transwell migration assay in which transwell chambers were coated with Matrigel. Cells with invasive ability digest the Matrigel and penetrate the 8 μm pores of the polycarbonate membrane. A higher number of A375/H19+ cells penetrated the Matrigel compared to the A375/GFP, A375, and A375/H19- cells (Figure 5A). The average penetration rate of the A375/H19+ cells (563 ± 73) was significantly higher than that of the A375/GFP (314 ± 71), A375 (378 ± 62), and A375/H19- cells (158 ± 22) (P < 0.001). No statistical difference in the average penetration rate between the A375/GFP and A375 cells was observed (P = 0.3635, Figure 5B).
Figure 5.
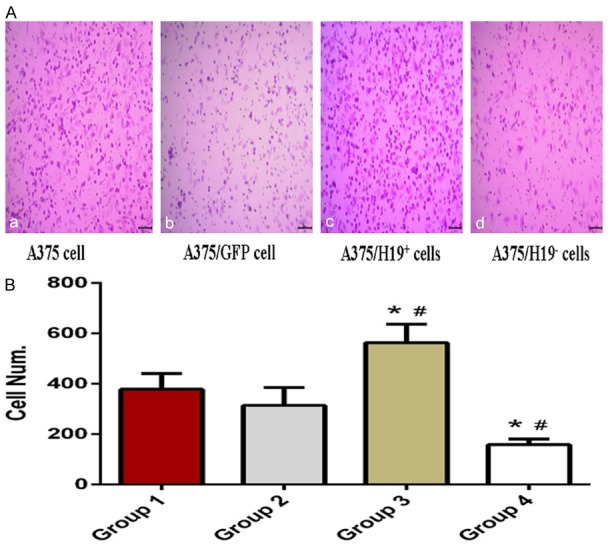
Transwell invasion assay shows the penetration rates of the four groups of A375 cells. More cells penetrated the Matrigel in the A375/H19+ group compared to the A375/GFP, A375, and A375/H19- groups (A: a: A375 cells; b: A375/GFP cells; c: A375/H19+ cells; d: A375/H19- magnification: 400 ×); B. The average penetration rate/cell number of A375/H19+ cells was significantly higher than that of the A375/GFP, A375, and A375/H19- cells (P < 0.001).
The effects of H19 on MMP2 and MMP9 expression levels
The mRNA expression levels of MMP2 and MMP9 increased in the transfected and untransfected A375 cells, as indicated by qPCR. Figure 6 shows that the mRNA expression level of MMP2 and MMP9 significantly increased in the A375/H19+ cells (0.038 ± 0.001 and 0.004 ± 0.000). The expression was markedly higher than that of A375/GFP (0.027 ± 0.001 and 0.002 ± 0.000, respectively), A375 (0.024 ± 0.001 and 0.001 ± 0.000, respectively), and A375/H19- cells (0.018 ± 0.001 and 0.001 ± 0.000, respectively) after 48 h of transfection, with a significant difference observed between the A375/H19+ and A375/GFP cells (P < 0.001) and between the A375/H19+ and A375 cells (P < 0.001). A significant difference was also observed between the A375/H19- and A375/GFP cells (P < 0.001) and between the A375/H19- and A375 cells (P < 0.001) using one-way ANOVA. However, no statistical difference between A375/GFP and A375 cells was detected (Figure 6: P > 0.05). To further confirm the effects of H19 on MMP2 and MMP9 protein expression, Western blot analysis was performed (Figure 7A). In the A375/H19+ cells, MMP2 and MMP9 expression markedly increased. In addition, significant differences were observed between A375/H19+ or A375/H19- and the other two groups of cells (A375/H19+ vs. A375/GFP: P < 0.001 for MMP2, P < 0.001 for MMP9; A375/H19+ vs. A375: P < 0.001 for MMP2, P < 0.001 for MMP9; A375/H19- vs. A375/GFP: P < 0.001 for MMP2, P < 0.001 for MMP9; A375/H19- vs. A375: P < 0.001 for MMP2, P < 0.001 for MMP9). No statistically significant difference was observed between the A375/GFP and A375 cells (P = 0.3936 for MMP2, P = 0.3388 for MMP9; Figure 7B).
Figure 6.
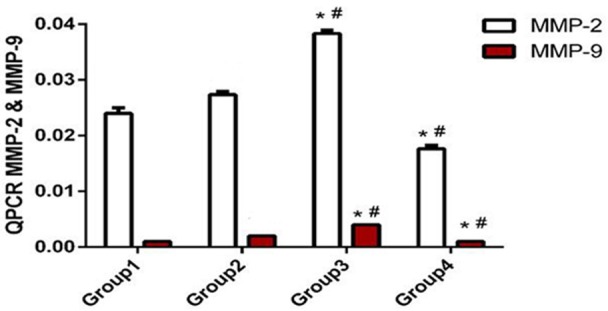
Effects of H19 on MMP2 and MMP9 mRNA expression. MMP2 and MMP9 mRNA expression was examined by qPCR. MMP2 and MMP9 mRNA expression was markedly increased in the A375/H19+ cells, with a significant difference observed between the A375/H19+ and A375/GFP cells (P < 0.001) and between the A375/H19+ and A375 cells (P < 0.001). A significant difference was also detected between the A375/H19- and A375/GFP cells (P < 0.001) and between the A375/H19- and A375 cells (P < 0.001) using one-way ANOVA.
Figure 7.
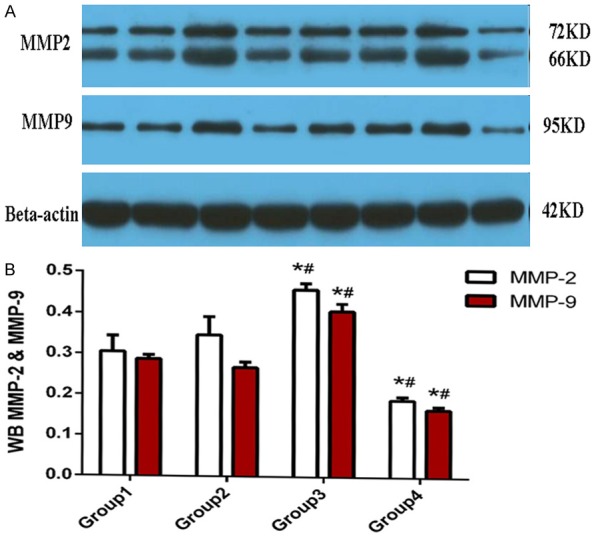
Effects of H19 on MMP2 and MMP9 protein expression. A. MMP2 and MMP9 protein expression was examined by Western blot analysis. B. MMP2 and MMP9 expression was markedly increased in A375/H19+ cells, with significant differences observed between the A375/H19+ or A375/H19- and the other two groups of cells (P < 0.001). There were four specimens in every group: A375/H19- (lanes 4-1 and 4-2); A375/H19+ (lanes 3-1 and 3-2); A375/GFP (lanes 2-1 and 2-2); A375 (lanes 1-1 and 1-2).
The effects of H19 on activation of the Akt pathway and the epithelial-mesenchymal transition
We used Western blot analysis to determine if H19 exerts its effects in A375 cells via the Akt signaling pathway (Figure 8A). Figure 8 shows that the level of p-Akt significantly increased in the A375/H19+ cells, and was markedly higher (0.575 ± 0.08) than that in the other three groups of cells (A375: 0.348 ± 0.017; A375/GFP: 0.357 ± 0.014; A375/H19-: 0.122 ± 0.033) at 48 h after transfection, with a significant difference detected between A375/H19+ and A375/GFP or A375 cells, and between A375/H19- and A375/GFP or A375 cells (Figure 8B: P < 0.001 and P < 0.001, respectively). No statistically significant difference in Akt observed between A375/H19+ and other groups of cells at 48 h after transfection (P > 0.05). The epithelial-mesenchymal transition (EMT) regulates transcription factors including Slug and E-cadherin. Figure 8 shows that Slug significantly increased in the A375/H19+ cells, and was markedly higher (0.436 ± 0.020) than expression in the other groups of cells (A375: 0.325 ± 0.012; A375/GFP: 0.323 ± 0.009; A375/H19- cells: 0.179 ± 0.022) at 48 h after transfection (Figure 8B: P < 0.001). Conversely, E-cadherin was significantly reduced in A375/H19+ cells, and its expression (0.197 ± 0.026) was markedly lower than that of other groups of cells (A375: 0.372 ± 0.007; A375/GFP: 0.376 ± 0.014; A375/H19- cells: 0.536 ± 0.016) at 48 h after transfection (Figure 8B: P < 0.001). No statistically significant difference in the levels of Slug and E-cadherin was detected between the A375 and A375/GFP cells at 48 h after transfection (P > 0.05; Figure 8B).
Figure 8.
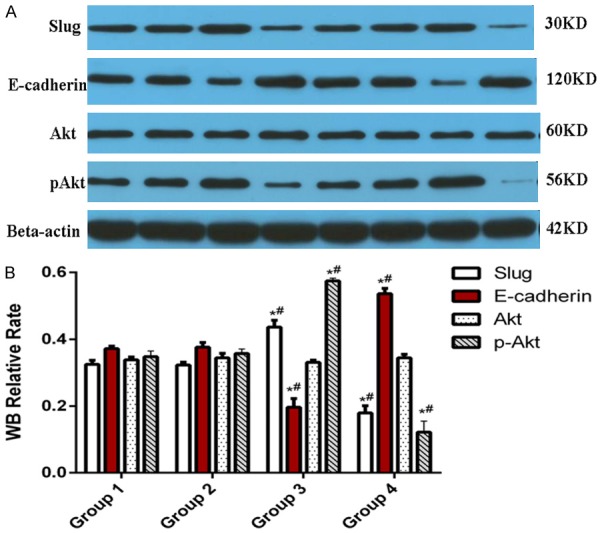
Effects of H19 on activation of the Akt pathway and Slug/E-cadherin expression. A. Protein expression of Akt, p-Akt, Slug, and E-cadherin were assessed by Western blot analysis. B. Expression of p-Akt in A375/H19+ cells at 48 h after transfection was significantly different between A375/H19+ and A375/GFP or A375 cells, and between A375/H19- and A375/GFP or A375 cells (P < 0.001; P < 0.001, respectively). B. Expression of Slug in A375/H19+ cells was markedly higher than that in the other three group cells at 48 h after transfection (B: P < 0.001). B. Expression of E-cadherin in the A375/H19+ cells was markedly lower than that in the other three group cells at 48 h after transfection (B: P < 0.001). There were four specimens in every group: A375/H19- (lanes 4-1 and 4-2); A375/H19+ (lanes 3-1 and 3-2); A375/GFP (lanes 2-1 and 2-2); A375 (lanes 1-1 and 1-2).
H19 promotes the growth of xenografts in nude mice in vivo
The weight and volume and tumor growth inhibition rates of nude mice xenografts with the four cell types are listed in Table 3. Xenografts of A375/H19+ cells were significantly larger than those of A375, A375/GFP, and A375/H19- cells with regard to weight (P = 0.0062) and volume (P = 0.0421). No statistically significant difference was found in the weight and volume of xenografts between A375 and A375/GFP cells (P > 0.05). Furthermore, xenografts of A375/H19+ cells were significantly smaller than those of A375, A375/GFP, and A375/H19- cells with regard to tumor growth inhibition rates (P < 0.001). No statistically significant difference was found regarding the inhibition rates of xenografts between A375 and A375/GFP cells (P > 0.05). These results suggested that H19 promoted the growth of xenografts in nude mice in vivo.
Table 3.
Effects of H19 on the weight and volume and tumor growth inhibition rates of xenografts in four kinds of nude mice
| Mean ± standard deviation | F value | P value | ||||
|---|---|---|---|---|---|---|
|
| ||||||
| Group 1 | Group 2 | Group 3 | Group 4 | |||
| Weight | 1.057 (0.316) | 1.131 (0.122) | 1.342 (0.142) | 0.755 (0.207) | 8.94 | 0.0062 |
| Volume | 1182.703 (303.625) | 1044.913 (205.760) | 1503.243 (248.010) | 786.933 (218.649) | 4.38 | 0.0421 |
| Inhibition rate | 0.000 (0.000) | 4.040 (1.085) | -29.283 (2.075) | 29.233 (4.550) | 263.41 | < 0.001 |
Xenografts of A375/H19+ cells were significantly larger than those of A375, A375/GFP, and A375/H19- cells in weight (P = 0.0062) and volume (P = 0.0421). Furthermore, xenografts of A375/H19+ cells were significantly smaller than those of A375, A375/GFP, and A375/H19- cells with regard to tumor growth inhibition rates (P < 0.001).
Discussion
CM is one of the most potentially dangerous forms of melanoma, accounting for approximately 90% of skin cancer-related deaths [10]. The 5- and 10-year relative survival rates for melanoma patients are 91% and 89%, respectively [11]. CM is a malignancy with one of the highest dissemination potentials to distant organ sites, including the lung, liver, and brain [12]. Thus, once melanoma metastasizes, prognosis is often poor, and therapeutic options are limited. In addition, the prognosis of CM is poor because some factors are strongly correlated with tumor cell proliferation and invasion. In recent years, special attention has been paid to long non-coding RNA (lncRNA) H19 and its participation in the migration process of cancer cells. Therefore, in this study, H19 was chosen as a novel biological marker to explore its roles in the proliferation and invasion of melanoma.
First, we observed the effects of H19 on the proliferation of A375 cells. The MTT assay showed that the OD value of A375/H19+ cells was markedly higher than that of A375/GFP, A375, and A375/H19- cells after culturing for 12 h, and the difference was more apparent with longer culture times. Knockdown of H19 using a targeted CRISPR reduced A373 cell proliferation. These results suggest that H19 promotes the proliferation of A375 cells. H19 is a maternally imprinted gene located at chromosome 11p15.5 that encodes a 2.3 kb lncRNA, which was widely studied in cancer biology even before lncRNAs had gained the attention of cancer researchers. Some researchers have found that H19 overexpression contributes to cell proliferation through the upregulation of miR-675, which results in induction of the angiogenesis inhibitor ISM1 and calcium-binding protein CALN1 genes [13]. Furthermore, recent emerging studies have suggested dual roles for H19 as a tumor suppressor and oncogene [14]. Zhu et al. [15] found that the ectopic expression of H19 increased ovarian cancer cell proliferation. Feng et al. [16] also demonstrated that ectopic expression of H19 increased cell proliferation, whereas H19 siRNA treatment contributed to cell apoptosis in AGS human gastric cancer cell lines. However, some researchers have found that H19 functions as a tumor suppressor in some Wilms’ tumors, embryonic rhabdomyosarcoma, and the Beckwith-Wiedmann cancer predisposing syndrome [17]. These reports indicate that H19 may serve as a therapeutic target for tumors.
We also examined the effects of H19 on the invasive ability of A375 cells by conducting transwell migration assays. We observed that a higher number of A375/H19+ cells penetrated the Matrigel compared to A375/GFP, A375, and A375/H19- cells. The average penetration rate of A375/H19+ was higher than that of the A375/GFP, A375, and A375/H19- cells. Knockdown of H19 using a targeted CRISPR suppressed A375 cell invasion ability. These findings indicated that overexpression of H19 promoted the invasion of A375 cells. Previous studies have demonstrated that lncRNA H19 can act as a molecular ‘sponge’ for miR-let-7b, which inhibits the activity of let-7b and increases the mRNA and protein expression of high-mobility group proteins including c-Myc, Dicer, and Imp3, thereby inducing cell metastasis and invasion in ovarian cancer [18]. The role of H19 in tumorigenesis is controversial, as it has been described as either protumorigenic or as a tumor suppressor depending on the context. Some researchers have found that aflatoxin B1 promotes cell growth and invasion in hepatocellular carcinoma HepG2 cells through its actions on H19 and E2F1 [19]. Conversely, others have demonstrated the tumor suppressor function of H19 in vivo using three different mouse models of tumorigenesis [20]. Moreover, some researchers have found that inhibition of lncRNA H19 and miR-675 promotes migration and invasion of human HCC cells by activating the Akt/GSK-3β/Cdc25A signaling pathway [21].
To explore the mechanism underlying the ability of H19 to promote the invasion of A375 cells, the levels of MMP2 and MMP9 expression were examined by qPCR and Western blot analyses. The results showed that H19 upregulated both the mRNA and protein expression of MMP2 and MMP9 in A375 cells, and H19 knockdown suppressed their expression of MMP2 and MMP9 as well as the invasive ability of the A375 cells. MMPs are a family of enzymes that degrade the extracellular matrix. The activation of these enzymes provides tumor cells access to the vasculature, allows them to invade target organs, and facilitates metastases. Although MMP2 and MMP9 are associated with various types of cancers, the mechanisms underlying their upregulation remain unclear.
We further examined whether H19 plays an important role in A375 cells via the Akt pathways and the EMT by conducting Western blot analyses. We found that H19 overexpression led to the upregulation of Slug and p-Akt and the downregulation of E-cadherin, whereas the opposite results were observed with H19 knockdown. It has been demonstrated that the levels of p-Akt significantly decreased in the presence of H19 siRNA in the transcriptome of the livers of diabetic db/db mice [22]. Furthermore, an increase of p-Akt, which promotes cell malignancy and metabolic regulation [23], suggests that overexpression of H19 constitutively activates Akt in A375 cells. In addition, EMT is envisioned as the loss of epithelial status and sustained apico-basal polarity on cell-cell adhesion molecules to gain mesenchymal traits. EMT transcription factors include Slug, ZEB1, and Twist1. This transition includes the upregulation and downregulation of different proteins responsible for the profound cellular reorganization, resulting in the acquisition of enhanced migratory and invasive properties [24]. Although the number of studies on the tumor analyses of EMT markers is considerable, most common alterations studied within human tumor samples have been related to the loss or aberrant expression of proteins required to maintain the epithelial phenotype and usually involved in cell-cell adhesion, with E-cadherin being one of the strongest markers routinely used in the clinic for cancer diagnosis or progression [25]. Because EMT transcription factors transcriptionally repress the E-cadherin protein, the possibility that H19 lncRNA can induce these EMT transcription factors is an attractive option to explore [26]. Indeed, we showed that Slug induction was largely dependent on H19 RNA in this study. Other researchers have shown that H19 upregulates Slug expression through a mechanism that involves miR-675 in different glioma datasets, which is accompanied by the suppression of the Slug target E-cadherin [27]. It has also been shown that knockdown of H19 results in a concomitant decrease of Slug and increase in the expression of the epithelial cell surface marker E-cadherin, although H19 promoted tumor cell migration and invasion by sponging let-7 [28]. Therefore, we speculated that H19 could enhance Akt phosphorylation and directly suppress E-cadherin and induce Slug to promote A375 cell invasion. Lastly, we found that the weight and volume of xenografts in nude mice in the H19 overexpression group were significantly higher than those of xenografts with untransfected cells, but the tumor growth inhibition rate was lower. These results indicate that H19 overexpression can promote the proliferation, invasion, and growth of A375 cells.
The results of this study showed that H19 promotes cell proliferation and invasion; these findings may be utilized for determining the biological functions of H19 in melanoma. One limitation of this study is that the effects of H19 in patients with melanoma were not included. In the future, we plan to collect and examine clinical samples to confirm the role of H19 in the proliferation and invasion of melanoma. It may also be helpful to determine if H19 may be useful as a novel molecular target for the treatment of this disease.
In conclusion, H19 overexpression promoted the proliferation, invasion, and growth of A375 cells. Moreover, H19 upregulated the mRNA and protein expression levels of MMP2 and MMP9 in A375 cells, which in turn promoted cell invasion. Furthermore, H19 enhanced Akt phosphorylation and directly suppressed E-cadherin and induced Slug to promote A375 cell invasion.
Acknowledgements
The researched project was supported by Health and Family Planning Commission in Heilongjiang province in China (No: 2017-204). We are grateful to all authors who participated in the present study and to our colleagues for their cooperation. We also thank the members of the laboratory of Wei Si Teng Co. in Chongqing City, China for their assistance in conducting this research.
Disclosure of conflict of interest
None.
Abbreviations
- CRISPR
clustered regularly interspaced short palindromic repeats.
References
- 1.Ferlay J, Soerjomataram I, Ervik M, Dikshit R, Eser S, Mathers C, Rebelo M, Parkin D, Forman D, Bray F. Cancer incidence and mortality worldwide: sources, methods and major patterns in GLOBOCAN 2012. Int J Cancer. 2015;136:E359–86. doi: 10.1002/ijc.29210. [DOI] [PubMed] [Google Scholar]
- 2.Guo J, Qin S, Liang J, Lin T, Si L, Chen X, Chi Z, Cui C, Du N, Fan Y, Gu K, Li F, Li J, Li Y, Liang H, Liu J, Lu M, Lu A, Nan K, Niu X, Pan H, Ren G, Ren X, Shu Y, Song X, Tao M, Wang B, Wei W, Wu D, Wu L, Wu A, Xu X, Zhang J, Zhang X, Zhang Y, Zhu H written; Chinese Society of Clinical Oncology (CSCO) Melanoma Panel. Chinese guidelines on the diagnosis and treatment of melanoma (2015 edition) Ann Transl Med. 2015;3:322. doi: 10.3978/j.issn.2305-5839.2015.12.23. [DOI] [PMC free article] [PubMed] [Google Scholar]
- 3.Dasgupta A, Katdare M. Ultraviolet radiation-induced cytogenetic damage in white, hispanic and black skin melanocytes: a risk for cutaneous melanoma. Cancers (Basel) 2015;7:1586–1604. doi: 10.3390/cancers7030852. [DOI] [PMC free article] [PubMed] [Google Scholar]
- 4.Lee N, Barthel SR, Schatton T. Melanoma stem cells and metastasis: mimicking hematopoietic cell trafficking? Lab Invest. 2014;94:13–30. doi: 10.1038/labinvest.2013.116. [DOI] [PMC free article] [PubMed] [Google Scholar]
- 5.Liang WC, Fu WM, Wang YB, Sun YX, Xu LL, Wong CW, Chan KM, Li G, Waye MM, Zhang JF. H19 activates Wnt signaling and promotes osteoblast differentiation by functioning as a competing endogenous RNA. Sci Rep. 2016;6:20121. doi: 10.1038/srep20121. [DOI] [PMC free article] [PubMed] [Google Scholar]
- 6.Kallen AN, Zhou XB, Xu J, Qiao C, Ma J, Yan L, Lu L, Liu C, Yi JS, Zhang H, Min W, Bennett AM, Gregory RI, Ding Y, Huang Y. The imprinted H19 LncRNA antagonizes let-7 microRNAs. Mol Cell. 2013;52:101–112. doi: 10.1016/j.molcel.2013.08.027. [DOI] [PMC free article] [PubMed] [Google Scholar]
- 7.Liang WC, Fu WM, Wong CW, Wang Y, Wang WM, Hu GX, Zhang L, Xiao LJ, Wan DC, Zhang JF, Waye MM. The lncRNA H19 promotes epithelial to mesenchymal transition by functioning as miRNA sponges in colorectal cancer. Oncotarget. 2015;6:22513–22525. doi: 10.18632/oncotarget.4154. [DOI] [PMC free article] [PubMed] [Google Scholar]
- 8.Chen JS, Wang YF, Zhang XQ, Lv JM, Li Y, Liu XX, Xu TP. H19 serves as a diagnostic biomarker and up-regulation of H19 expression contributes to poor prognosis in patients with gastric cancer. Neoplasma. 2016;63:223–230. doi: 10.4149/207_150821N454. [DOI] [PubMed] [Google Scholar]
- 9.Livak KJ, Schmittgen TD. Analysis of relative gene expression data using real-time quantitative PCR and the 2(-Delta Delta C(T)) method. Methods. 2001;25:402–408. doi: 10.1006/meth.2001.1262. [DOI] [PubMed] [Google Scholar]
- 10.Castro LG, Bakos RM, Duprat Neto JP, Bittencourt FV, Di Giacomo TH, Serpa SS, Messina MC, Loureiro WR, Macarenco RS, Stolf HO, Gontijo G. Brazilian guideline for diagnosis, treatment and follow-up of primary cutaneous melanoma-part II. An Brass Dermatol. 2016;91:49–58. doi: 10.1590/abd1806-4841.20164715. [DOI] [PMC free article] [PubMed] [Google Scholar]
- 11.Aris M, Barrio MM. Combining immunotherapy with oncogene-targeted therapy: a new road for melanoma treatment. Front lmmunol. 2015;6:46. doi: 10.3389/fimmu.2015.00046. [DOI] [PMC free article] [PubMed] [Google Scholar]
- 12.Marzese DM, Scolyer RA, Huynh JL, Huang SK, Hirose H, Chong KK, Kiyohara E, Wang J, Kawas NP, Donovan NC, Hata K, Wilmott JS, Murali R, Buckland ME, Shivalingam B, Thompson JF, Morton DL, Kelly DF, Hoon DS. Epigenome-wide DNA methylation landscape of melanoma progression to brain metastasis reveals aberrations on homeobox D cluster associated with prognosis. Hum Mol Genet. 2014;23:226–238. doi: 10.1093/hmg/ddt420. [DOI] [PMC free article] [PubMed] [Google Scholar]
- 13.Wang J, Song YX, Wang ZN. Non-coding RNAs in gastric cancer. Gene. 2015;560:1–8. doi: 10.1016/j.gene.2015.02.004. [DOI] [PubMed] [Google Scholar]
- 14.Matouk IJ, DeGroot N, Mezan S, Ayesh S, Abu-lail R, Hochberg A, Galun E. The H19 non-coding RNA is essential for human tumor growth. PLoS One. 2007;2:e845. doi: 10.1371/journal.pone.0000845. [DOI] [PMC free article] [PubMed] [Google Scholar]
- 15.Zhu Z, Song L, He J, Sun Y, Liu X, Zou X. Ectopic expressed long non-coding RNA H19 contributes to malignant cell behavior of ovarian cancer. Int J Clin Exp Pathol. 2015;8:10082–10091. [PMC free article] [PubMed] [Google Scholar]
- 16.Yang F, Bi J, Xue X, Zheng L, Zhi K, Hua J, Fang G. Up-regulated long non-coding RNA H19 contributes to proliferation of gastric cancer cells. FEBS J. 2012;279:3159–3165. doi: 10.1111/j.1742-4658.2012.08694.x. [DOI] [PubMed] [Google Scholar]
- 17.Shi Y, Wang Y, Luan W, Wang P, Tao T, Zhang J, Qian J, Liu N, You Y. Long non-coding RNA H19 promotes glioma cell invasion by deriving miR-675. PLos One. 2014;9:e86295. doi: 10.1371/journal.pone.0086295. [DOI] [PMC free article] [PubMed] [Google Scholar]
- 18.Gao Y, Meng H, Liu S, Hu J, Zhang Y, Jiao T, Liu Y, Ou J, Wang D, Yao L, Liu S, Hui N. LncRNA-HOST2 regulates cell biological behaviors in epithelial ovarian cancer through a mechanism involving microRNA let-7b. Hum Mol Genet. 2015;24:841–852. doi: 10.1093/hmg/ddu502. [DOI] [PubMed] [Google Scholar]
- 19.LV J, Yu YQ, Li SQ, Luo L, Wang Q. Aflatoxin B1 promotes cell growth and invasion in hepatocellular carcinoma HepG2 cells through H19 and E2F1. Asian Pac J Cancer Prev. 2014;15:2565–2570. doi: 10.7314/apjcp.2014.15.6.2565. [DOI] [PubMed] [Google Scholar]
- 20.Amicone L, Citarella F, Cicchini C. Epigenetic regulation in Hepatocellular carcinoma requires long noncoding RNAs. Biomed Res Int. 2015;2015:473942. doi: 10.1155/2015/473942. [DOI] [PMC free article] [PubMed] [Google Scholar]
- 21.Lv J, Ma L, Chen XL, Huang XH, Wang Q. Downregulation of LncRNAH19 and MiR-675 promotes migration and invasion of human hepatocellular carcinoma cells through AKT/GSK-3beta/Cdc25A signaling pathway. Journal of Huazhong University of Science and Technology (Medical Sciences) 2014;34:363–369. doi: 10.1007/s11596-014-1284-2. [DOI] [PubMed] [Google Scholar]
- 22.Goyal N, Sivadas A, Shamsudheen KV, Jayarajan R, Verma A, Sivasubbu S, Scaria V, Datta M. RNA sequencing of db/db mice liver identifies LncRNA H19 as a key regulator of gluconeogenesis and hepatic glucose output. Sci Rep. 2017;7:8312. doi: 10.1038/s41598-017-08281-7. [DOI] [PMC free article] [PubMed] [Google Scholar]
- 23.Ikeda K, Mason PJ, Bessler M. 3’UTR-truncated Hmga2 cDNA causes MPN-like hematopoiesis by conferring a clonal growth advantage at the level of HSC in mice. Blood. 2011;117:5860–5869. doi: 10.1182/blood-2011-02-334425. [DOI] [PMC free article] [PubMed] [Google Scholar]
- 24.Nieto MA, Huang RY, Jackson RA, Thiery JP. EMT: 2016. Cell. 2016;166:21–45. doi: 10.1016/j.cell.2016.06.028. [DOI] [PubMed] [Google Scholar]
- 25.Pasquier J, Abu-Kaoud N, Al Thani H, Rafii A. Epithelial to mesenchymal transition in a clinical perspective. J Oncol. 2015;2015:792182. doi: 10.1155/2015/792182. [DOI] [PMC free article] [PubMed] [Google Scholar]
- 26.Matouk IJ, Halle D, Raveh E, Gilon M, Sorin V, Hochberg A. The role of the oncofetal H19 LncRNA in tumor metastasis: orchestrating the EMT-MET decision. Oncotarget. 2016;7:3748–3765. doi: 10.18632/oncotarget.6387. [DOI] [PMC free article] [PubMed] [Google Scholar]
- 27.Matouk IJ, Raveh E, Abu-lail R, Mezan S, Gilon M, Gershtain E, Birman T, Gallula J, Schneider T, Barkali M, Richler C, Fellig Y, Sorin V, Hubert A, Hochberg A, Czerniak A. Oncofetal H19 RNA promotes tumor metastasis. Biochim Biophys Acta. 2014;1843:1414–1426. doi: 10.1016/j.bbamcr.2014.03.023. [DOI] [PubMed] [Google Scholar]
- 28.Yan L, Zhou J, Gao Y, Ghazal S, Lu L, Bellone S, Yang Y, Liu N, Zhao X, Santin AD, Taylor H, Huang Y. Regulation of tumor cell migration and invasion by the H19/let-7 axis is antagonized by metformin-induced DNA methylation. Oncogene. 2015;34:3076–3084. doi: 10.1038/onc.2014.236. [DOI] [PubMed] [Google Scholar]


