

Abstract
Mitoxantrone is one kind of chemical therapy medicine for cancer but certain kinds of cancer cells are chemical-resistant to it. In this research, we analyzed the quantitative proteomic difference between tumors in vivo xenograft by mitoxantrone-resistant (M group) and wild NCI-H460 cells (N group). Protein expression profiling in combination with pathway analysis was deployed to investigate molecular events associated with the tumors using a label-free quantitative proteomic approach. A total of 173 proteins were significantly differentially expressed in mitoxantrone-resistant tumors. Bioinformatics analysis using the cytoscape platform indicated that biological processes, including actin-mediated cell contraction, muscle system process, muscle filament sliding, and muscle contraction, are involved in mitoxantrone-resistance. As KEGG pathway enrichment analysis has shown, systemic lupus erythematosus, alcoholism, viral carcinogenesis, and tight junction are strongly regulated with chemical-resistance. By protein-protein interaction analysis, three protein clusters were found using k-means clustering algorithm. Dysregulation results can be verified by Western blotting. Further studies into the molecular functions of dysregulated proteins will help to provide new perspectives regarding chemoresistance for non-small cell lung cancers.
Keywords: Quantitative proteomics, bioinformatics, protein network, mitoxantrone, multi-drug resistance
Introduction
Lung cancer is the leading cause of cancer-related mortality worldwide, with a 5-year survival rate of only 18% [1]. The rate is still increasing. Non-small cell lung cancer (NSCLC) comprises 85-90% of lung cancer diagnoses [2], with 5-year survival < 20% [3,4], especially large cell lung cancer. As one of the most important therapies, chemotherapy has not been as useful for large cell lung cancer compared with small cell lung cancer. The mechanism of resistance is not very clear.
Recent advances in analytical techniques present a new opportunity to examine the networks and offer a new view of pathologies and therapy targets. Proteomics is a collective study of all expressed proteins in cells, tissues, or biological fluids at a given time. It can reveal information not only on individual proteins but also their interplay in cellular components, biological processes, pathways, and special biochemical functions [5-7]. Liquid chromatography coupled with mass spectrometry (LC-MS) is a high-throughput experimental platform to measure thousands of proteins from complex biological samples, simultaneously [8]. Label-free quantitative proteomics can achieve a good balance between quantitative precision and number of quantified features [9]. It is reliable, versatile, and a cost-effective alternative compared to labeled quantitation [10].
There are many hypotheses to explain chemoresistance of cancers, such as cancer stem cells, micro-environments, etc. Detailed network perspective associated with mitoxantrone-resistance tumors remains unclear, however. In this research, we analyzed the proteomics of mitoxantrone-resistant and wild NCI-H460 cells xenografts tumors in vivo of female athymic nude mice (BALB/C). We also analyzed the bioinformatics and protein-protein interaction networks of dysregulated proteins. Detailed elucidations are as follows.
Materials and methods
3-(4,5-dimethylthiazol-2-yl)-5-(3-carboxymethoxyphenyl)-2-(4-sulfophenyl)-2H-tetrazolium (MTS), ammonium bicarbonate, sodium deoxycholate, and iodoacetamide were purchased from Sigma (St. Louis, MO, USA). Tris-(2-carboxyethyl) phosphine (TCEP) was acquired from Thermo Scientific (Rockford, Il, USA). Modified sequencing-grade trypsin was obtained from Promega (Madison, WI, USA). All mobile phases and solutions were prepared with HPLC grade solvents (i.e. water, acetonitrile, methanol, and formic acid) from Fisher. All other reagents were from commercial suppliers and of standard biochemical quality.
Cell lines and generation of chemoresistant cancer cells
Cancer cell line NCl-H460 was used. The chemotherapeutic drug mitoxantrone (MXR, 20 ng/mL) was used, a mutant from previous research [11]. In conclusion, the drug treatments were repeated twice or three times, mimicking the clinical regimen that patients with cancers would receive. This strategy ensured that more than 95% of cells underwent apoptosis or senescence with senescent cells eventually dying, thereby selecting the most resistant clones.
In vivo xenografts
Female athymic nude mice (BALB/C, 4-6 weeks of age) were used and all experimental procedures were performed according to protocols approved by the Peking University Health Science Center Animal Care and Use Committee. Each mouse was inoculated subcutaneously in both the side of flank with 5 × 10⁶ H460 or H460/MTX cells suspended in 0.1 mL of serum-free medium containing 50% Matrigel (BD Biosciences, Bedford, MA). At 20 days after inoculation, all mice were sacrificed.
Protein preparation
After scarification, only 1 mm3 of each tumor was used to prepare protein samples. In brief, they were grinded and ultrasonic oscillated in individual tubes. Tissue homogenates were lysed in RIPA buffer (Applygen, Beijing, China). After centrifugation (9000 rpm, 5 min, 4°C), supernatant of total proteins was removed to new tubes and protein concentration was determined by BCA assay (Pierce, Thermo Fisher Scientific, MA, USA). Each group was analyzed in triplicate.
Sample preparation for LC-MS
Protein samples (50 μg) from each group were processed, according to manufacturer protocol, for filter-aided sample preparation (FASP) [12]. Briefly, proteins were concentrated using Vivacon 500 filtration tubes (Cat No. VNO1HO2, Sartorius Stedim Biotech, UK), mixed with 100 μL of 8 M urea in 0.1 M Tris/HCL (pH 8.5) buffer, and centrifuged at 14,000 g and 4°C for 15 minutes. This step was performed twice, after which 10 μL of 0.05 M TCEP in water was added to the filters and samples were incubated at 37°C for 1 hour. Then, 10 μL of 0.1 M iodoacetamide (IAA) was added to the filters, afterwards the samples were incubated in darkness for 30 minutes. Filters were washed twice with 200 μL of 50 mM NH4HCO3. Finally, 1 μg of trypsin in 100 μL of 50 mM NH4HCO3 was added to each filter. The protein to enzyme ratio was 50:1. Samples were incubated overnight at 37°C and released peptides were collected by centrifugation.
LC-MS analysis
LC-MS experiments were performed on a nano-flow HPLC system (Easy-nLC 1000, Thermo Fisher Scientific, Waltham, MA, USA) connected to a Q-Exactive HF mass spectrometer (Thermo Fisher Scientific), equipped with a Nanospray Flex Ion Source (Thermo Fisher Scientific). One μg peptide mixtures (5 μL) were separated using a home-made reversed phase C18 column (75 μm I.D. × 20 mm, 3 μm particle size) at a flow rate of 300 nL/min. Chromatographic separation was performed with a 90 minute gradient of 2% to 40% acetonitrile in 0.1% formic acid. The electrospray voltage was maintained at 2.2 kV and capillary temperature was set at 275°C. Q-Exactive HF was operated in data-dependent mode to simultaneously measure full scan MS spectra (m/z 300-1800) in the Orbitrap with a mass resolution of 60,000 at m/z 400. After full-scan survey, the 20 most abundant ions detected in the full-MS scan were measured in the Orbitrap using HCD mode.
Protein identification and quantification
Data analysis was performed with MaxQuant software (version 1.6.0.16) (http://www.maxquant.org/) [13]. For protein identification, MS/MS data were submitted to the Uniprot human protein database using the Andromeda search engine [14] with the following settings: trypsin cleavage; fixed modification of carbamidomethylation of cysteine; variable modifications of methionine oxidation; a maximum of two missed cleavages; false discovery rate of 0.01 at both peptide and protein level. Other parameters were set as default. These results were imported into Microsoft excel for further analysis. Label-free quantitation (LFQ) was also performed in MaxQuant. Minimum ratio count for LFQ was set to 2 and match-between-runs option was enabled. Other parameters were set as default. A 2-fold change in expression and a p-value of Student’s t-test of 0.05 were used as a combined threshold to define biologically dysregulated proteins.
Bioinformatics analysis
Principal component analysis (PCA) and hierarchical clustering analysis were performed using MetaboAnalyst 3.0 web service (http://www.metaboanalyst.ca/). For bioinformatics analysis, the 172 differentially expressed proteins were used as inputs. Protein-protein interaction networks were constructed by STRING web service (http://www.string-db.org/). DAVID web service (https://david.ncifcrf.gov/) was used to retrieve the Gene Ontology Consortium (GOC, http://geneontology.org/) annotation results and KEGG pathway enrichment results.
Western blotting
The same protein samples for LC-MS analysis were also used for Western blotting assay. After the addition of sample loading buffer, protein samples of each group were separated using 10% SDS-PAGE and subsequently transferred to PVDF membrane (Millipore). The membrane was incubated in fresh blocking buffer (0.1% Tween 20 in Tris-buffered saline, pH 7.4, containing 5% non-fat dried milk) at room temperature for 1 hour and then probed with monoclonal mouse anti-RAD50 antibody (Abcam, Cambridge, UK) and mouse anti-glyceraldehyde-3-phosphate dehydrogenase (GAPDH) antibody (Zhongshan Gold Bridge Biotechnology Co. Ltd, China) in blocking buffer at 4°C overnight. Membranes were washed three times for 5 minutes each using PBST (PBS containing 0.1% Tween-20), then incubated with appropriate horseradish peroxidase (HRP)-conjugated secondary antibody at room temperature for 1 hour. Then, it was washed three more times in PBST buffer. The membrane was finally incubated with ECL substrate solution (ECL Kit, Perkinelmer) for 5 minutes, according to manufacturer instructions, and visualized with autoradiographic film.
Statistical analysis
Results are expressed as mean ± S.E.M. Statistical evaluation was performed using Student’s t-test (for comparing two value sets). P < 0.05 was considered statistically significant (*P < 0.05: **P < 0.01).
Results
Many proteins expressed different degrees between two kinds of tumors
From histogram results of raw abundance of proteins before and after logarithm transformation, as shown in Figure 1, protein expression revealed a normal distribution pattern after log transformation confirming the reliability of proteomics analysis. Statistical analysis with Perseus software was performed to select proteins that were differentially expressed between two kinds of tumors, using the following criteria: fold change > 2 or < 0.5, p-value < 0.01 (using Student’s t-test). Among thousands of proteins, there were 173 proteins dysregulated between the two kinds of tumors (Table 1). 52 proteins were downregulated in the M groups, during which there were twenty proteins only detected in the N groups. The other 121 proteins were highly upregulated and 83 of them only detected in the M groups.
Figure 1.
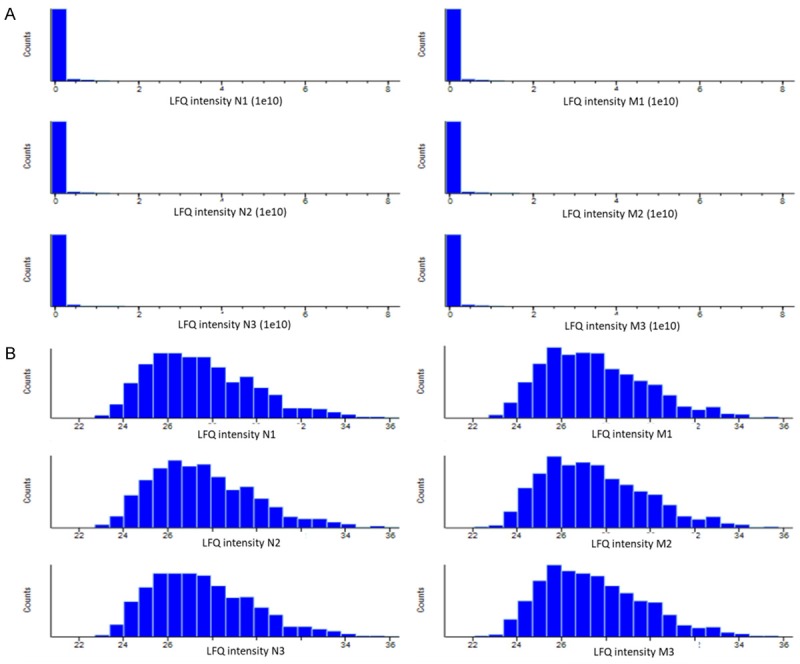
Histogram results of raw abundance of proteins before and after logarithm transformation. Histogram graph represents the protein expression distribution before (A) and after (B) logarithm (base 2) transformation. X-axis represents the intensities of proteins and Y-axis represents number of proteins. Protein expression shows a normal distribution pattern after log transformation.
Table 1.
Identification of differentially expressed proteins in mitoxantrone-resistant (M) and wild tumors NCI-H460 (N) cells xenografts tumors using LC-MS/MS
| Majority Protein ID | Protein names | Gene names | Ratio (M/N) | -log10 t-test p-value |
|---|---|---|---|---|
| P09917 | Arachidonate 5-lipoxygenase | ALOX5 | 0 | 6.21 |
| E9PMR4 | Tetraspanin | CD151 | 0 | 3.27 |
| F8W8G8 | Collagen alpha-5(VI) chain | COL6A5 | 0 | 3.72 |
| P56537 | Eukaryotic translation initiation factor 6 | EIF6 | 0 | 4.55 |
| Q8NEZ5 | F-box only protein 22 | FBXO22 | 0 | 3.68 |
| Q9Y5Y0 | Feline leukemia virus subgroup C receptor-related protein 1 | FLVCR1 | 0 | 8.17 |
| P09471 | Guanine nucleotide-binding protein G(o) subunit alpha | GNAO1 | 0 | 5.44 |
| P46734 | Dual specificity mitogen-activated protein kinase kinase 3 | MAP2K3 | 0 | 5.61 |
| Q14696 | LDLR chaperone MESD | MESDC2 | 0 | 5.49 |
| Q96T76 | MMS19 nucleotide excision repair protein homolog | MMS19 | 0 | 3.73 |
| Q9UBG0 | C-type mannose receptor 2 | MRC2 | 0 | 3.09 |
| Q86UY8 | 5-nucleotidase domain-containing protein 3 | NT5DC3 | 0 | 4.65 |
| Q96RS6 | NudC domain-containing protein 1 | NUDCD1 | 0 | 4.33 |
| O95486 | Protein transport protein Sec24A | SEC24A | 0 | 3.69 |
| B1AMS2 | Septin-6 | septin 6 | 0 | 4.84 |
| Q9H936 | Mitochondrial glutamate carrier 1 | SLC25A22 | 0 | 5.45 |
| J3KTL8 | Structural maintenance of chromosomes flexible hinge domain-containing protein 1 | SMCHD1 | 0 | 4.01 |
| Q13813-3 | Spectrin alpha chain, non-erythrocytic 1 | SPTAN1 | 0 | 6.82 |
| F8WF27 | Transmembrane 4 L6 family member 1 | TM4SF1 | 0 | 1.38 |
| P67936 | Tropomyosin alpha-4 chain | TPM4 | 0 | 4.02 |
| Q99878 | Histone H2A type 1-J | HIST1H2AJ | 0.05 | 1.70 |
| Q7LBC6 | Lysine-specific demethylase 3B | KDM3B | 0.18 | 1.71 |
| P06396 | Gelsolin | GSN | 0.22 | 1.48 |
| P20827 | Ephrin-A1 | EFNA1 | 0.22 | 1.55 |
| P16402 | Histone H1.3 | HIST1H1D | 0.23 | 2.09 |
| D6RFM0 | Ubiquitin-conjugating enzyme E2 D2 | UBE2D2 | 0.23 | 1.50 |
| P12532 | Creatine kinase U-type, mitochondrial | CKMT1A | 0.23 | 2.18 |
| Q9C0B1 | Alpha-ketoglutarate-dependent dioxygenase FTO | FTO | 0.25 | 1.4 |
| P11182 | Lipoamide acyltransferase component of branched-chain alpha-keto acid dehydrogenase complex, mitochondrial | DBT | 0.26 | 1.36 |
| P16401 | Histone H1.5 | HIST1H1B | 0.26 | 6.04 |
| Q9H0E9 | Bromodomain-containing protein 8 | BRD8 | 0.26 | 1.96 |
| P10124 | Serglycin | SRGN | 0.27 | 4.09 |
| K7EKP1 | Apolipoprotein C-I | APOC1 | 0.30 | 1.54 |
| E7EQB2 | Lactotransferrin | LTF | 0.33 | 2.60 |
| P16403 | Histone H1.2 | HIST1H1C | 0.36 | 2.88 |
| Q71UI9 | Histone H2A.V | H2AFV | 0.36 | 1.79 |
| Q16778 | Histone H2B type 2-E | HIST2H2BE | 0.37 | 1.45 |
| A8MYE6 | Integrin beta | ITGB2 | 0.39 | 3.69 |
| P11215 | Integrin alpha-M | ITGAM | 0.41 | 3.8 |
| P01008 | Antithrombin-III | SERPINC1 | 0.41 | 4.00 |
| P98088 | Mucin-5AC | MUC5AC | 0.41 | 6.71 |
| Q5TEC6 | Histone H3 | HIST2H3PS2 | 0.43 | 1.52 |
| P12955 | Xaa-Pro dipeptidase | PEPD | 0.44 | 4.40 |
| P05164 | Myeloperoxidase | MPO | 0.45 | 6.02 |
| B4DR52 | Histone H2B | HIST1H2BN | 0.46 | 3.99 |
| O75531 | Barrier-to-autointegration factor | BANF1 | 0.47 | 1.52 |
| P62805 | Histone H4 | HIST1H4A | 0.47 | 4.19 |
| P00352 | Retinal dehydrogenase 1 | ALDH1A1 | 0.47 | 4.62 |
| Q6FI13 | Histone H2A type 2-A | HIST2H2AA3 | 0.47 | 3.77 |
| P05204 | Non-histone chromosomal protein HMG-17 | HMGN2 | 0.48 | 2.65 |
| P00747 | Plasminogen | PLG | 0.48 | 2.73 |
| E9PBJ0 | Mucin-5B | MUC5B | 0.49 | 5.83 |
| Q01081 | Splicing factor U2AF 35 kDa subunit | U2AF1 | 2.03 | 3.68 |
| P22087 | rRNA 2-O-methyltransferase fibrillarin | FBL | 2.04 | 6.04 |
| A6NN80 | Annexin A6 | ANXA6 | 2.05 | 6.17 |
| O00499 | Myc box-dependent-interacting protein 1 | BIN1 | 2.09 | 1.78 |
| F5H7V9 | Tenascin | TNC | 2.11 | 4.36 |
| P04264 | Keratin, type II cytoskeletal 1 | KRT1 | 2.19 | 4.25 |
| Q8NI27 | THO complex subunit 2 | THOC2 | 2.25 | 1.90 |
| Q9UBR2 | Cathepsin Z | CTSZ | 2.35 | 4.63 |
| Q96PZ0 | Pseudouridylate synthase 7 homolog | PUS7 | 2.46 | 1.32 |
| P50402 | Emerin | EMD | 2.48 | 1.32 |
| F5H6U7 | Vesicle transport protein GOT1B | GOLT1B | 2.63 | 1.93 |
| Q96FQ6 | Protein S100-A16 | S100A16 | 2.67 | 4.29 |
| Q13642 | Four and a half LIM domains protein 1 | FHL1 | 2.82 | 2.89 |
| P60903 | Protein S100-A10 | S100A10 | 2.96 | 4.09 |
| P68133 | Actin, alpha skeletal muscle | ACTA1 | 3.42 | 4.73 |
| P11217 | Glycogen phosphorylase, muscle form | PYGM | 3.58 | 4.01 |
| P41223 | Protein BUD31 homolog | BUD31 | 3.92 | 1.32 |
| Q8NBW7 | ER lumen protein-retaining receptor 1 | KDELR1 | 3.95 | 2.18 |
| P23786 | Carnitine O-palmitoyltransferase 2, mitochondrial | CPT2 | 4.00 | 1.33 |
| Q8N0U8 | Vitamin K epoxide reductase complex subunit 1-like protein 1 | VKORC1L1 | 4.01 | 1.40 |
| P50238 | Cysteine-rich protein 1 | CRIP1 | 4.06 | 1.42 |
| Q7Z4H3 | HD domain-containing protein 2 | HDDC2 | 4.10 | 1.34 |
| Q9H2W6 | 39S ribosomal protein L46, mitochondrial | MRPL46 | 4.29 | 1.35 |
| P14618 | Pyruvate kinase PKM | PKM; PKM2 | 4.31 | 1.46 |
| Q9NVP1 | ATP-dependent RNA helicase DDX18 | DDX18 | 4.44 | 1.58 |
| P98160 | Basement membrane-specific heparan sulfate proteoglycan core protein | HSPG2 | 4.54 | 1.60 |
| Q8IYB8 | ATP-dependent RNA helicase SUPV3L1, mitochondrial | SUPV3L1 | 4.54 | 1.51 |
| O00139 | Kinesin-like protein KIF2A | KIF2A | 4.61 | 1.53 |
| O00767 | Acyl-CoA desaturase | SCD | 4.86 | 1.73 |
| Q86UX7 | Fermitin family homolog 3 | FERMT3 | 5.00 | 1.69 |
| F5H4G7 | Importin subunit alpha-6 | KPNA6 | 5.01 | 1.72 |
| B4E0V0 | Pyridoxine-5-phosphate oxidase | PNPO | 6.44 | 2.03 |
| Q86TD4 | Sarcalumenin | SRL | 8.12 | 2.67 |
| P07451 | Carbonic anhydrase 3 | CA3 | 9.19 | 5.59 |
| E9PR30 | 40S ribosomal protein S30 | FAU | 25.28 | 4.61 |
| P12882 | Myosin-1 | MYH1 | 34.78 | 5.65 |
| P13929 | Beta-enolase | ENO3 | 40.44 | 2.95 |
| P06732 | Creatine kinase M-type | CKM | 140.97 | 3.70 |
| F5GYC1 | ATP-binding cassette sub-family D member 3 | ABCD3 | #DIV/0! | 4.67 |
| P35609 | Alpha-actinin-2 | ACTN2 | #DIV/0! | 3.46 |
| Q9UKV8 | Protein argonaute-2 | AGO2 | #DIV/0! | 3.30 |
| Q9BT22 | Chitobiosyldiphosphodolichol beta-mannosyltransferase | ALG1 | #DIV/0! | 3.85 |
| Q5VY93 | Rho guanine nucleotide exchange factor 2 | ARHGEF2 | #DIV/0! | 3.01 |
| Q96BM9 | ADP-ribosylation factor-like protein 8A | ARL8A | #DIV/0! | 6.74 |
| O14983 | Sarcoplasmic/endoplasmic reticulum calcium ATPase 1 | ATP2A1 | #DIV/0! | 4.43 |
| Q93084 | Sarcoplasmic/endoplasmic reticulum calcium ATPase 3 | ATP2A3 | #DIV/0! | 4.26 |
| P46100 | Transcriptional regulator ATRX | ATRX | #DIV/0! | 5.97 |
| C9JGJ9 | B-cell receptor-associated protein 29 | BCAP29 | #DIV/0! | 4.71 |
| O75934 | Pre-mRNA-splicing factor SPF27 | BCAS2 | #DIV/0! | 3.05 |
| P46736 | Lys-63-specific deubiquitinase BRCC36 | BRCC3 | #DIV/0! | 3.00 |
| F5GX99 | Caseinolytic peptidase B protein homolog | CLPB | #DIV/0! | 5.06 |
| P09497 | Clathrin light chain B | CLTB | #DIV/0! | 6.07 |
| A6NLH6 | Protein cornichon homolog 4 | CNIH4 | #DIV/0! | 6.35 |
| E9PJL7 | Alpha-crystallin B chain | CRYAB | #DIV/0! | 3.11 |
| Q13363 | C-terminal-binding protein 1 | CTBP1 | #DIV/0! | 2.08 |
| P07858 | Cathepsin B | CTSB | #DIV/0! | 6.02 |
| Q9BVQ8 | Probable ATP-dependent RNA helicase DDX49 | DDX49 | #DIV/0! | 2.81 |
| P00374 | Dihydrofolate reductase | DHFR | #DIV/0! | 5.94 |
| Q8IYJ9 | Dual specificity protein phosphatase 3 | DUSP3 | #DIV/0! | 3.78 |
| P49770 | Translation initiation factor eIF-2B subunit beta | EIF2B2 | #DIV/0! | 4.70 |
| P11171 | Protein 4.1 | EPB41 | #DIV/0! | 3.36 |
| C9JAG1 | Ethanolaminephosphotransferase 1 | EPT1 | #DIV/0! | 4.80 |
| Q14315 | Filamin-C | FLNC | #DIV/0! | 7.06 |
| A8MQB8 | Fragile X mental retardation protein 1 | FMR1 | #DIV/0! | 3.83 |
| Q14C86 | GTPase-activating protein and VPS9 domain-containing protein 1 | GAPVD1 | #DIV/0! | 5.79 |
| O00461 | Golgi integral membrane protein 4 | GOLIM4 | #DIV/0! | 2.86 |
| B7WNW7 | HEAT repeat-containing protein 3 | HEATR3 | #DIV/0! | 5.08 |
| O43719 | HIV Tat-specific factor 1 | HTATSF1 | #DIV/0! | 3.71 |
| O15357 | Phosphatidylinositol 3,4,5-trisphosphate 5-phosphatase 2 | INPPL1 | #DIV/0! | 4.52 |
| Q68E01 | Integrator complex subunit 3 | INTS3 | #DIV/0! | 4.29 |
| Q14573 | Inositol 1,4,5-trisphosphate receptor type 3 | ITPR3 | #DIV/0! | 3.70 |
| H0Y8E4 | Kinase D-interacting substrate of 220 kDa | KIDINS220 | #DIV/0! | 3.38 |
| O75112 | LIM domain-binding protein 3 | LDB3 | #DIV/0! | 5.79 |
| P21397 | Amine oxidase [flavin-containing] A | MAOA | #DIV/0! | 4.94 |
| Q9P015 | 39S ribosomal protein L15, mitochondrial | MRPL15 | #DIV/0! | 5.32 |
| Q96DV4 | 39S ribosomal protein L38, mitochondrial | MRPL38 | #DIV/0! | 3.92 |
| Q13405 | 39S ribosomal protein L49, mitochondrial | MRPL49 | #DIV/0! | 6.04 |
| B8ZZU9 | Bifunctional methylenetetrahydrofolate dehydrogenase/cyclohydrolase, mitochondrialdehydrogenase | MTHFD2 | #DIV/0! | 4.31 |
| Q14324 | Myosin-binding protein C, fast-type | MYBPC2 | #DIV/0! | 3.66 |
| Q9UKX2 | Myosin-2 | MYH2 | #DIV/0! | 6.62 |
| Q9Y623 | Myosin-4 | MYH4 | #DIV/0! | 2.50 |
| P12883 | Myosin-7 | MYH7 | #DIV/0! | 3.79 |
| Q96A32 | Myosin regulatory light chain 2, skeletal muscle isoform | MYLPF | #DIV/0! | 3.06 |
| S4R3I5 | NADH dehydrogenase [ubiquinone] 1 alpha subcomplex subunit 3 | NDUFA3 | #DIV/0! | 3.63 |
| H0Y9M8 | NADH dehydrogenase [ubiquinone] iron-sulfur protein 4, mitochondrial | NDUFS4 | #DIV/0! | 5.69 |
| C9J808 | MKI67 FHA domain-interacting nucleolar phosphoprotein | NIFK | #DIV/0! | 5.67 |
| P46087 | Probable 28S rRNA (cytosine(4447)-C(5))-methyltransferase | NOP2 | #DIV/0! | 4.01 |
| Q5TFE4 | 5-nucleotidase domain-containing protein 1 | NT5DC1 | #DIV/0! | 5.57 |
| Q9NPF4 | Probable tRNA N6-adenosine threonylcarbamoyltransferase | OSGEP | #DIV/0! | 3.74 |
| J3KNQ4 | Alpha-parvin | PARVA | #DIV/0! | 5.65 |
| Q15118 | [Pyruvate dehydrogenase (acetyl-transferring)] kinase isozyme 1, mitochondrial | PDK1 | #DIV/0! | 3.54 |
| P15259 | Phosphoglycerate mutase 2 | PGAM2 | #DIV/0! | 2.44 |
| Q969N2 | GPI transamidase component PIG-T | PIGT | #DIV/0! | 4.81 |
| P24928 | DNA-directed RNA polymerase II subunit RPB1 | POLR2A | #DIV/0! | 4.36 |
| E9PG73 | Peptidyl-prolyl cis-trans isomerase G | PPIG | #DIV/0! | 4.12 |
| P50336 | Protoporphyrinogen oxidase | PPOX | #DIV/0! | 4.02 |
| P51888 | Prolargin | PRELP | #DIV/0! | 3.10 |
| P17252 | Protein kinase C alpha type | PRKCA | #DIV/0! | 5.20 |
| A2A2V1 | Major prion protein | PRNP | #DIV/0! | 4.91 |
| E7EVX8 | U4/U6 small nuclear ribonucleoprotein Prp31 | PRPF31 | #DIV/0! | 4.24 |
| O95758 | Polypyrimidine tract-binding protein 3 | PTBP3 | #DIV/0! | 3.83 |
| Q92878 | DNA repair protein RAD50 | RAD50 | #DIV/0! | 6.15 |
| H0YAE9 | Ribonuclease T2 | RNASET2 | #DIV/0! | 4.24 |
| D6RD69 | GTP-binding protein SAR1b | SAR1B | #DIV/0! | 5.07 |
| Q86TU7 | Histone-lysine N-methyltransferase setd3 | SETD3 | #DIV/0! | 5.76 |
| O15374-4 | Monocarboxylate transporter 5 | SLC16A4 | #DIV/0! | 4.55 |
| O00186 | Syntaxin-binding protein 3 | STXBP3 | #DIV/0! | 4.09 |
| E7EMB1 | Switch-associated protein 70 | SWAP70 | #DIV/0! | 2.97 |
| P57105 | Synaptojanin-2-binding protein | SYNJ2BP | #DIV/0! | 2.64 |
| E9PF19 | Transducin beta-like protein 2 | TBL2 | #DIV/0! | 4.88 |
| Q92544 | Transmembrane 9 superfamily member 4 | TM9SF4 | #DIV/0! | 5.47 |
| P02585 | Troponin C, skeletal muscle | TNNC2 | #DIV/0! | 7.89 |
| P48788 | Troponin I, fast skeletal muscle | TNNI2 | #DIV/0! | 3.21 |
| H9KVA2 | Troponin T, fast skeletal muscle | TNNT3 | #DIV/0! | 3.65 |
| Q8NFQ8 | Torsin-1A-interacting protein 2 | TOR1AIP2 | #DIV/0! | 3.40 |
| Q6ZMU5 | Tripartite motif-containing protein 72 | TRIM72 | #DIV/0! | 3.69 |
| B4DEB8 | Tetraspanin-7 | TSPAN7 | #DIV/0! | 4.35 |
| Q6PGP7 | Tetratricopeptide repeat protein 37 | TTC37 | #DIV/0! | 2.32 |
| Q9BZX2 | Uridine-cytidine kinase 2 | UCK2 | #DIV/0! | 3.72 |
| Q5MNZ6 | WD repeat domain phosphoinositide-interacting protein 3 | WDR45B | #DIV/0! | 3.56 |
| Q5BJH7 | Protein YIF1B | YIF1B | #DIV/0! | 4.52 |
An overview of proteomics analysis of the tumors is shown in Figure 2A, a PCA score plot of the two groups in terms of PC1 (X-axis) and PC2 (Y-axis). The two groups are presented by red (group N) and green (group M). Figure 2B shows volcano plot of the 2,406 proteins quantified. We determined the fold change in protein expression as X-axis represents fold change (group M/N) and Y-axis represents log10 (p-value). Up- and down-regulated proteins are colored in pink. Expression levels of the 172 proteins in all samples are shown in the heat map generated by hierarchical cluster analysis, displaying a clear difference in mitoxantrone-resistant (M) and wild NCI-H460 (N) cell xenograft tumors (Figure 3A).
Figure 2.
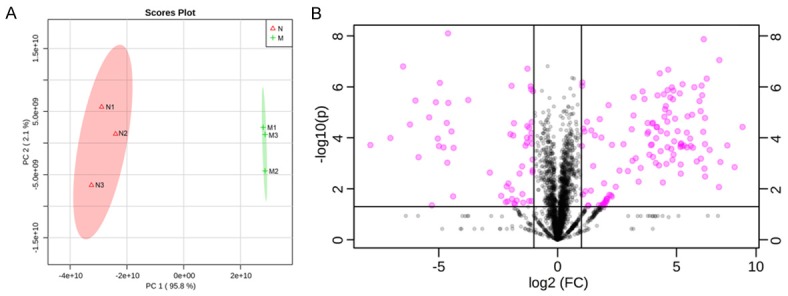
Overview of proteomic analysis of the tumors. A: PCA score plot of the two groups in terms of PC1 (X-axis) and PC2 (Y-axis). The two groups are presented by red (group B) and green (group LA). B: Volcano plot of the 2,406 proteins quantified. X-axis represents fold change (group M/N), and Y-axis represents -log10 (p-value). Up- and down-regulated proteins are colored pink.
Figure 3.

Expression pattern and bioinformatics analysis of significantly dysregulated proteins. A: Heat map representing the hierarchical clustering analysis results of the dysregulated proteins. Red represents upregulated proteins in group M and green represents downregulated proteins. B: Top 15 items of the gene ontology enrichment analysis in terms of cellular component. X-axis represents -log10 (p-value). C: Top 15 items of the gene ontology enrichment analysis in terms of biological process. D: Top 15 items of the gene ontology enrichment analysis in terms of molecular function. E: KEGG pathway enrichment analysis.
Bioinformatics analysis
To better understand the regulative network influenced by treatment, we analyzed the expression pattern and bioinformatics analysis of significantly dysregulated proteins using dysregulated proteins as inputs. Figure 3B shows the top 14 items of gene ontology enrichment analysis in terms of cellular components. X-axis represents -log10 (p-value). The cellular locations of these dysregulated proteins were mainly at sarcomere, contractile fiber part, contractile fiber, myofibril, and organelle part et al. Figure 3C shows the top 14 items of gene ontology enrichment analysis in terms of biological processes. Dysregulated proteins influenced by treatment were related with several biological processes. Bioinformatics analysis, using the cytoscape platform, indicated that biological processes, including actin-mediated cell contraction, muscle system process, muscle filament sliding, and muscle contraction, are involved in mitoxantrone-resistance. Figure 3D shows the top 14 items of gene ontology enrichment analysis in terms of molecular function. Their functions were included in binding, anion binding, carbohydrate derivative binding, small molecule binding, and structural molecule activity et al. As KEGG pathway enrichment analysis shows in Figure 3E, systemic lupus erythematosus, alcoholism, viral carcinogenesis, and tight junction were strongly regulated with mitoxantrone-resistance.
To construct a protein-protein interaction network associated with two kinds of tumors, we matched the 173 significantly differently expressed proteins with regulatory and data protein-protein interaction networks were constructed by STRING web service (http://www.string-db.org/) (Figure 4). Each node represents a protein and each line represents one kind of known interaction. Three protein clusters were found, using k-means clustering algorithm, and are represented by different node colors (green, red, and blue).
Figure 4.

Protein-protein interaction network constructed using dysregulated proteins. Each node represents a protein and each line represents one kind of known interaction. Three protein clusters are found using k-means clustering algorithm and represented by different node colors (green, red and blue).
Western blot verification of differentially expressed protein RAD50
RAD 50 is one of the important proteins dysregulated between the two groups. We verified its different expression by Western blot and got the same conclusion of its upregulation in the mitoxantrone-resistant cell xenografts group (Figure 5).
Figure 5.
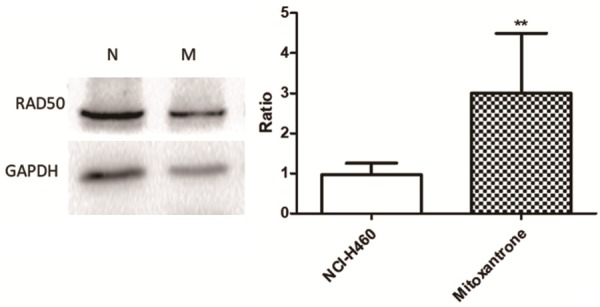
Western blotting of RAD50 expression in vivo xenograft tumors. The band intensity shows that mitoxantrone-resistant cells xenograft results in upregulation of RAD50 compared with wild NCI-H460 cells xenograft. Data are means ± SD of the results from three independent experiments, **P < 0.01.
Discussion
Tumor cell xenografts in athymic nude mice are popular models for cancer research. Animal models enable us to further understand molecular and regulatory mechanisms of tumors such as occurrence, development, and multidrug resistance (MDR). Compared with cellular studies in vitro, animal models of MDR have more clinical value. Chemoresistant cell xenografts are usually used as MDR models in vivo [15,16]. NCI-H460 is a kind of non-small cell lung cancer (NSCLC) cell line and the mitoxantrone-resistance cell line is usually used for MDR mechanism in vitro. Deep research on mitoxantrone-resistance cell xenografts will be very helpful in understanding the MDR mechanism of NSCLC.
High throughput proteomics by liquid chromatography mass spectrometry (LC-MS) has become core instrumentation offering highly relevant information towards biology including protein composition, post-translational modifications, and protein dynamics, due to its performance and sensitivity [17,18]. Using network analysis, bioinformatic analysis of pathway levels and protein-protein interaction is popular and helpful for biological and medicine research such as diagnosing disease phenotype by identification of disease-specific biomarkers for cancer [19], neurodegeneration diagnosis [20], and other diseases [21]. For example, Diederick discovered novel biomarkers for prostate cancer progression using LC-MS mode [22]. Therefore, it is a powerful tool for connecting genotypes to phenotypes.
Bioinformatics is a useful tool for analyzing high throughput data from genomics, proteomics, metabolomics, and lipidomics [23]. There are many kinds of databases online, such as DIP, BIND, Intact, KEGG, and STRING. Each of them can provide different protein-protein interaction information on metabolic and signaling pathways or multiple organisms. All of these can provide useful and important information in understanding complex pathogeneses or biological phenomena. In this research, we identified 173 dysregulated proteins between tumors forming from mitoxantrone-resistant and wild NCI-H460 cell xenografts. Bioinformatics analysis showed that they belong to three protein-protein interaction clusters and all of them can interact by weak or hard connections. There are some important proteins which lie in the cores and connect to other proteins, including Rad 50. Rad 50 is involved in many biological processes including single-organism metabolic process, cellular component organization, cellular component organization or biogenesis, and response to stress. It can detect damage both of nuclear DNA and virus DNA and then induce immune responses [24]. We also verified upregulation of Rad50 in mitoxantrone-resistant tumors by Western blot analysis, demonstrating the reliability of proteomics results. Nevertheless, there are so many different proteins that clear function researches are needed to attain a deep understanding of chemoresistant mechanisms of cancer therapies. These will also be helpful in finding new targets for clinical therapies.
Acknowledgements
This work was partly supported by the National Natural Science Foundation of China (30700206, 31700898).
Disclosure of conflict of interest
None.
References
- 1.Siegel RL, Miller KD, Jemal A. Cancer statistics. CA Cancer J Clin. 2017;67:7–30. doi: 10.3322/caac.21387. [DOI] [PubMed] [Google Scholar]
- 2.Kanaan Z, Kloecker GH, Paintal A, Perez CA. Novel targeted therapies for resistant ALK-rearranged non-small-cell lung cancer: ceritinib and beyond. Onco Targets Ther. 2015;8:885–892. doi: 10.2147/OTT.S67262. [DOI] [PMC free article] [PubMed] [Google Scholar]
- 3.Mostafa AA, Morris DG. Immunotherapy for lung cancer: has it finally arrived? Front Oncol. 2014;4:288. doi: 10.3389/fonc.2014.00288. [DOI] [PMC free article] [PubMed] [Google Scholar]
- 4.Jung MJ, Rho JK, Kim YM, Jung JE, Jin YB, Ko YG, Lee JS, Lee SJ, Lee JC, Park MJ. Upregulation of CXCR4 is functionally crucial for maintenance of stemness in drug-resistant non-small cell lung cancer cells. Oncogene. 2013;32:209–221. doi: 10.1038/onc.2012.37. [DOI] [PubMed] [Google Scholar]
- 5.Wasinger VC, Cordwell SJ, Cerpa-Poljak A, Yan JX, Gooley AA, Wilkins MR, Duncan MW, Harris R, Williams KL, Humphery-Smith I. Progress with gene-product mapping of the Mollicutes: mycoplasma genitalium. Electrophoresis. 1995;6:1090–1094. doi: 10.1002/elps.11501601185. [DOI] [PubMed] [Google Scholar]
- 6.Wilkins MR, Sanchez JC, Gooley AA, Appel RD, Humphery-Smith I, Hochstrasser DF, Williams KL. Progress with proteome projects: why all proteins expressed by a genome should be identified and how to do it. Biotechnol Genet Eng Rev. 1996;13:19–50. doi: 10.1080/02648725.1996.10647923. [DOI] [PubMed] [Google Scholar]
- 7.Walther TC, Mann M. Mass spectrometry-based proteomics in cell biology. J Cell Biol. 2010;190:491–500. doi: 10.1083/jcb.201004052. [DOI] [PMC free article] [PubMed] [Google Scholar]
- 8.Ong SE, Mann M. Mass spectrometry-based proteomics turns quantitative. Nat Chem Biol. 2005;1:252–262. doi: 10.1038/nchembio736. [DOI] [PubMed] [Google Scholar]
- 9.Liu NQ, Dekker LJ, Sting lC, Güzel C, De Marchi T, Martens JW, Foekens JA, Luider TM, Umar A. Quantitative proteomic analysis of microdissected breast cancer tissues: comparison of label-free and SILAC-based quantification with shotgun, directed, and targeted MS approaches. J Proteome Res. 2013;12:4627–4641. doi: 10.1021/pr4005794. [DOI] [PubMed] [Google Scholar]
- 10.Neilson KA, Ali NA, Muralidharan S, Mirzaei M, Mariani M, Assadourian G, Lee A, van Sluyter SC, Haynes PA. Less label, more free: approaches in label-free quantitative mass spectrometry. Proteomics. 2011;11:535–553. doi: 10.1002/pmic.201000553. [DOI] [PubMed] [Google Scholar]
- 11.Wang XQ, Ongkeko WM, Chen L, Yang ZF, Lu P, Chen KK, Lopez JP, Poon RT, Fan ST. Octamer 4 (Oct4) mediates chemotherapeutic drug resistance in liver cancer cells through a potential Oct4-AKT-ATP-binding cassette G2 pathway. Hepatology. 2010;52:528–539. doi: 10.1002/hep.23692. [DOI] [PubMed] [Google Scholar]
- 12.Wisniewski JR, Zougman A, Nagaraj N, Mann M. Universal sample preparation method for proteome analysis. Nat Methods. 2009;6:359–362. doi: 10.1038/nmeth.1322. [DOI] [PubMed] [Google Scholar]
- 13.Cox J, Mann M. MaxQuant enables high peptide identification rates, individualized p. p.b.-range mass accuracies and proteome-wide protein quantification. Nat Biotechnol. 2008;26:1367–1372. doi: 10.1038/nbt.1511. [DOI] [PubMed] [Google Scholar]
- 14.Cox J, Neuhauser N, Michalski A, Scheltema RA, Olsen JV, Mann M. Andromeda: a peptide search engine integrated into the MaxQuant environment. J Proteome Res. 2011;10:1794–1805. doi: 10.1021/pr101065j. [DOI] [PubMed] [Google Scholar]
- 15.Zhang W, Chen Z, Chen LK, Wang F, Li FR, Wang XK, Fu LW. ABCG2-overexpressing H460/MX20 cell xenografts in athymic nude mice maintained original biochemical and cytological characteristics. Sci Rep. 2017;7:40064. doi: 10.1038/srep40064. [DOI] [PMC free article] [PubMed] [Google Scholar]
- 16.Chao TT, Wang CY, Chen YL, Lai CC, Chang FY, Tsai YT, Chao CH, Shiau CW, Huang YC, Yu CJ, Chen KF. Afatinib induces apoptosis in NSCLC without EGFR mutation through Elk-1-mediated suppression of CIP2A. Oncotarget. 2015;6:2164–2179. doi: 10.18632/oncotarget.2941. [DOI] [PMC free article] [PubMed] [Google Scholar]
- 17.Lesley SA. High-throughput proteomics: protein expression and purification in the postgenomic world. Protein Expr Purif. 2001;22:159–164. doi: 10.1006/prep.2001.1465. [DOI] [PubMed] [Google Scholar]
- 18.Rodriguez-Aller M, Gurny R, Veuthey JL, Guillarme D. Coupling ultra high-pressure liquid chromatography with mass spectrometry: constraints and possible applications. J Chromatogr A. 2013;1292:2–18. doi: 10.1016/j.chroma.2012.09.061. [DOI] [PubMed] [Google Scholar]
- 19.Srinivas PR, Srivastava S, Hanash S Jr, Wright GL. Proteomics in early detection of cancer. Clin Chem. 2001;47:1901–1911. [PubMed] [Google Scholar]
- 20.Liguori M, Qualtieri A, Tortorella C, Direnzo V, Bagala A, Mastrapasqua M, Spadafora P, Trojano M. Proteomic profiling in multiple sclerosis clinical courses reveals potential biomarkers of neurodegeneration. PLoS One. 2014;9:e103984. doi: 10.1371/journal.pone.0103984. [DOI] [PMC free article] [PubMed] [Google Scholar]
- 21.Télot L, Rousseau E, Lesuisse E, Garcia C, Morlet B, Léger T, Camadro JM, Serre V. Quantitative proteomics in Friedreich’s ataxia B-lymphocytes: a valuable approach to decipher the biochemical events responsible for pathogenesis. Biochim Biophys Acta. 2018;1864:997–1009. doi: 10.1016/j.bbadis.2018.01.010. [DOI] [PubMed] [Google Scholar]
- 22.Duijvesz D, Burnum-Johnson KE, Gritsenko MA, Hoogland AM, Vredenbregt-van den Berg MS, Willemsen R, Luider T, Pasa-Tolic L, Jenster G. Proteomic profiling of exosomes leads to the identification of novel biomarkers for prostate cancer. PLoS One. 2013;8:e82589. doi: 10.1371/journal.pone.0082589. [DOI] [PMC free article] [PubMed] [Google Scholar]
- 23.Nicholson JK, Connelly J, Lindon JC, Holmes E. Metabonomics: a platform for studying drug toxicity and gene function. Nat Rev Drug Discov. 2002;1:153–161. doi: 10.1038/nrd728. [DOI] [PubMed] [Google Scholar]
- 24.Roth S, Rottach A, Lotz-Havla AS, Laux V, Muschaweckh A, Gersting SW, Muntau AC, Hopfner KP, Jin L, Vanness K, Petrini JHJ, Drexler I, Leonhardt H, Ruland J. Rad50-CARD9 interactions link cytosolic DNA sensing to IL-1β production. Nat Immunol. 2014;15:538–545. doi: 10.1038/ni.2888. [DOI] [PMC free article] [PubMed] [Google Scholar]