

Abstract
Mortality is high in patients with locally advanced HER2-negative breast cancer, especially those with residual tumor after neoadjuvant chemotherapy (NAC). Tissue-specific long non-coding RNAs (lncRNAs) are responsible for specific breast cancer subtypes. To identify the lncRNAs involved in residual cancer tissues (RCTs) and to evaluate their potential for predicting HER2-negative breast cancer response to NAC, we used three paired tissues to compare differences in gene expression between RCTs and remittent tissues (RTs) after NAC in human HER2-negative breast cancer. Subsequently, we detected expression of the top ten up-regulated and down-regulated lncRNAs in 11 paired tissues via quantitative RT-PCR analysis. Finally, we explored the potential function of these dysregulated lncRNAs through bioinformatics analysis. Our results indicate that 1348 mRNAs and 183 lncRNAs were differentially expressed in RCTs compared with RTs, and the expression levels of four novel lncRNAs (DSCAM-AS1, LINC01508, lnc-MGST1-2 and lnc-BTG2-2) were in agreement with the microarray analysis results. Furthermore, we found that the expression level of LINC01508 was significantly related to poor prognosis, suggesting that LINC01508 is a potential biomarker for predicting breast cancer response to NAC, which might be helpful in exploring potential diagnostic factors and therapeutic targets for chemo-resistant HER2-negative breast cancer.
Keywords: HER2-negative breast cancer, neoadjuvant chemotherapy, chemo-resistance, gene expression microarray, long non-coding RNAs/lncRNAs
Introduction
Breast cancer (BC) is the second leading cause of cancer mortality among women worldwide [1]. Based on global transcriptomic analysis, BC is subdivided into different molecular subtypes, including luminal A, luminal B, HER2-enriched, claudin-low, basal-like, and normal breast-like subtypes [2,3]. Moreover, luminal B BC can be further classified as either HER2 positive or HER2 negative [4]. For HER2-negative BC, the therapeutic strategy is restricted to chemotherapy and endocrine therapy. However, some patients acquire chemo-resistance during chemotherapy, which leads to treatment failure and high mortality. Therefore, it is important to clarify the molecular mechanism of chemotherapy resistance in HER2-negative BC patients.
Neoadjuvant chemotherapy (NAC) is associated with rates of disease-free survival (DFS) and overall survival (OS) comparable to those for adjuvant (post-surgical) chemotherapy [5]. NAC is standard in locally advanced and operable BC because it is intended to shrink the tumor and improve the chance for breast-conserving surgery [6]. BC represents a highly heterogeneous disease due to its diverse clinical outcomes and biological behavior [7]. Pathological complete response (pCR) is the best predictor of patient outcome after NAC [6,8,9]. Clinical trials have found that different BC subtypes have different rates of pCR and that patients who show pCR have a different prognosis depending on subtype [10]. Many studies and clinical observations have demonstrated that the prognosis of the luminal subtype is better than that of HER2-positive or triple-negative BC (TNBC). However, Niikura et al. [11] have suggested that patients with luminal tumors have lower pCR rates than those with HER2-positive or triple-negative tumors. The differential response in a single BC tumor tissue may be caused by clinical heterogeneity, which is an inherent feature of breast tumors. In residual cancer tissues (RCTs), the shape and structure of some cancer cells are changed [12], and cells can develop drug resistance. Thus, we speculate that the heterogeneity of BC tumor tissues after NAC may lead to poor outcomes, and the residual tumor is a critical indicator of treatment failure.
Long non-coding RNAs (lncRNAs) are defined as RNA genes longer than 200 bp with no coding potential [13], and recent studies have shown that lncRNA gene silencing is involved in chromatin modification, transcriptional activation, and many other important biological process [14]. In studies of lncRNAs in BC, several well-known lncRNAs have been identified to regulate BC endocrinotherapy [15,16], such as HOTAIR [15,16], lncRNA-ARA [17] and lncRNA-PANDA [18]. However, there is little information reported about the link between systematic expression of lncRNAs and HER2-negative BC.
In this study, we performed microarray analysis to establish an mRNA and lncRNA gene expression profile to identify genes that are differentially expressed between RCTs and remittent tissues (RTs) of HER2-negative BC after NAC. We also performed lab experiments and bioinformatics analysis to analyze the biological functions of the genes to identify mRNAs or lncRNAs that play important roles in chemo-resistance, with the goal of providing new targets for chemo-resistance studies of HER2-negative BC.
Materials and methods
Tissue collection
In this study, we recruited 48 BC patients who had undergone NAC, from which 34 patients were excluded according to our inclusion criteria, which is presented in Figure 1. BC tissue samples consisting of RCTs and RTs from patients who had invasive BC diagnosed histopathologically and had been treated with NAC were collected consecutively between September 2015 and May 2016. None of these patients accepted radiotherapy or endocrine therapy prior to breast tumor resection. The RTs were resected 2 mm from the edge of the tumor (according to the standard of safe cutting for breast-conserving surgery after NAC [19]). This study and the necessary sample collection were approved by the Ethical Review Committee of the Second Xiangya Hospital of Central South University.
Figure 1.
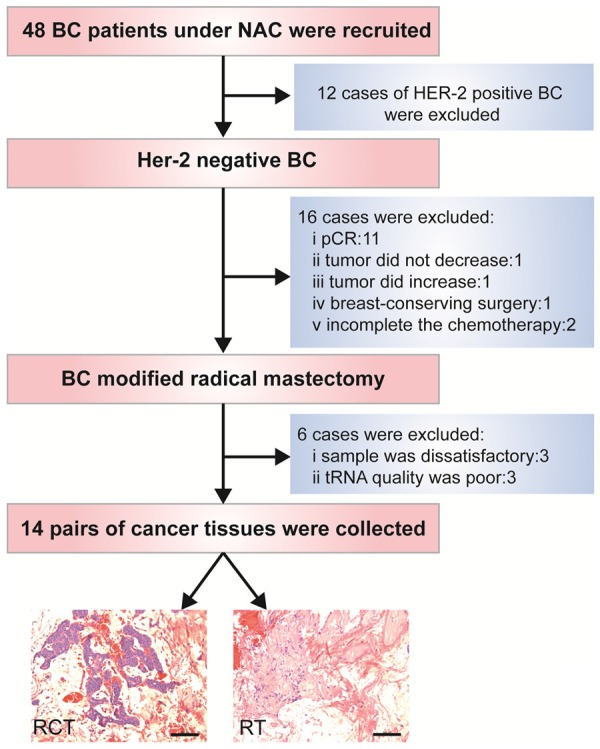
Flowchart of inclusion criteria for patient enrollment.
RNA extraction and quality control
To isolate total RNA from each tissue, frozen tissues were resuspended in TRIzol reagent (Life Technologies) and were finally eluted into 100 μL of Elution Solution according to the manufacturer’s instructions. Quantification and quality checks were performed with a NanoDrop ND-2000 spectrophotometer (Thermo Scientific). All the RNA samples were stored at -80°C until further analysis.
LncRNA and mRNA microarray expression profiling
An Agilent Human Gene Expression (8*60 K, Design ID: 039494) microarray was used in this study. The lncRNAs were obtained from authoritative databases (i.e., RefSeq, Ensembl, UCSC Known genes, and LNCipedia) and related literature. The mRNAs were collected from RefSeq and GENCODE. Each transcript was represented by a specific exon or splice junction probe, which could identify individual transcripts accurately. Sample labeling, microarray hybridization, and washing were performed based on the Agilent One-Color Microarray-Based Gene Expression Analysis protocol (Agilent Technology). Briefly, total RNA was transcribed to double-stranded cDNA, synthesized into cRNA and labeled with cyanine-3-CTP. Labeled cRNAs were hybridized onto the microarray. After washing, the arrays were scanned with an Agilent Scanner G2505C (Agilent Technologies) and microarray profiling was conducted in the laboratory of the OE Biotechnology Company in Shanghai, People’s Republic of China.
Microarray results analysis and prediction of the functions of lncRNAs
Differential mRNA and lncRNA expression level based on microarray analysis
Feature Extraction software (version 10.7.1.1, Agilent Technologies) was used to analyze the array images to obtain the raw data. GeneSpring (version 13.1, Agilent Technologies) was employed to complete the basic analysis of the raw data. Differentially expressed genes were then identified through the observed fold change (FC), and P values were calculated with a t-test. The threshold set for up- and down-regulated genes was an FC≥2.0 and a P value ≤0.05.
Co-expression of lncRNAs with mRNAs and function prediction
The gene ontology (GO) project provides a controlled vocabulary to describe gene and gene product attributes (http://www.geneontology.org) and has been widely used in large-scale genomic and transcriptional data functional studies. KEGG pathway analysis offered us a reliable method to elucidate the candidate biological pathways in which the lncRNAs interacted with the mRNAs. In this study, a bioinformatics analysis was performed to annotate the functional roles of the mRNAs, which were significantly correlated with the aforementioned lncRNAs.
qRT-PCR validation of 3 differentially expressed lncRNAs
Quantitative real-time PCR was performed to validate the microarray experiments using an independent cohort of 11 paired BC RCT and RT samples. Total RNA was extracted following the manufacturer’s protocols for each kit. RNA quality was confirmed using a NanoDrop 1000 spectrophotometer. An OD260/280 of approximately 1.8 was set as the criterion of acceptable purity. Reverse transcription was performed by following the manufacturer’s protocols for a First Strand cDNA Synthesis Kit. The relative levels of the top ten up-regulated and down-regulated lncRNAs were determined via quantitative real-time PCR, which was performed using ABI Power SYBR1Green PCR Master Mix (Applied Biosystems, USA). Relative lncRNA expression levels were calculated using the 2-ΔΔCt method and were normalized to β-actin expression.
Kaplan-Meier analysis
The prognostic value of lncRNA expression was evaluated using the online database Kaplan-Meier Plotter (www.kmplot.com), which contained lncRNA expression data and survival information for 761 clinical BC patients. To analyze the relapse-free survival (RFS) of patients with BC, patient samples were split into two groups by median expression (high vs. low expression) and assessed using a Kaplan-Meier survival curve, with a hazard ratio (HR) with 95% confidence intervals (CI) and a log-rank P value.
Results
General expression profiles of differentially expressed lncRNAs and mRNAs
Feature Extraction software was used to obtain standardized data (Table 1). In unsupervised hierarchical clustering analysis, the differentially expressed lncRNAs were used to generate a heat map (Figure 2A). In total, 1801 genes were significantly altered (FC>2; P<0.05) in 3 pairs of samples, including 1348 mRNAs, 183 lncRNAs and 270 other genes (Figure 2B). The chromosome location data showed the number of up- or down-regulated lncRNAs located on specific human chromosomes (Figure 2C).
Table 1.
The top 20 dysregulated lncRNAs (RCT vs. RT)
| LncRNAs | P-value | FC | Regulation |
|---|---|---|---|
| TRHDE-AS1 | 0.012647376 | 124.45968 | Down |
| DSCAM-AS1 | 0.027974129 | 115.70292 | Up |
| Lnc-MGST1-2 | 0.04264511 | 82.2943 | Down |
| LINC01070 | 0.044032626 | 65.88673 | Down |
| XLOC_l2_008043 | 0.023433592 | 46.68634 | Down |
| lnc-BTG2-2 | 0.018294355 | 36.8005 | Down |
| PP14571 | 0.04138621 | 35.61804 | Up |
| PGM5P3-AS1 | 0.002629558 | 35.59262 | Down |
| LINC01497 | 0.010669898 | 35.54846 | Down |
| LOC284825 | 0.008203023 | 27.27142 | Down |
| LINCR-0003 | 0.030180234 | 27.17261 | Down |
| MEOX2-AS1 | 0.034956995 | 25.0278 | Down |
| lnc-CCDC74A-1 | 0.04868132 | 17.09113 | Up |
| LINC01136 | 0.018502263 | 16.6816 | Up |
| HOTAIR | 0.029617796 | 12.68415 | Up |
| lnc-C10orf96-1 | 0.03701051 | 8.49516 | Up |
| XLOC_l2_011873 | 0.03658473 | 8.17016 | Up |
| PVT1 | 0.026796862 | 7.97259 | Up |
| LINC01508 | 0.028164737 | 7.10403 | Up |
| lnc-CNTNAP5-2 | 0.020194884 | 6.84649 | Up |
Figure 2.
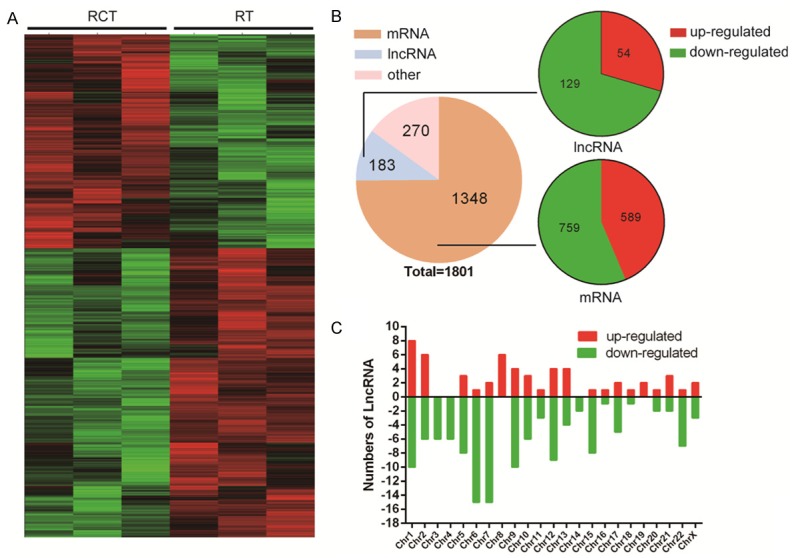
LncRNA microarray data of three paired BC tissues (between RCT and RT). The lncRNA expression patterns in samples is shown as a heatmap based on hierarchical clustering (A); Using second-generation RNA microarray analysis, 1801 RNAs (log fold-changes >2) were detected. Pie chart showing the proportion of components (B); Chromosome distribution showing the number of up- or down-regulated lncRNAs located in different chromosomes (C).
LncRNA function prediction
Hundreds of lncRNAs were co-expressed with thousands of mRNAs. The lncRNAs were clustered into hundreds of GO and KEGG pathway annotations, and the top ten GO biological processes and KEGG pathways enriched for the up-regulated or down-regulated lncRNAs are presented in Figure 3. In our results, “positive regulation of cell proliferation” was enriched in GO biological process for down-regulated lncRNAs, while “drug metabolism-cytochrome P450” was enriched in the KEGG pathway for down-regulated lncRNAs, which indicates the possibility that the down-regulated lncRNAs participate in the chemo-resistance process.
Figure 3.

GO and KEGG pathway analysis. The top 10 GO terms associated with the coding gene functions of up-regulated lncRNAs (left upper panel) and down-regulated lncRNAs (right upper panel) are listed. The top 10 pathways associated with the coding genes of up-regulated lncRNAs (left lower panel) and down-regulated lncRNAs (right lower panel) are listed.
RT-PCR confirmation and prognostic value
To validate the microarray data, the top ten up-regulated and down-regulated lncRNAs were examined by RT-PCR in 11 pairs of BC tissues (RCT and paired RT). In our results, we found that the expression of two up-regulated lncRNAs (LINC01508 and DSCAM-AS1) and two down-regulated lncRNAs (lnc-MGST1-2 and lnc-BTG2-2) was consistent with the microarray analysis and showed a significant difference between RCT and RT (Figure 4A).
Figure 4.
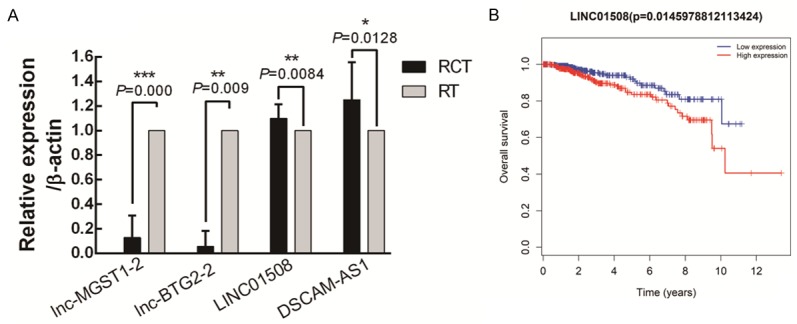
Validation of dysregulated lncRNAs and prediction of their prognostic value. We selected 20 lncRNAs (the top ten up-regulated and down-regulated lncRNAs) for real-time PCR quantification in 11 paired BC tissues. The data show that lnc-MGST1-2 and lnc-BTG2-2 are down-regulated in the residual cancer tissues, while LINC01508 and DSCAM-AS1 are significantly up-regulated in the residual cancer tissues compared with their levels in the remittent tissues (A). Prognostic value of the LINC01508 expression level in BC patients (B).
We also predicted the prognostic value of lncRNA expression using Kaplan-Meier Plotter, and the clinical data co-related to 11 lncRNAs (6 up-regulated lncRNAs and 5 down-regulated lncRNAs) was acquired from TCGA database (The Cancer Genome Atlas). Interestingly, we found that the expression level of the novel lncRNA LINC01508 was significantly related to the overall survival of BC patients (P=0.014), and a high LINC01508 expression level indicated a poor BC patient prognosis (Figure 4B).
Discussion
BC is the most frequently diagnosed cancer in females, and a large number of patients, especially those with HER2-negative BC, experience treatment failure due to recurrence and metastasis. Various drugs have been approved for BC, but the acquisition of resistance remains a substantial obstacle for clinical management of the disease. After chemotherapy, the morphology and structure of some cancer cells are altered in RCTs. These tissues are characterized by degeneration of cancer cells, proliferation of fibrous tissue cells and infiltration of lymphocytes [12]. Additionally, epithelium- and cancer stem cell-related markers have been found in RCTs [20]. At the same time, drug resistance is enhanced in residual cancer cells. The resistant and normal tumor stem cells exhibit the same pattern of accumulated mutations, which leads to newly acquired drug resistance via gene activation, point mutations and gene amplification [21]. However, the specific mechanism is unclear. Therefore, elucidation of these molecular mechanisms, particularly the mechanism associated with chemotherapy resistance, is crucial for better prediction of BC patient outcome and response to therapy.
Although study of lncRNAs has increased rapidly, only a few lncRNAs are well understood. Among the 183 differentially expressed lncRNAs we identified from the microarray results, only four were verified to be dysregulated in chemo-resistant tissues. Expression of lncRNAs exhibits temporal-spatial specificity. For instance, different lncRNAs derived from different types of tumor tissues and specific tissue-based lncRNAs are responsible for specific subtypes of BC. Therefore, determining how to design different groups for analysis is critical for identifying the subset-specific lncRNAs. This study is the first to perform a microarray analysis comparing RCTs and RTs, and the majority of the differentially expressed lncRNAs we found have seldom been reported previously.
The new lncRNAs are generally less evolutionarily conserved than known lncRNAs, with a large fraction unique to humans or primates. Our predicted function results showed enrichment in hundreds of biological processes and pathways, among which we found some cancer behaviors that were specifically enriched in the down-regulated lncRNA group, indicating that chemo-resistance is related to silencing of tumor suppressor genes. Through analysis of RNA-seq samples in a cohort of 947 BC patients, Yashar et al. [22] found that DSCAM-AS1 was down-regulated in BC tissues and participated in tumor progression and tamoxifen resistance.
Although the present results provided obvious evidence of some novel lncRNAs that may serve as BC biomarkers of poor survival, such as LINC01508, whose overexpression in BC tissues was related to poor clinical outcomes based on comparison of the Kaplan-Meier plots, further research should be performed in the future to verify our results. Particularly, it is difficult to obtain information regarding the location of the novel lncRNAs and the specific mechanisms underlying the process of BC cell proliferation, invasion, metastasis. In addition, we plan to use in vivo and in vitro experiments to further study the specific role of the differentially expressed genes in HER2-negative BC in chemo-resistance mechanisms.
Acknowledgements
This work was supported by the National Natural Science Foundation of China (81441084), the Natural Science Foundation of Hunan Province of China (2015jj4059), the Development and Reform Commission of Hunan Province of China (201465), and the Hunan Provincial Innovation Foundation for Postgraduate (No. CX2017B073).
Disclosure of conflict of interest
None.
References
- 1.Siegel RL, Miller KD, Jemal A. Cancer statistics, 2016. CA Cancer J Clin. 2016;66:7–30. doi: 10.3322/caac.21332. [DOI] [PubMed] [Google Scholar]
- 2.Holliday DL, Speirs V. Choosing the right cell line for breast cancer research. Breast Cancer Res. 2011;13:215. doi: 10.1186/bcr2889. [DOI] [PMC free article] [PubMed] [Google Scholar]
- 3.Prat A, Perou CM. Deconstructing the molecular portraits of breast cancer. Mol Oncol. 2011;5:5–23. doi: 10.1016/j.molonc.2010.11.003. [DOI] [PMC free article] [PubMed] [Google Scholar]
- 4.Gnant M, Thomssen C, Harbeck N. St. Gallen/Vienna 2015: a brief summary of the consensus discussion. Breast Care (Basel) 2015;10:124–130. doi: 10.1159/000430488. [DOI] [PMC free article] [PubMed] [Google Scholar]
- 5.Mauri D, Pavlidis N, Ioannidis JP. Neoadjuvant versus adjuvant systemic treatment in breast cancer: a meta-analysis. J Natl Cancer Inst. 2005;97:188–194. doi: 10.1093/jnci/dji021. [DOI] [PubMed] [Google Scholar]
- 6.Bonadonna G, Valagussa P, Brambilla C, Ferrari L. Preoperative chemotherapy in operable breast cancer. Lancet. 1993;341:1485. doi: 10.1016/0140-6736(93)90933-8. [DOI] [PubMed] [Google Scholar]
- 7.Weigelt B, Geyer FC, Reis-Filho JS. Histological types of breast cancer: how special are they? Mol Oncol. 2010;4:192–208. doi: 10.1016/j.molonc.2010.04.004. [DOI] [PMC free article] [PubMed] [Google Scholar]
- 8.Cortazar P, Zhang L, Untch M, Mehta K, Costantino JP, Wolmark N, Bonnefoi H, Cameron D, Gianni L, Valagussa P, Swain SM, Prowell T, Loibl S, Wickerham DL, Bogaerts J, Baselga J, Perou C, Blumenthal G, Blohmer J, Mamounas EP, Bergh J, Semiglazov V, Justice R, Eidtmann H, Paik S, Piccart M, Sridhara R, Fasching PA, Slaets L, Tang S, Gerber B, Geyer CJ, Pazdur R, Ditsch N, Rastogi P, Eiermann W, von Minckwitz G. Pathological complete response and long-term clinical benefit in breast cancer: the CTNeoBC pooled analysis. Lancet. 2014;384:164–172. doi: 10.1016/S0140-6736(13)62422-8. [DOI] [PubMed] [Google Scholar]
- 9.von Minckwitz G, Untch M, Blohmer JU, Costa SD, Eidtmann H, Fasching PA, Gerber B, Eiermann W, Hilfrich J, Huober J, Jackisch C, Kaufmann M, Konecny GE, Denkert C, Nekljudova V, Mehta K, Loibl S. Definition and impact of pathologic complete response on prognosis after neoadjuvant chemotherapy in various intrinsic breast cancer subtypes. J. Clin. Oncol. 2012;30:1796–1804. doi: 10.1200/JCO.2011.38.8595. [DOI] [PubMed] [Google Scholar]
- 10.Lv M, Xu P, Wu Y, Huang L, Li W, Lv S, Wu X, Zeng X, Shen R, Jia X, Yin Y, Gu Y, Yuan H, Xie H, Fu Z. LncRNAs as new biomarkers to differentiate triple negative breast cancer from non-triple negative breast cancer. Oncotarget. 2016;7:13047–13059. doi: 10.18632/oncotarget.7509. [DOI] [PMC free article] [PubMed] [Google Scholar]
- 11.Niikura N, Tomotaki A, Miyata H, Iwamoto T, Kawai M, Anan K, Hayashi N, Aogi K, Ishida T, Masuoka H, Iijima K, Masuda S, Tsugawa K, Kinoshita T, Nakamura S, Tokuda Y. Changes in tumor expression of HER2 and hormone receptors status after neoadjuvant chemotherapy in 21 755 patients from the Japanese breast cancer registry. Ann Oncol. 2016;27:480–487. doi: 10.1093/annonc/mdv611. [DOI] [PubMed] [Google Scholar]
- 12.Cho CW. Formulation strategy to overcome multi-drug resistance (MDR) Arch Pharm Res. 2011;34:511–513. doi: 10.1007/s12272-011-0400-0. [DOI] [PubMed] [Google Scholar]
- 13.Ponting CP, Oliver PL, Reik W. Evolution and functions of long noncoding RNAs. Cell. 2009;136:629–641. doi: 10.1016/j.cell.2009.02.006. [DOI] [PubMed] [Google Scholar]
- 14.Guttman M, Amit I, Garber M, French C, Lin MF, Feldser D, Huarte M, Zuk O, Carey BW, Cassady JP, Cabili MN, Jaenisch R, Mikkelsen TS, Jacks T, Hacohen N, Bernstein BE, Kellis M, Regev A, Rinn JL, Lander ES. Chromatin signature reveals over a thousand highly conserved large non-coding RNAs in mammals. Nature. 2009;458:223–227. doi: 10.1038/nature07672. [DOI] [PMC free article] [PubMed] [Google Scholar]
- 15.Xue X, Yang YA, Zhang A, Fong KW, Kim J, Song B, Li S, Zhao JC, Yu J. LncRNA HOTAIR enhances ER signaling and confers tamoxifen resistance in breast cancer. Oncogene. 2016;35:2746–2755. doi: 10.1038/onc.2015.340. [DOI] [PMC free article] [PubMed] [Google Scholar]
- 16.Wang YL, Overstreet AM, Chen MS, Wang J, Zhao HJ, Ho PC, Smith M, Wang SC. Combined inhibition of EGFR and c-ABL suppresses the growth of triple-negative breast cancer growth through inhibition of HOTAIR. Oncotarget. 2015;6:11150–11161. doi: 10.18632/oncotarget.3441. [DOI] [PMC free article] [PubMed] [Google Scholar]
- 17.Jiang M, Huang O, Xie Z, Wu S, Zhang X, Shen A, Liu H, Chen X, Wu J, Lou Y, Mao Y, Sun K, Hu S, Geng M, Shen K. A novel long non-coding RNA-ARA: adriamycin resistance-associated. Biochem Pharmacol. 2014;87:254–283. doi: 10.1016/j.bcp.2013.10.020. [DOI] [PubMed] [Google Scholar]
- 18.Li XJ, Zha QB, Ren ZJ, Tang JH, Yao YF. Mechanisms of breast cancer resistance to anthracyclines or taxanes: an overview of the proposed roles of noncoding RNA. Curr Opin Oncol. 2015;27:457–465. doi: 10.1097/CCO.0000000000000235. [DOI] [PubMed] [Google Scholar]
- 19.Mittendorf EA, Buchholz TA, Tucker SL, Meric-Bernstam F, Kuerer HM, Gonzalez-Angulo AM, Bedrosian I, Babiera GV, Hoffman K, Yi M, Ross MI, Hortobagyi GN, Hunt KK. Impact of chemotherapy sequencing on local-regional failure risk in breast cancer patients undergoing breast-conserving therapy. Ann Surg. 2013;257:173–179. doi: 10.1097/SLA.0b013e3182805c4a. [DOI] [PMC free article] [PubMed] [Google Scholar]
- 20.Das M, Sahoo SK. Folate decorated dual drug loaded nanoparticle: role of curcumin in enhancing therapeutic potential of nutlin-3a by reversing multidrug resistance. PLoS One. 2012;7:e32920. doi: 10.1371/journal.pone.0032920. [DOI] [PMC free article] [PubMed] [Google Scholar]
- 21.Jwa E, Shin KH, Kim JY, Park YH, Jung SY, Lee ES, Park IH, Lee KS, Ro J, Kim YJ, Kim TH. Locoregional recurrence by tumor biology in breast cancer patients after preoperative chemotherapy and breast conservation treatment. Cancer Res Treat. 2016;48:1363–1372. doi: 10.4143/crt.2015.456. [DOI] [PMC free article] [PubMed] [Google Scholar]
- 22.Niknafs YS, Han S, Ma T, Speers C, Zhang C, Wilder-Romans K, Iyer MK, Pitchiaya S, Malik R, Hosono Y, Prensner JR, Poliakov A, Singhal U, Xiao L, Kregel S, Siebenaler RF, Zhao SG, Uhl M, Gawronski A, Hayes DF, Pierce LJ, Cao X, Collins C, Backofen R, Sahinalp CS, Rae JM, Chinnaiyan AM, Feng FY. The lncRNA landscape of breast cancer reveals a role for DSCAM-AS1 in breast cancer progression. Nat Commun. 2016;7:12791. doi: 10.1038/ncomms12791. [DOI] [PMC free article] [PubMed] [Google Scholar]