Abstract
Purpose:
The aim of this study was to evaluate the benefit of using quantitative diffusion-weighted imaging (DWI) with apparent diffusion coefficient (ADC) mapping in the initial diagnosis and post-therapeutic follow-up of extremity soft tissue masses.
Patients and Methods:
This study included 90 patients with extremity soft tissue masses. The DWI was obtained with 3 b values, including 0, 400, and 800 s/mm2. Calculation of the ADC value of the lesion was done by placing the region of interest (ROI) to include the largest area of the lesion. ADC values were compared with the histopathology. Eighteen patients had posttherapeutic magnetic resonance imaging (MRI).
Results:
Benign masses, fibromatosis, and malignant soft tissue masses had mean ADC values of 1.18 ± 1.0191 × 10⁻³ mm2/s; 1.31 ± 0.245 × 10⁻³ mm2/sec; and 1.3 ± 0.7 × 10⁻³ mm2/s, respectively. Myxomatous malignant masses had an ADC value of 2.6 ± 0.55 × 10⁻³ mm2/s, while nonmyxomatous malignant masses had an ADC value of 1.1 ± 0.8 × 10⁻³ mm2/s. ADC cutoff value between benign and non-benign (including malignant and locally aggressive masses) was 0.6 × 10⁻³ mm2/sec with 98.3% sensitivity and 50% specificity (P = 0.5123). The statistical difference between malignant soft tissue masses (mean ADC 1.309 ± 0.723 × 10⁻³ mm2/s) and fibromatosis masses (mean ADC value 1.31 ± 0.245 × 10⁻³ mm2/s) using a comparative T-test proved to be of poor significance level (P value ~ 0.9757). Nine patients with soft tissue sarcomas (STSs) had pre and post-therapeutic MRI examinations showing a mean increase of the recorded ADC values by about 0.28 × 10⁻³ mm2/s in the post-therapy study as compared with the recorded initial pretreatment values. Analysis of the post-therapy follow-up studies of fibromatosis showed that lesions with favorable response to chemotherapy or radiotherapy (8/12) exhibited significantly lower ADC values than those showing progressive disease course.
Conclusion:
DWI with ADC mapping of extremity soft tissue tumors are so complicated that they alone may not be of much value in differentiating between benign and malignant tumors; however, it can be used as a tool for monitoring response to treatment.
Keywords: Diffusion-weighted imaging, post-therapeutic, soft tissue sarcomas
Introduction
Soft tissue sarcomas/tumors (STSs) are a diversified class of neoplasia that have diagnostic and therapeutic problems for clinical care.[1]
Diffusion-weighted imaging (DWI) has been presumed to have the ability to discriminate between benign and malignant soft tissue tumors because malignant tumors have more cellularity and, therefore, have more restricted diffusion than benign tumors.[2]
The diagnosis of such masses remains a challenge for the clinician because malignant and benign tumors, as well as non-neoplastic masses, following inflammation or trauma, have a similar presentation.[3]
Magnetic resonance imaging (MRI) is the modality of choice to evaluate soft tissue masses. In spite of the presence of some MRI findings indicative of malignancy, such as infiltration of adjacent tissues, osseous destruction, and the size of the mass, there are no clear standards to discriminate benign masses from malignancies. Thus, the histopathologic workup is still required for the reliable characterization of soft tissue masses. DWI may reveal the microstructure of such masses and may, therefore, be helpful to distinguish.[3]
DWI allows quantitative and qualitative analyses of tissue cellularity and cell membrane integrity and has been widely used for tumor detection and characterization and to monitor treatment response.[4]
The aim of this work is to evaluate the ability of DW-MRI in the characterization of the extremity soft tissue tumors, determining whether they are potentially benign or malignant and trying to define a threshold or cutoff ADC values for benign and malignant tumors.
Patients and Methods
Patients
The study population included 90 patients presenting with extremity soft tissue masses for an initial assessment at the National Cancer Institute in Egypt. The Ethical Committee of Faculty of Medicine, Cairo University in compliance with the Helsinki Declaration approved this study on March 2015. The patients age ranged from 1 to 75 years with the mean age of 36 years. We performed a prospective, lesion-based analysis for 108 newly diagnosed soft tissue lesions. We also include post-therapeutic follow-up imaging for 18 patients.
Magnetic resonance imaging
The patients had their MRI done on a high field system (1.5 Tesla [T]) closed magnet unit (Phillips Achieva XR) using the optimal surface coil to cover the examined area for each patient.
Imaging protocol
All the patients underwent a full MRI exam, including conventional MRI sequences, DWI, and post gadolinium (Gd) diethylenetriamine penta-acetic acid (DTPA) magnetic resonance (MR) sequences. The DWI was obtained using 3 b values, including 0, 400, and 800 s/mm2.
Conventional magnetic resonance imaging evaluation
The morphological features of each lesion were recorded, including signal characteristics and pattern of enhancement. The provisional diagnosis was reported.
Diffusion-weighted imaging evaluation
DWI images were reviewed the DW images and ADC maps for the final radiological characterization of the masses. The lesion was identified on the DWI and ADC maps by using the conventional MR images as a guide. Measurements were done via placing the region of interest (ROI) to include the largest area of the lesion. For each lesion, the minimum and mean ADC values were recorded (ADC mean and ADC minimum).
Statistical analysis
Statistical analysis was performed using statistical software (Med-calc). Numerical data were expressed as a mean and standard deviation (SD) or median and range as appropriate. Qualitative data were expressed as frequency and percentage.
Receiver operator characteristic (ROC) analysis was done to select the best cutoff point for ADC value. The findings on MRI were analyzed and correlated with histopathological findings after needle biopsy or resection or with previous imaging and investigations when available. A P < 0.05 was considered as statistically significant.
Results
The study included 108 newly diagnosed soft tissue lesions. Their histologic diagnoses were as follows:
Fibromatosis (n = 42), dermatofibrosarcoma protuberans (n = 4), neurofibroma (n = 3), lipoma (n = 9), hemangioma (n = 5) schwannoma (n = 1), paraganglioma (n = 1), giant cell tumor of the tendon sheath (n = 1)/synovial sarcoma (n = 6)/rhabdomyosarcoma (n = 7), myxoliposarcoma (n = 6), undifferentiated sarcoma (n = 7)/malignant melanoma (n = 2), squamous cell carcinoma (n = 3), mucor fungoides (n = 1), leiomyosarcoma (n = 1), high grade sarcoma (n = 3), myxofibrosarcoma (n = 1), low grade sarcoma (n = 2), malignant nerve sheath tumor (n = 1), liposarcoma (n = 1), Malignant fibrous histiocytoma (n = 1).
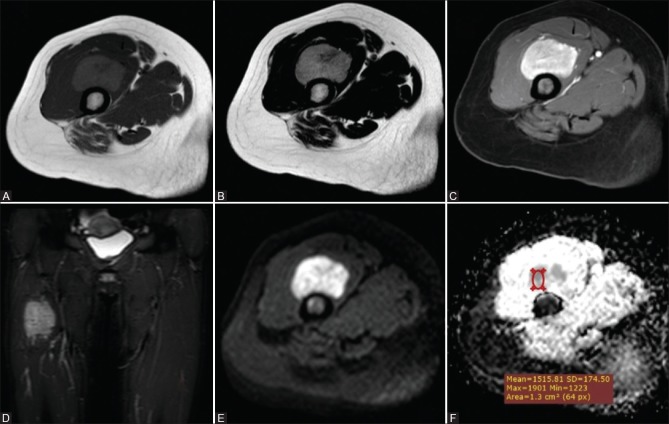
Our study results demonstrated that for benign soft tissue masses, the average of the recorded ADC mean values was 1.18 ± 1.0191 × 10⁻³ mm2/s. The lowest recorded ADC mean value was about 0.1 × 10⁻³ mm2/s (a lipoma) and the highest was about 3.6 × 10⁻³ mm2/s (a hemangioma). The average of the recorded ADC minimum values for this group of lesions was 0.9 ± 0.84 mm2/s; with the lowest ADC minimum value = 0.05 × 10⁻³ mm2/s and the highest ADC minimum value = 2.9 × 10⁻³ mm2/s [Figures 1 and 2].
Figure 1 (A-F).
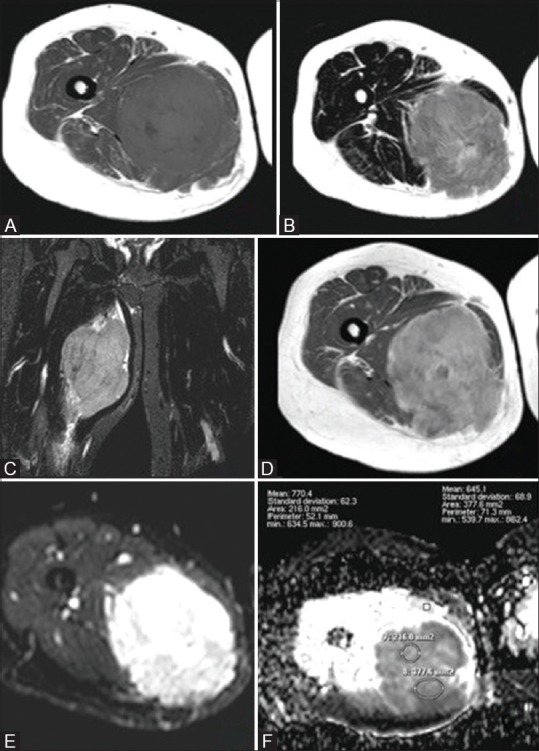
Rhabdomyosarcoma in a 34-year-old woman (A) Axial T1WI and (B) Axial T2WI and (C) Coronal STIR WIs showed a round fairly defined mass with irregular outlines at the mid-thigh eliciting heterogeneous low T1 and high T2/STIR signal with foci of low signal in T1 and high signal in T2 (break down). Postcontrast Axial T1 WIs (D) show intense heterogeneous enhancement with areas of cystic breaking down. Corresponding DWI (E) and ADC maps (F) showed high signal in DWI and low signal on ADC (restricted diffusion) with an ADCmean value = 0.70 × 10⁻³ mm2/s
Figure 2 (A-F).
Paraganglioma in a 20-year-old woman (A) Axial T1WI and (B) Axial T2WI and (C) Postcontrast Axial THRIVE WI (D) Coronal STIR WIs showed a well-defined soft tissue mass is seen involving the anterior thigh compartment at a deep peri-osseous location eliciting isointense to low signal on T1 and heterogeneous isointense and high T2/STIR signal. with intense homogeneous enhancement in postcontrast images. Corresponding DWI (E) and ADC maps (F) showed high signal in DWI and low ADC signal with a ADCmean value = 1.55 × 10⁻³ mm2/s
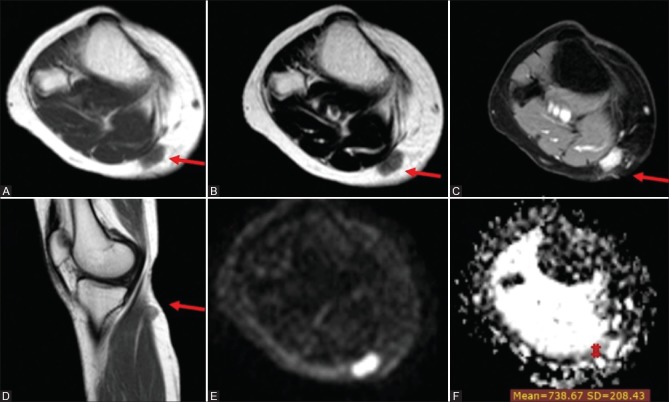
For malignant soft tissue masses, the average of the recorded ADC mean values was 1.3 ± 0.7 × 10⁻³ mm2/s with the lowest recorded value = 0.5 × 10⁻³ mm2/s and highest value = 3.4 × 10⁻³ mm2/s. Meanwhile, the average of the recorded ADC minimum values for this group of lesions was 0.85 ± 0.84 × 10⁻³ mm2/s with the lowest recorded value = 0.3 and the highest value = 3.1 × 10⁻³ mm2/s [Figure 3].
Figure 3 (A-F).
Unclassified soft tissue sarcoma in a 30-year-old woman (A) Axial T1WI (B) Axial T2WI and (C) postcontrast axial Thrive WI and (D) postcontrast sagittal T1 WIs showing well-defined superficial soft tissue nodule seen involving the posteromedial aspect of the upper leg at a subcutaneous location inseparable from the fascia of the medial head of gastrocnemius muscle. It elicits an isointense signal to muscle on T1 WI, isointense to a high signal on T2 WIs with intense homogeneous enhancement on postcontrast series. Corresponding DWI (E) and ADC map (F) showed high signal in DWI and iso to low signal on ADC map with an ADCmean value = 0.74 × 10⁻³ mm2/s
Myxomatous malignant masses had an average ADC mean value of 2.6 + 0.55 × 10⁻³ mm2/s while non-myxomatous malignant masses had an average ADC mean value of 1.1 + 0.8 × 10⁻³ mm2/s.
Regarding the group of lesions diagnosed as fibromatosis, the newly diagnosed cases demonstrated an average ADC mean value of 1.31 ± 0.245 × 10⁻³ mm2/sec and an average ADC minimum value of 0.71 ± 0.4 × 10⁻³ mm2/sec.
Detailed analysis of ADC values is shown in Table 1, including the average ADC ± SD in newly diagnosed benign, malignant, and fibromatosis lesions included in our study.
Table 1.
Average recorded mean and minimum ADC values (×10-3 mm2/sec) in the different pathological entities included in our study
| Final clinical diagnosis | ADCMean | SD | ADCMin | SD |
|---|---|---|---|---|
| Malignant masses | 1.309 | 0.723 | 0.825 | 0.66 |
| Benign masses | 1.18 | 1.0191 | 0.9 | 0.84 |
| Myxoid malignant masses | 2.6 | 0.69 | 1.9 | 0.8 |
| Nonmyxoid malignant masses | 1.1 | 0.35 | 0.64 | 0.31 |
| Fibromatosis | 1.31 | 0.245 | 0.71 | 0.4 |
ADC=Apparent diffusion coefficient, SD=Standard deviation
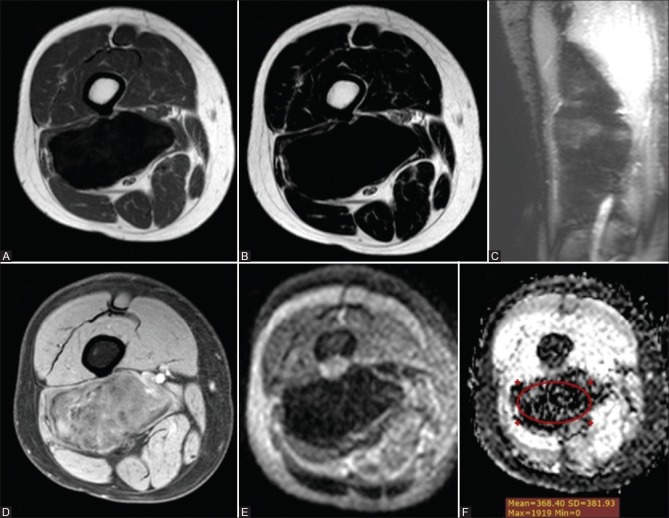
Attempted propagation of the cutoff ADC value between benign and non-benign (including malignant and locally aggressive masses) was 0.6 × 10⁻³ mm2/sec with 98.3% sensitivity and 50% specificity (P = 0.5123) [Figure 4].
Figure 4 (A-F).
Fibromatosis in a 35-year-old man (A) axial T1WI (B) axial T2 WI and (C) coronal STIR WIs showing a well-circumscribed deep soft tissue mass in the posterior muscular compartment of the right thigh along the biceps femoris muscle abutting the lateral aspect of the lower femoral vessels eliciting marked hypointense signal on T1, T2 and STIR WIs. (D) Postcontrast axial THRIVE WIs showed mild heterogeneous enhancement. Corresponding DWI (E) and ADC map (F) showed low signal in DWI and ADC map with a mean ADC value = 0.37 × 10⁻³ mm2/s
Also, attempted propagation of the statistical difference between malignant soft tissue masses (mean ADCmean1.309 ± 0.723 × 10⁻³ mm2/s) and fibromatosis masses (mean ADCmean value 1.31 ± 0.245 × 10⁻³ mm2/s) using a comparative T-test showed a difference of −0.0051, standard error = 0.17, and poor significance level of 0.9757 [Table 2].
Table 2.
Comparative T-test for comparison of ADC values of fibromatosis and malignant masses
| Diagnosis | Mean ADCmean | SD |
|---|---|---|
| Malignant masses | 1.309 | 0.723 |
| Fibromatosis | 1.31 | 0.245 |
T-test Difference -0.0051, Standard error=0.17, Significance level=0.9757, ADC=Apparent diffusion coefficient, SD=Standard deviation
Regarding post-chemo/radiotherapy evaluation of soft tissue sarcoma patients
Follow-up MR examinations were available for nine patients with STS who received chemo +/− radiotherapy, showing regression in lesion sizes with the corresponding increase of their ADCmean values [Table 3].
Table 3.
Mean ADC values in follow up MR examinations for patients with soft tissue sarcoma who received chemo+/-radiotherapy
| STS | Average ADCmean | SD |
|---|---|---|
| Pretherapy | 1.8222 | 0.8758 |
| Posttherapy | 2.1 | 0.8689 |
The difference in average ADCmean values using a paired sample t-test is 0.2778 with a standard deviation of 0.097 (P<0.0001). STS=Soft tissue sarcoma, ADC=Apparent diffusion coefficient, SD=Standard deviation
Regarding post-chemo/radiotherapy evaluation of fibromatosis patients
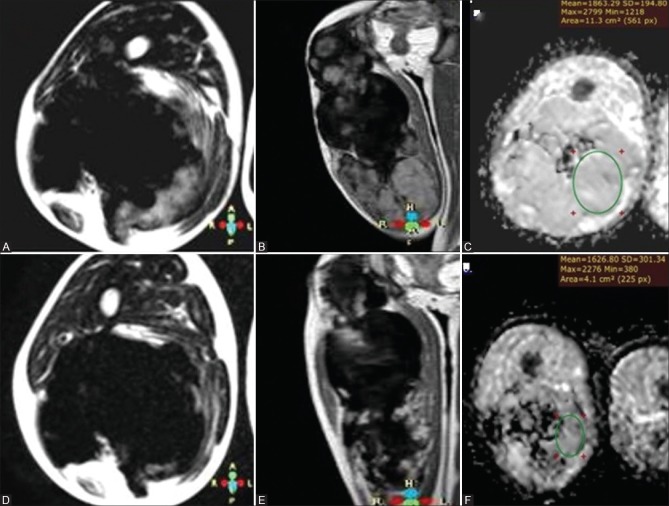
Follow-up MR examinations were available for nine patients with fibromatosis (12 lesions) who received chemo +/− radiotherapy. Eight lesions showed a favorable response with an overall reduction or stabilization of the tumor size accompanied by a notable decrease in their T2 signal intensity and an increase in the proportion of the low signal bands/areas within the tumor. Lesions that showed a favorable response to chemo or radiotherapy exhibited lower ADC values than those showing a progressive disease course. The differences in the ADC values of these two group of lesions were found to be larger comparing their recorded minimum ADC values than comparing their recorded mean ADC values [Table 4 and Figure 5].
Table 4.
Post-therapy ADC values (×10-3 mm2/s) of fibromatosis lesions with a favorable and poor treatment response
| Fibromatosis | Average ADCmean | SD | Average ADCmin | SD |
|---|---|---|---|---|
| Favorable response to treatment | 1.4 | 0.19 | 0.79 | 0.43 |
| Poor response to treatment | 1.5 | 0.3 | 0.8 | 0.25 |
ADC=Apparent diffusion coefficient, SD=Standard deviation
Figure 5 (A-F).
A 8-year-old patient with fibromatosis on chemotherapy with prechemotherapy series (A) axial T2WI (B) postcontrast coronal T1 WI and (C) ADC map and postchemotherapy series (D) axial T2WI (E) postcontrast coronal T1 WI and (F) ADC map showing overall decrease of the high T2 WI signal with predominance of the low T2 signal, marked decrease in the degree of postcontrast enhancement in the posttherapeutic images, as well as decrease of mean and minimum ADC values, previously reading 1.86 × 10⁻³ mm2/s and 1.21 × 10⁻³ mm2/s being 1.63 × 10⁻³ mm2/s and 0.38 × 10⁻³ mm2/s in posttherapeutic series
Discussion
In the management algorithm of soft tissue masses, exclusion of malignancy is the initial and most important step. A routine biopsy of all soft tissue lesions is neither practical nor cost-effective.[5] Using conventional MRI signal characteristics alone results in considerable overlap between neoplastic and non-neoplastic (e.g., reactive or inflammatory) lesions, and cannot reliably differentiate benign from malignant musculoskeletal soft tissue neoplasms.[6,7]
DWI-MRI, a more recent addition to the conventional MR sequences, provides qualitative and quantitative functional information concerning the microscopic movements of water at the cellular level.[8] DWI with ADC mapping provides a non-contrast MRI alternative for the characterization of soft tissue masses as cystic or solid lesions.[9,10]
In our study, we found a significant overlap between the diffusion characteristics of benign and malignant masses. The average ADC mean values for the benign lesions were 1.2 × 10⁻³ mm2/s as compared to 1.31 × 10⁻³ mm2/s for the malignant and locally aggressive ones. This compares well to the Einarsdottir et al. 2004 study, in which the average ADCmean values for the benign and malignant lesions were 1.8 × 10⁻³ mm2/s and 1.7 × 10⁻³ mm2/s, respectively. Similarly, Maeda et al. found no significant difference between the ADC values of benign.[11]
Nagata et al. 2008 stated in their study that the mean ADC value of myxoid tumors was significantly higher than that of non-myxoid tumors. The reason for this is that these high values directly reflect the high mucin and low collagen content in the lesion, representing a lesion composed of a large amount of water. In their study, there was no significant difference in the ADC values between benign and malignant myxoid tumors while among non-myxoid tumors the average ADC value for malignant tumors was significantly lower than that for benign tumors.[12]
In our study, the mean ADC values for benign non-myxoid tumors, myxoid malignant tumors, and non-myxoid malignant tumors were 1.2 × 10⁻³ mm2/sec, 2.6 × 10⁻³ mm2/sec and 1.1 × 10⁻³ mm2/sec, respectively, compared to 1.31 × 10⁻³ mm2/sec, 2.05 × 10⁻³ mm2/sec, and 0.94 × 10⁻³ mm2/sec, respectively, in Nagata et al. 2008 study.
The average ADCmean values for the newly diagnosed fibromatosis lesions in our study were 1.31 ± 0.25 × 10⁻³ mm2/s, these values were comparable to those mentioned by Oka et al. 2011, who reported an average ADCmean value for aggressive fibromatosis and desmoid tumors of 1.36 ± 0.48 × 10⁻³ mm2/s.[13]
Another study done by Einarsdóttir et al. in 2004 to assess the role of DWI in soft tissue tumors included five desmoid tumors with their ADCmean values ranging between 1.2 and 1.9 × 10⁻³ mm2/s.[11]
Razek et al. 2012 reported that malignant tumors tend to exhibit a lower mean ADC value than benign soft tissue tumors and proposed using threshold mean ADC value of 1.34 × 10⁻³ mm2/sec to help distinguish benignity from malignancy. Also Nagata et al. 2008[14] suggested an ADC value threshold greater than 1.35 × 10⁻³ mm2/s found between malignant (1.08 ± 0.30 × 10⁻³ mm2/s) and benign (1.76 ± 0.53 × 10⁻³ mm2/s) tumors with sensitivity and specificity of 76.3% and 76.7%, respectively.
The discrepancies in the literature likely stem from the fact that many factors besides lesion cellularity influence ADC values, such as the composition of the tumor matrix, the presence of spontaneous necrosis, and differing imaging protocols for DW imaging–ADC mapping.
In our experience, the recorded ADC values of benign and malignant masses encountered wide differences and overlap, for example; lipomas had a very low mean ADC value 0.3 × 10⁻³ mm2/sec, which can probably be explained by the high amount of fatty tissue. On the other hand, hemangiomas, neurofibromata, and paragangliomas had high ADC values >2 × 10⁻³ mm2/sec. Meanwhile, non-benign masses as fibromatosis showed no significant difference in their ADC values compared to the malignant lesions (1.3 ± 0.7 × 10⁻³ mm2/sec versus 1.31 ± 0.7 × 10⁻³ mm2/sec respectively).
Thus, we found that the ADC values of soft tissue tumors are so tangled that they alone may not be useful in differentiating between benign and malignant tumors.
Regarding post-therapeutic follow up
DWI has proven useful for the assessment of tumor cellularity in soft-tissue sarcomas and may be used as a strong tool to monitor responses of cytotoxic treatment as reflected by changes in tumor cellularity.[13,15,16]
Early knowledge of response to therapy can provide important prognostic information and potentially shorten the duration of undesired side effects from the prolonged administration of ineffectual agents. ADC maps can provide quantitative information regarding therapy response by delineating regions of increased diffusivity reflecting successful cytotoxic treatment because cellular changes are expected to precede morphologic changes in tumor volume.[9,17]
In our study, nine patients with STSs had pre and post-therapeutic MRI examinations. Seven of these cases showed an increase of the recorded ADC mean values by about 0.28 × 10⁻³ mm2/s between pre and post-therapy images, along with the corresponding decrease of the overall tumor volume and enhancement pattern, matching the findings suggested by Einarsdottir et al., 2004.[11] In the other two patients with STSs, the post-therapy ADC values were also found to be higher than the pretherapy values, in spite of the observed increase of the overall tumor size; however, they displayed more heterogeneous enhancement and areas of breaking down.
Follow-up studies of fibromatosis patients in our study showed that lesions of a favorable response to chemo- or radiotherapy exhibited lower ADC values than those showing a progressive disease course. This difference was even more evident in the minimum than the mean ADC values. This contradicts with what has been widely described in the literature that a good response of tumors to therapy manifests as an increase in their ADC values owing to the decreased tumoral cellularity and activity.[16]
We suggest these findings can be attributed to the distinctive nature of soft tissue fibromatosis. In these lesions, a good response to therapy entails their progressive collagenization. This fibro-collagenous tissue typically has low ADC values (as collagen fibers act as obstacles to the diffusibility of water molecules) and consequently, this is reflected upon the ADC values of the lesion as a whole, resulting in their reduction.
Limitations in our study were that our study did not include all types of STSs and the difficulty in comparing our results to those of others because of differences in the used imaging protocols and b-values.
In conclusion, diffusion-weighted imaging with ADC mapping of extremity soft tissue tumors is so complicated that they alone may not be useful in differentiating between benign and malignant tumors. DWI with ADC mapping can be used as a tool for monitoring response to treatment.
Declaration of patient consent
The authors certify that they have obtained all appropriate patient consent forms. In the form the patient(s) has/have given his/her/their consent for his/her/their images and other clinical information to be reported in the journal. The patients understand that their names and initials will not be published and due efforts will be made to conceal their identity, but anonymity cannot be guaranteed.
Financial support and sponsorship
Nil.
Conflicts of interest
There are no conflicts of interest.
References
- 1.Afonso PD, Kosinski AS, Spritzer CE. Following unenhanced MRI assessment for local recurrence after surgical resection of mesenchymal soft tissue tumors, do additional gadolinium-enhanced images change reader confidence or diagnosis? Eur J Radiol. 2013;82:806–13. doi: 10.1016/j.ejrad.2012.11.025. [DOI] [PubMed] [Google Scholar]
- 2.Maeda M, Matsumine A, Kato H, Kusuzaki K, Maier SE, Uchida A, et al. Soft-tissue tumors evaluated by line-scan diffusion-weighted imaging: Influence of myxoid matrix on the apparent diffusion coefficient. J Magn Reson Imaging. 2007;25:1199–204. doi: 10.1002/jmri.20931. [DOI] [PubMed] [Google Scholar]
- 3.Seierstad T, Røe K, Olsen DR. Noninvasive monitoring of radiation-induced treatment response using proton magnetic resonance spectroscopy and diffusion-weighted magnetic resonance imaging in a colorectal tumor model. Radiotherapy and Oncology. 2007;85:187–94. doi: 10.1016/j.radonc.2007.09.009. [DOI] [PubMed] [Google Scholar]
- 4.Koh DM, Collins DJ. Diffusion-weighted MRI in the body: Applications and challenges in oncology. AJR Am J Roentgenol. 2007;188:1622–35. doi: 10.2214/AJR.06.1403. [DOI] [PubMed] [Google Scholar]
- 5.Chhabra A, Soldatos T. Soft-tissue lesions: When can we exclude sarcoma? AJR Am J Roentgenol. 2012;199:1345–57. doi: 10.2214/AJR.12.8719. [DOI] [PubMed] [Google Scholar]
- 6.White LM, Wunder JS, Bell RS, O'Sullivan B, Catton C, Ferguson P, et al. Histologic assessment of peritumoral edema in soft tissue sarcoma. Int J Radiat Oncol Biol Phys. 2005;61:1439–45. doi: 10.1016/j.ijrobp.2004.08.036. [DOI] [PubMed] [Google Scholar]
- 7.Subhawong TK, Jacobs MA, Fayad LM. Diffusion weighted MR imaging for characterizing musculoskeletal lesions. Radio Graphics. 2014;345:1163–77. doi: 10.1148/rg.345140190. [DOI] [PMC free article] [PubMed] [Google Scholar]
- 8.Khoo MM, Tyler PA, Saifuddin A, Padhani AR. Diffusion-weighted imaging (DWI) in musculoskeletal MRI: A critical review. Skeletal Radiol. 2011;40:665–81. doi: 10.1007/s00256-011-1106-6. [DOI] [PubMed] [Google Scholar]
- 9.Subhawong TK, Durand DJ, Thawait GK, Jacobs MA, Fayad LM. Characterization of soft tissue masses: Can quantitative diffusion weighted imaging reliably distinguish cysts from solid masses? Skeletal Radiol. 2013;42:1583–92. doi: 10.1007/s00256-013-1703-7. [DOI] [PMC free article] [PubMed] [Google Scholar]
- 10.Unal O, Koparan HI, Avcu S, Kalender AM, Kisli E. The diagnostic value of diffusion-weighted magnetic resonance imaging in soft tissue abscesses. Eur J Radiol. 2011;77:490–4. doi: 10.1016/j.ejrad.2009.08.025. [DOI] [PubMed] [Google Scholar]
- 11.Einarsdóttir H, Karlsson M, Wejde J, Bauer HC. Diffusion-weighted MRI of soft tissue tumors. Eur Radiol. 2004;14:959–63. doi: 10.1007/s00330-004-2237-0. [DOI] [PubMed] [Google Scholar]
- 12.Nagata S, Nishimura H, Uchida M, Sakoda J, Tonan T, Hiraoka K, et al. Diffusion-weighted imaging of soft tissue tumors: Usefulness of the apparent diffusion coefficient for differential diagnosis. Radiat Med. 2008;26:287–95. doi: 10.1007/s11604-008-0229-8. [DOI] [PubMed] [Google Scholar]
- 13.Oka K, Yakushiji T, Sato H, Fujimoto T, Hirai T, Yamashita Y, et al. Usefulness of diffusion-weighted imaging for differentiating between desmoid tumors and malignant soft tissue tumors. J Magn Reson Imaging. 2011;28:1195–200. doi: 10.1002/jmri.22406. [DOI] [PubMed] [Google Scholar]
- 14.Razek A, Nada N, Ghaniem M, Elkhamary S. Assessment of soft tissue tumours of the extremities with diffusion echoplanar MR imaging. Radiol Med. 2012;117:96–101. doi: 10.1007/s11547-011-0709-2. [DOI] [PubMed] [Google Scholar]
- 15.Schnapauff D, Zeile M, Niederhagen MB, Fleige B, Tunn PU, Hamm B, et al. Diffusion-weighted echo-planar magnetic resonance imaging for the assessment of tumor cellularity in patients with soft-tissue sarcomas. J Magn Reson Imaging. 2009;29:1355–9. doi: 10.1002/jmri.21755. [DOI] [PubMed] [Google Scholar]
- 16.Dallaudière B, Lecouvet F, Vande Berg B, Omoumi P, Perlepe V, Cerny M, et al. Diffusion-weighted MR imaging in musculoskeletal diseases: Current concepts. Diagn Interv Imaging. 2015;96:327–40. doi: 10.1016/j.diii.2014.10.008. [DOI] [PubMed] [Google Scholar]
- 17.ElDaly MM, Moustafa AF, Abdel-Meguid SM, Shokry AM, El Wahab NA. Can MRI diffusion-weighted imaging identify postoperative residual/recurrent soft-tissue sarcomas? Indian J Radiol Imaging. 2018;28:70. doi: 10.4103/ijri.IJRI_251_17. [DOI] [PMC free article] [PubMed] [Google Scholar]


