

Abstract
Gesture is an integral part of children’s communicative repertoire. However, little is known about the neurobiology of speech and gesture integration in the developing brain. We investigated how 8- to 10-year-old children processed gesture that was essential to understanding a set of narratives. We asked whether the functional neuroanatomy of gesture-speech integration varies as a function of (1) the content of speech, and/or (2) individual differences in how gesture is processed. When gestures provided missing information not present in the speech (i.e., disambiguating gesture, e.g. “pet” + flapping palms=bird), the presence of gesture led to increased activity in inferior frontal gyri, the right middle temporal gyrus, and the left superior temporal gyrus, compared to when gesture provided redundant information (i.e., reinforcing gesture, e.g. “bird” + flapping palms=bird). This pattern of activation was found only in children who were able to successfully integrate gesture and speech behaviorally, as indicated by their performance on post-test story comprehension questions. Children who did not glean meaning from gesture did not show differential activation across the two conditions. Our results suggest that the brain activation pattern for gesture-speech integration in children overlaps with––but is broader than––the pattern in adults performing the same task. Overall, our results provide a possible neurobiological mechanism that could underlie children’s increasing ability to integrate gesture and speech over childhood, and account for individual differences in that integration.
Keywords: iconic gesture, development, multimodal semantic integration, inferior frontal gyrus, middle temporal gyrus, superior temporal gyrus
People of all ages gesture as they talk. Gesture and speech form an integrated system of communication at every level of analysis, ranging from phonology to discourse, and in both production and comprehension. Although there is increasing understanding of the neuroanatomical structures that mediate how gesture is integrated with speech in adults, little is known about the neurobiological basis of gesture-speech integration in childhood. The present study investigates the functional neuroanatomy of gesture-speech integration in children and asks whether the neural bases for gesture-speech integration vary as a function of a child’s ability to glean information from gesture and integrate it with speech.
The manual gestures that accompany spoken language play an important role in communication. Gesture adds semantic content that either complements or supplements the information conveyed in speech (Goldin-Meadow, 2005; McNeill, 1992). Co-speech gestures take on meaning through their co-occurrence with spoken language; for example, a gesture in which the hands make a rolling motion takes on a different meaning when accompanied by the words “snowballing” vs. “running away from someone”. Gesture can complement the information conveyed in speech; e.g., flapping the palms at the side of the body while saying the word “bird”. But gesture can also provide a more specific semantic representation than the one presented in speech; in other words, it can disambiguate speech, e.g., the flapping palms gesture produced while saying the word “pet.” Here gesture provides information about the particular type of pet that is not found in speech. Understanding audiovisual speech thus requires combining information from spoken and visual modalities to arrive at a meaning, that is, a process of gesture-speech integration. In the current study, we ask how children integrate speech and gesture when gesture provides unique, disambiguating information versus when gesture provides overlapping, reinforcing information.
Gesture plays an important role in language development. Children use gestures to communicate before they produce their first words (Bates, 1976). The development of gesture is a critical predictor of children’s language skills (Rowe & Goldin-Meadow, 2009). Gestures that children see play an equally important role in their communicative and cognitive processing. Children rely on gesture to comprehend words and sentences starting from the first year of life (Bates, 1976; Morford & Goldin-Meadow, 1992). Learners are more likely to profit from instruction when it is accompanied by gesture than when that same instruction is not accompanied by gesture (Perry, Berch & Singleton, 1995; Valenzeno, Alibali & Klatzky, 2003). Being able to profit from gesture requires the ability to integrate information across gesture and speech. The ability to integrate information across the two modalities begins early in development (Morford & Goldin-Meadow, 1992), but continues to develop with age (Thompson & Massaro, 1986). For example, gesture plays a greater role in word comprehension in 10-year-old children than in preschool children (Thompson & Massaro, 1994). In turn, adult comprehension of a spoken message is negatively influenced by conflicting gestures to a greater degree than comprehension in 10-year-olds (Kelly & Church, 1998). These findings highlight the late elementary school years as an important transitional period in children’s gesture-speech integration.
Brain imaging studies in adults suggest that integrating meaning from gesture with co-occurring speech involves classic language areas of the left frontal and temporal lobes and their right hemisphere homologues (Andric & Small, 2012; Straube, Green, Bromberger, & Kircher, 2011). Chief among these areas are the pars opercularis and pars triangularis of the inferior frontal gyrus (IFGOp and IFGTr, respectively), the middle temporal gyrus (MTGp), and the superior temporal gyrus (STGp) and sulcus (STSp).
Two primary regions involved in gesture-speech integration, the IFG and the MTG, primarily on the left, constitute critical parts of a distributed network for processing semantic information during speech on its own (see Binder, Desai, Graves, & Conant, 2009; Lau, Phillips, & Poeppel, 2008; Price, 2010; Van Petten and Luka, 2006, for reviews). Multiple studies report posterior MTG (MTGp) activation when information must be integrated across multiple modalities, such as action and speech (Willems, Özyürek, & Hagoort, 2009). Furthermore, greater activation is found when the information coming from different modalities is inconsistent (Green et al., 2009). Like the MTGp, the IFG also responds more strongly to iconic gestures that are unrelated or contradictory to the accompanying speech than to iconic gestures that are related to speech (Green et al., 2009; Willems, Özyürek, & Hagoort, 2007). Overall, MTG appears to play a role in conceptual integration regardless of modality, whereas IFG is responsive to conceptual integration across different modalities. Superior temporal cortex responds more to speech that is accompanied by gesture than to either speech or gesture alone (Dick, Goldin-Meadow, Hasson, Skipper, & Small, 2009; Kircher et. al, 2009); and more to speech that is accompanied by meaningful gestures than to speech that is accompanied by non-meaningful self-grooming movements (Dick, Goldin-Meadow, Solodkin & Small, 2012; Holle, Gunter, Rüschemeyer, Hennenlotter, & Iacoboni, 2008). This region is particularly active when gesture is processed under adverse listening situations (Holle, Obleser, Rueschemeyer, & Gunter, 2010). However, it is not clear that superior temporal cortex is specifically involved in gesture-speech integration processing––the area might be involved in integrating visual and auditory modalities more broadly (Dick, Mok, Raja Beharelle, Goldin-Meadow, & Small, 2012).
The sole developmental study on the biology of gesture processing compared how 8- to 11-year-old children processed meaningful co-speech gestures, compared to meaningless grooming gestures produced along with speech (Dick et. al, 2012). The results revealed activation differences in the right IFG between meaningful and non-meaningful hand movements that were moderated by age. The study also showed that children, but not adults, had higher activation in the left MTGp when hand movements were meaningful than when they were not meaningful (Dick et. al, 2012). Note that the meaningful gestures in this study did not add meaning to the message conveyed in speech––instead, they presented the same information in a complementary modality.
In the current study, we ask whether the functional neuroanatomy of gesture-speech integration in 8- to 10-year-old children varies as a function of the informativeness of the gesture. Many neuroimaging studies have examined the effects of gestures conveying information that contradicts information conveyed in speech (e.g., Willems et al., 2007). Although these studies offer important insights into the relation between speech and gesture, such contradictory gestures are not commonly observed in naturalistic conversations. Here, we use gestures conveying information that is different from, but has the potential to be integrated with, the information conveyed in speech (as in Dick et al., 2014, who studied adults).
To this end, we capitalized on the ability of gesture to add semantically meaningful information that can either go beyond the information conveyed in speech or reinforce that information. We presented children with stories that were shown either with or without iconic gestures (e.g., flapping palms at sides). Some stories contained ambiguous words that indicated a general semantic category (e.g., pet), whereas other stories contained unambiguous words that denoted a particular exemplar of the category (e.g., bird). Crucially, when an iconic gesture (e.g., flapping palms) was presented along with the ambiguous speech (e.g., when it co-occurred with “pet”), it provided missing information that was not conveyed anywhere in speech. When the same iconic gesture was presented along with the unambiguous speech (e.g., when it co-occurred with “bird”), it provided information that was redundant with the information conveyed in speech. A previous study using the same design and materials with adults (Dick et. al, 2014) found that a set of brain regions including left MTGp, left IFGTr and left IFGOp are active when gesture provides information not found in speech, compared to when it provides information redundant with speech. Based on the literature, we hypothesize that children will show greater activation in brain regions involved in gesture-speech integration (e.g., MTGp, IFG) when they must integrate two sources of unique information (information from gesture and from speech) to grasp the overall gist of the story (e.g., flapping palms + “pet”) than when no integration across modalities is required (e.g., flapping palms + “bird,” where gesture provides information that is redundant with speech).
We also asked to what extent does the functional neuroanatomy of school-aged children vary with their ability to integrate the gestural and spoken information? Given that the late elementary school years are an important transitional period in children’s gesture-speech integration (Morford & Goldin-Meadow, 1992; Thompson & Massaro, 1986), we hypothesize that activation in regions that are implicated in gesture-speech integration will differ among children as a function of how well they integrate extra information presented in the gesture. This skill will be measured by children’s comprehension of stories that contain ambiguous words presented with iconic gestures that disambiguate those words (e.g., if they recognize that the pet is a bird when presented with the ambiguous speech + disambiguating gesture).
Methods
Participants
Thirty-two children (age 8–10 years, mean age ± SD: 9.14 years ± .71 years; 28 right-handed; 10 female), all native speakers of American English, participated in the study. These children were drawn from a sample of 66 children participating in a larger, longitudinal study of children’s language development in the greater Chicago area. All participants were recruited from the Chicago area via mailings to families in targeted zip codes and via an advertisement in a free parent magazine. A subset of the original sample agreed to participate in the neuroimaging component of the larger study. Each parent gave written informed consent following the guidelines of the Institutional Review Boards for the Division of Biological Sciences at The University of Chicago, and the Office of Research at the University of California, Irvine, which approved the study. Children gave verbal assent. All participants reported normal hearing and normal or corrected-to-normal vision. No parent reported any history of neurological or developmental disorders in their child. Handedness was determined according to the Edinburgh handedness inventory (Oldfield, 1971).Three participants were excluded for failure to complete the study, one was excluded due to a suspected MRI abnormality, nine were excluded due to excessive motion (more than 10% of the total number of volumes), resulting in a final study sample of 19 children (age 8–10 years, mean age ± SD: 9.3 years ± .66 years, 17 right-handed, 10 female).
Materials
We used a 2×2 factorial design. The two factors that varied in the stories were: Ambiguity (Ambiguous, Unambiguous speech) and Gesture (Gesture, No Gesture present), resulting in four experimental conditions. In the AMBIGUOUS stories, a crucial detail of the story was not specified in the spoken language. For example, a story about a misbehaving animal would refer simply to a “pet” but would not specify the type of pet. See Table 1 for an example story. In the UNAMBIGUOUS stories, the language would contain the word “bird,” thus specifying the type of pet that was misbehaving. Stories were either accompanied by meaningful iconic gestures (+GESTURE) or by no hand movements (+NO GESTURE). In the +GESTURE stories, an iconic gesture was produced along with the speech and specified the type of pet; for example, a gesture in which the speaker flapped his palms at his sides indicated that the pet was a bird. In the +NO GESTURE stories, no iconic gestures were produced along with speech. These two factors resulted in four types of stories: UNAMBIGUOUS+GESTURE, in which both the speech and the gesture contained specific (redundant) information relevant to the story (e.g., that the story was about a bird); UNAMBIGUOUS+NO GESTURE, in which the speech contained specific information about the bird but gesture did not; AMBIGUOUS+GESTURE, in which the gesture contained specific information about the bird but speech did not; AMBIGUOUS+NO GESTURE, in which neither speech nor gesture contained specific information about the bird. Note that only the AMBIGUOUS+GESTURE stories required the listener to integrate information from speech and gesture to understand that the misbehaving animal was a bird. See Figure 1 for example stories.
Table 1.
Example narrative with speech specificity varied. Half of the stories contained ambiguous words indicating a category; half contained unambiguous words indicating a particular exemplar of the category. Words manipulated across conditions are bolded.
| Stacie was excited when her parents brought home her new bird/pet. Sparky, who was cute as could be, tried to bite her when she fed him. The mess that he made all over forced Stacie to put down newspapers. When she tried to move him onto the newspapers, Sparky pecked/attacked her again! That night, as Stacie tried to put Sparky in a cage, he flapped/struggled non-stop and even scratched her with his claws. She must have left the cage open, because in the morning Sparky had escaped. |
Figure 1.

An example of the four conditions. In half of the stories iconic gestures accompanied the speech. When gestures were presented with ambiguous words, they provided missing information not present in the speech (AMBIGUOUS+GESTURE); when presented with unambiguous words, they provided redundant information (UNAMBIGUOUS+GESTURE).
A total of 16 short stories of between 6–9 sentences were generated. All children saw stories from each of the 4 conditions; no child saw any story in more than one condition. Presentation orders were determined using a Latin Squares design in which each of the 16 unique stories was presented in each of the 4 experimental conditions, controlling for presentation order. There were no significant effects of stimulus order or story type on post-test performance; we therefore collapsed over these factors. Each narrative contained an average of 88.85 words (range=74–99 words). Narratives were matched for total word length, syntactic complexity, and average printed word frequency.1
The unambiguous language (e.g., bird as a type of pet) was chosen to be non-prototypical. Prototypicality judgments were derived from a prior norming study with 16 adults and 18 children, who viewed each story in the AMBIGUOUS+NOGESTURE condition and were asked to provide the “most likely” missing referent. Participants chose the answer matching the UNAMBIGUOUS language conditions (bird in this case) less than chance and almost never generated the answer, confirming that, without gesture, the unambiguous language in our stories rarely led participants to infer the referents conveyed in the unambiguous language.
The actor recited each narrative from memory, and kept gestures, facial expression and prosody as identical as possible across conditions. For each unique story, all but three words were identical across each of the four conditions. That is, non-specific words in all AMBIGUOUS versions (e.g., pet, attacked, struggled) were replaced one-for-one with specific words in all UNAMBIGUOUS versions (e.g., bird, pecked, flapped, see Dick et al., 2014, and Figure 1). Because each participant saw only one version of a story and there were four stories for each of the four conditions, there were in total 12 critical words per condition.
In all stories without gesture (+NO GESTURE conditions), the speaker held his hands at his side. In all stories with gesture (+GESTURE conditions), he produced exactly three iconic gestures over the course of the entire story, each of which conveyed specific information important to the gist of the narrative (e.g., a flapping motion, a flying motion, and then another flapping motion, all of which indicated that a bird was the focus of the narrative). The speaker produced the iconic gestures naturally with speech (i.e., the timing of the gesture with speech was not edited in any way; cf. Holle et al., 2008). Each video was edited to 30 seconds ± 1.5 seconds in length using Final Cut Pro (Apple Inc, Cupertino, CA, USA), and the sound volume was normalized.
Image acquisition
Imaging data were acquired on a 3T Siemens Trio scanner on the medical campus of Northwestern University. A T1-weighted structural scan was acquired before the functional runs for each participant (1 mm ×1 mm × 1 mm resolution; sagittal acquisition). Gradient echo echo-planar T2* images optimized for blood oxygenation level dependent (BOLD) effects were acquired in 32 axial slices with an in-plane resolution of 1.7 mm × 1.7 mm, and a 3.4 mm slice thickness with a 30% (4.3mm) gap (TR/TE=2000/20 ms, Flip Angle=75 degrees).
fMRI analysis
Preprocessing.
Initial preprocessing steps were conducted using AFNI (http://afni.nimh.nih.gov/afni/) and included time series despiking, slice-timing correction, three-dimensional motion correction (using Fourier interpolation), spatial alignment of the structural volume to the functional volumes using affine registration (with linear interpolation for the first pass and the weighted sinc interpolation for the final output), and normalization to Tailarach space (using the AFNI TT_N27+tlrc template). Lastly, the normalized images were spatially smoothed to a Gaussian FWHM of 6mm3.
PLS analysis.
For the fMRI statistical analysis, we used Partial Least Squares (PLS) implemented in Matlab (www.mathworks.com/products/matlab/). Complex cognitive processing, such as narrative processing, emerges from large-scale neural interactions among distributed brain regions. Traditional neuroimaging analyses are univariate and treat brain regions independently without considering the covariance across neural regions. PLS is a multivariate analysis technique that can be used to identify a set of latent variables (LVs) that optimally relate spatiotemporal patterns of brain activity to a task design (Task PLS). It does so by extracting commonalities between the dependent measure of interest and the overall pattern of brain activity. PLS is similar to Principal Components Analyses but it can limit the solution to the part of the covariance structure that is attributable to experimental design, e.g. contrasts. Advantages of PLS include its specialization in handling datasets in which the dependent measures are highly correlated, a key advantage over the mass univariate testing common in the analysis of functional images, and its sensitivity to distributed activity patterns (McIntosh & Lobaugh, 2004).
Task PLS can be implemented as either Mean-Centered Task PLS or Non-Rotated Task PLS (see McIntosh & Lobaugh, 2004 and Krishnan, Williams, McIntosh, & Abdi, 2011 for review). Mean-Centered Task PLS is used to examine how brain activity overall covaries with conditions and to generate latent variables that best relate the observed spatiotemporal pattern of brain activity data to the experimental design. For both types of PLS, the data must be arranged in a matrix where the rows represent the experimental conditions for each participant and the columns contain the BOLD signal measure of each voxel within each block. In Mean-Centered Task PLS, this matrix is then centered by subtracting the grand mean across the entire experiment from each value. Singular value decomposition (SVD) is used to rotate this centered data matrix to identify the most robust effects that differentiate experimental conditions. Non-Rotated Task PLS uses instead a priori contrasts, enabling researchers to test specific hypotheses. In Non-Rotated Task PLS, the product of the mean-centered matrix and the contrast matrix is taken. This new data matrix is used directly for inferential analyses, as well as to generate the ‘singular image’, which is the distributed voxel activity pattern that best characterizes the effects of interest.
The statistical significance of each latent variable is assessed using permutation testing (n=500) with a significant permuted p<.05. This technique determines whether effects represented by the LV are significantly different from noise. The numerical weights of the voxels comprising the singular image are referred to as saliences. Saliences can be either positive or negative. Saliences indicate the magnitude and the direction by which each voxel covaries with the contrast at hand.
Reliability of a brain region for a given LV (the relationship of each voxel to the overall task contrast vector) is determined using bootstrap resampling. In this technique, standard error of the salience of a voxel is calculated from a distribution of saliences derived from resampling the subjects 200 times (with replacement) and calculating a Non-Rotated Task PLS in each sample. The ratio of observed salience to bootstrap standard error determines reliability. This ratio is equivalent to a z-score if the bootstrap distribution is normal (Efron and Tibshirani, 1986). For our block design, we used a conservative bootstrap ratio (BSR) threshold of greater than |±3.0| and considered voxels above this threshold as reliable. Brain scores are similar to factor scores in a principal components analysis and indicate how strongly each subject expresses the patterns on the latent variable. Thus, brain scores can also be defined as the latent variable for the brain activity. The scores are the dot product of subject’s individual fMRI image volume and the bootstrap-estimated saliences on a particular latent variable (McIntosh et al., Neuroimage, 2004). The mean ‘brain scores’ for each experimental condition were significant (p <.05) and reliable (i.e., their confidence intervals did not cross zero). Clusters of 50 or more voxels, in which the salience to standard error ratio was greater than 3.0, were a priori considered to represent reliable clusters. 50 voxels were chosen because we were a priori only interested in larger regions and also because this threshold has been used as a criterion in the earlier PLS literature (Iidaka et al., 2000; Raja, 2013; Smith et al., 2012). Bootstrapping, unlike traditional threshold setting, minimizes false negatives and protects against influences from outliers. Further, because voxel saliences are calculated in a single mathematical step, there is no need to correct for multiple comparisons, which further minimizes false negative rate, making PLS superior to traditional Bonferroni correction (Nichols & Hayasaka, 2003).
We used Non-Rotated Task PLS with three a priori contrasts. The first contrast was an interaction between Ambiguity × Gesture to examine which brain activation patterns differentiated AMBIGUOUS and UNAMBIGUOUS conditions when GESTURE was present compared to when there was NO GESTURE. The second contrast directly compared the AMBIGUOUS+GESTURE condition to the UNAMBIGUOUS+GESTURE condition to identify areas that were globally responsive to stories that required the integration of gesture and speech. Finally, the third contrast compared the AMBIGUOUS+NO GESTURE condition to the UNAMBIGUOUS+NO GESTURE condition to test whether activation in the ROIs was sensitive to speech ambiguity irrespective of the gesture.
ROI analysis.
For the anatomical regions of interest (ROI) analysis, we focused on a limited set of a priori regions that have been previously shown to be preferentially active for gesture-speech integration. These areas included the left IFGTr, left IFGOp and the left MTG (Dick et. al, 2014). Because our data are developmental, and because previous imaging research (Dick et. al, 2012) has found both relatively increased bilateral temporal activation and bilateral frontal and temporal activation in children, we also included the same areas in the right hemisphere, as well as the entire STG in both hemispheres. We defined the ROIs anatomically using Eickhoff-Zilles macro labels from N27 in Talairach TT_N27 space (Eickhoff, 2005).
Experimental procedure
The functional MRI paradigm was presented in a block design, with each narrative comprising one “block” of thirty seconds, separated by a rest interval of 18 seconds. Four stories per condition were presented to each participant, split across two runs (16 total stories, or blocks, per participant). All stories were presented using Presentation software (Neurobehavioral Systems Inc., Berkeley, CA, USA) and projected onto a back-projection screen in the scanner. Sound was conveyed through MRI-compatible headphones, and was set at a level that was comfortable for each child. Children were instructed to pay careful attention, and they were told that they would be asked questions about the stories at the end of the session2.
After the scanning session, participants were given a post-scan recognition test to assess gesture comprehension. The post-scan recognition test consisted of a 4-alternative forced choice question about the critical piece of information specified in the unambiguous language and/or gesture in each story. The four questions about the stories in the AMBIGUOUS+GESTURE condition were used to determine whether children had successfully integrated the information conveyed in gesture with the information conveyed in speech.
Because the age period we focus on is an important transitional period in children’s gesture-speech integration (Morford & Goldin-Meadow, 1992; Thompson & Massaro, 1986), we expected activation in regions that are implicated in gesture-speech integration to differ among children as a function of how well they integrate extra information presented in the gesture. Thus, we first conducted our analyses with the whole sample. We followed up on these analyses by creating two groups based on children’s ability to integrate the information across the two modalities, as indicated by their comprehension of the gist of the story in the AMBIGUOUS+GESTURE condition.
Results
Behavioral Analysis: Post-scan Recognition Test
To assess whether participants successfully comprehended the stories, we calculated the proportion of correct responses participants produced in each condition in the post-test questionnaire. We counted an answer as correct if it matched the unambiguous language answer (e.g., “bird” in the example described earlier for the stimuli in Figure 1). Note that there was technically no one correct answer in the AMBIGUOUS+NO GESTURE condition––the language was ambiguous (“pet”) and there was no gesture to specify a particular referent. The mean proportion of correct responses was M=.78 in the UNAMBIGUOUS+GESTURE condition; M=.74 in the UNAMBIGUOUS+NO GESTURE condition; M=.55 in the AMBIGUOUS+GESTURE condition; and M=.09 in the AMBIGUOUS+NO GESTURE condition. Accuracy did not significantly vary as a function of age in any of the conditions (AMBIGUOUS+GESTURE: r=−.26, UNAMBIGUOUS+GESTURE: r=−.01, UNAMBIGUOUS+NO GESTURE: r=.04, all p’s>.10).
A repeated measures ANOVA with Ambiguity (Ambiguous, Unambiguous speech) and Gesture (Gesture, No Gesture present) as independent variables revealed a main effect of Ambiguity F(1,18)=37.27, p<.001, ηp2=.67, where proportion of correct responses was higher when speech was not ambiguous than when it was ambiguous. Similarly, there was a main effect of Gesture, F(1,18)=20.11, p<.001, ηp2=.53, where proportion of correct responses was higher when speech was accompanied by gesture than when it was not accompanied by gesture. Importantly, the interaction term was significant as well, F(1, 18)=12.42, p=.001, ηp2=.41. Pairwise comparisons showed that, when speech was ambiguous, accuracy was higher when speech was accompanied by Gesture (AMBIGUOUS+GESTURE) than when it was not accompanied by gesture (AMBIGUOUS+NO GESTURE), t(19)=5.35, p<.001. Accuracy did not vary as a function of Gesture in the Unambiguous conditions where all of the information needed to answer the posttest question was conveyed in speech, t(19)=.52, p>.10.
At the individual level, 74% (15 of 19) of the children correctly answered 3 or more of questions about stories in the UNAMBIGUOUS+NO GESTURE condition, as did 79% (14 of 19) of the children responding to questions about stories in the UNAMBIGUOUS+GESTURE condition. In contrast, only 53% (10 of 19) of children correctly answered 3 or more of questions about stories in the AMBIGUOUS+GESTURE. In other words, only half of the children were able to successfully integrate information presented in gesture with information presented in speech. Below we first present results for all of the children in our sample. We then divide children into two groups based on whether they were able to successfully integrate information across the two modalities: 10 children who correctly answered 3 or more of questions about stories in the AMBIGUOUS+GESTURE condition (mean number correct=81%) vs. 9 children who did not (mean number correct=34%), t(17)=8.36, p<.001. Importantly, children in these two groups did not differ significantly in the number of questions they answered correctly about stories in the UNAMBIGUOUS+NO GESTURE condition (t(17)=.78, p=.447), nor about stories in the UNAMBIGUOUS+GESTURE condition (t(17)=.62, p=.546). Thus, the two groups of children who differed in their ability to integrate information across gesture and speech did not differ in the overall attention they paid to the task.
Non-rotated Task PLS Analyses in ROIs: Whole Sample
Next, we used Non-Rotated Task PLS with three a priori contrasts using the whole sample: (1) interaction between Ambiguity × Gesture, (2) Ambiguous vs. Unambiguous Speech with Gesture, (3) Ambiguous vs. Unambiguous Speech with no Gesture. For the whole group, non-rotated task PLS analysis did not reveal any significant latent variables identifying the brain activation pattern, which was related to the interaction between Ambiguity and Gesture conditions (permuted p=.18), which differentiated AMBIGUOUS+GESTURE condition from the UNAMBIGUOUS+GESTURE condition (permuted p=.27), or which differentiated AMBIGUOUS+NO GESTURE condition from UNAMBIGUOUS+NO GESTURE condition (permuted p=.27).
Overall, non-rotated task PLS analyses with the three a priori contrasts did not reveal significant activation differences across the different experimental conditions in our ROIs. However, recall that, on average, children were correct on .55 of the stories in the AMBIGUOUS+GESTURE condition. Moreover, the distribution appeared to be bimodal. Half of the children (n=10) answered 3 or 4 questions about stories in the AMBIGUOUS+GESTURE condition correctly (the high gesture-speech integrators), and half (n=9) answered 2 or fewer questions correctly (the low gesture-speech integrators). It is likely that the low integrators did not glean information from gesture when listening to the ambiguous story, whereas the high integrators did.
Non-rotated Task PLS Analyses in ROIs: High versus Low Integrators
Next, we examined brain activation separately in the high integrators, who successfully gleaned information from gesture and integrated it with the information in speech, and low integrators, who did not.
Low integrators
For low integrators, non-rotated task PLS analysis did not reveal any significant latent variables that was related to the interaction between Ambiguity and Gesture conditions (permuted p=.86), that differentiated the AMBIGUOUS+GESTURE condition from UNAMBIGUOUS+GESTURE condition (permuted p=.18), or that differentiated the AMBIGUOUS+NO GESTURE condition from UNAMBIGUOUS+NO GESTURE condition (permuted p=.27).
High integrators
Interaction.
For high integrators, non-rotated task PLS analysis did reveal a latent variable, i.e., brain activation pattern, relating to the interaction between Ambiguity and Gesture (permuted p=.04). Table 2 characterizes the brain regions where activity was associated with the significant latent variable (LV) for high integrators. The table also displays positive and negative saliences, as well as Talairach coordinates. The positive saliences correspond to regions where the activation difference between AMBIGUOUS and UNAMBIGUOUS speech is greater when the speech is accompanied by gesture than when it is not accompanied by gesture, i.e., [AMBIGUOUS+GESTURE] – [UNAMBIGUOUS+GESTURE] > [AMBIGUOUS+NO GESTURE] – [UMABIGOUS+NO GESTURE]). Positive saliences indicated activation in the bilateral STG and left IFG––brain regions where we observed a bigger difference between ambiguous and unambiguous speech when it was accompanied by gesture than when it was not accompanied by gesture. Negative saliences correspond to regions where the activation difference between AMBIGUOUS and UNAMBIGUOUS speech is greater when the speech is not accompanied by gesture than when it is, i.e., [AMBIGUOUS+NO GESTURE] – [UNAMBIGUOUS+NO GESTURE] > [AMBIGUOUS+GESTURE] – [UNAMBIGUOUS+GESTURE]. Reliable clusters include those with bootstrap ratios ≥ |± 3|. For brevity, only clusters with more than 50 voxels are listed. Negative saliences indicated activation in the left STG and MTG––brain regions where we observed a smaller difference between ambiguous and unambiguous speech when it was accompanied by gesture than when it was not accompanied by gesture.
Table 2.
Reliable clusters identified for the significant non-centered task PLS analysis for the Ambiguity and Gesture interaction contrast (bootstrap ratios ≥ |± 3|) in high integrators. For brevity, only clusters with > 50 voxels are listed. Cluster region indicates the locations determined using the Talairach atlas (Talairach & Tournoux, 1988). Talairach coordinates x, y, and z indicate voxel coordinates in the left/right, posterior/anterior, and superior/inferior (LPS) system used in the Talairach atlas. Size refers to the number of contiguous voxels in the cluster. Bootstrap is an index of reliability of the activity pattern across subjects
| Talairach | |||||
|---|---|---|---|---|---|
| Cluster region | X | Y | Z | Bootstrap | Cluster size |
| Positive saliences/bootstrap ratios | |||||
| Right Inferior Frontal Gyrus Opercularis | 44 | 13 | 34 | 8.1 | 1244 |
| Right Superior Temporal Gyrus | 46 | −14 | −3 | 7.8 | 706 |
| Right Inferior Frontal Gyrus Opercularis | 30 | 21 | 19 | 7.6 | 1024 |
| Left Inferior Frontal Gyrus Opercularis | −52 | 14 | 21 | 6.8 | 467 |
| Left Inferior Frontal Gyrus Opercularis/Triangularis | −39 | 15 | 9 | 6.4 | 119 |
| Right Superior Temporal Gyrus | 54 | −9 | 12 | 6.3 | 65 |
| Right Inferior Frontal Gyrus | 48 | 32 | 14 | 5.9 | 184 |
| Left Inferior Frontal Gyrus Triangularis | −30 | 22 | 18 | 5.8 | 570 |
| Right Superior Temporal Gyrus | 47 | −24 | −4 | 5.6 | 134 |
| Right Superior Temporal Gyrus | 43 | −6 | −9 | 5.5 | 57 |
| Left Superior Temporal Gyrus | −40 | 0 | −10 | 5.4 | 60 |
| Right Superior Temporal Gyrus | 40 | −38 | 8 | 5.3 | 215 |
| Right Inferior Frontal Gyrus Opercularis/Triangularis | 50 | 19 | 11 | 5.2 | 54 |
| Right Superior Temporal Gyrus | 40 | −53 | 5 | 4.7 | 457 |
| Left Inferior Frontal Gyrus Opercularis | −42 | 8 | 36 | 4.3 | 106 |
| Left Inferior Frontal Gyrus Opercularis | −55 | 4 | 18 | 4.2 | 60 |
| Left Superior Temporal Gyrus | −50 | −26 | 1 | 4.1 | 79 |
| Right Superior Temporal Gyrus | 48 | −19 | 10 | 4.1 | 104 |
| Left Superior Temporal Gyrus | −45 | −39 | 11 | 4.1 | 78 |
| Left Superior Temporal Gyrus | −46 | −14 | 8 | 4.1 | 94 |
| Right Superior Temporal Gyrus | 44 | −44 | −1 | 3.7 | 60 |
| Negative saliences/bootstrap ratios | |||||
| Left Superior Temporal Gyrus | −57 | −31 | 17 | −7.5 | 90 |
| Left Middle Temporal Gyrus | −49 | −15 | −10 | −4.8 | 215 |
| Left Middle Temporal Gyrus | −58 | −29 | −9 | −4.0 | 56 |
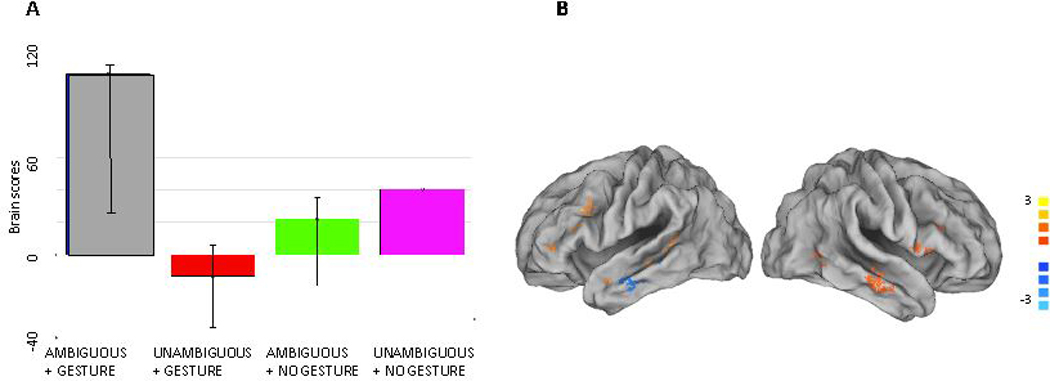
Brain scores for the significant LV with 95% confidence intervals are shown in Figure 2A for high integrators. The scores display a significant interaction between ambiguity and gesture: for this LV, the difference between the AMBIGOUS and UNAMBIGUOUS speech conditions is positive when speech is accompanied by GESTURE and negative when it is not accompanied by GESTURE. In Figure 2B, brain activity data thresholded using the bootstrap ratios are presented.
Figure 2.

(A) Brain scores for the significant latent variable (LV) from the mean-centering PLS analysis on Ambiguity x Gesture interaction in the left panel. Error bars indicate confidence intervals. The brain score for each condition is considered reliable if the confidence interval does not cross 0. (B) The singular image showing reliable clusters was mapped to the human population-average, landmark and surface-based (PALS) atlas using the average voxel algorithm via Caret (Van Essen et al., 2001;http://brainmap.wustl.edu/caret), and thresholded to show bootstrap ratios ≥ |+/−3| and number of nodes over 20. The group statistical map was mapped to the population cortical surface using multifiducial mapping. Warm colors indicate clusters with positive bootstrap ratios, which are positively associated with the interaction term ([AMBIGUOUS+GESTURE] – [UNAMBIGUOUS+GESTURE] > [AMBIGUOUS+NO GESTURE] – [UNAMBIGUOUS+NO GESTURE], i.e., a bigger difference between ambiguous and unambiguous speech when it was accompanied by gesture than when it was not accompanied by gesture). Cool colors indicate clusters with negative bootstrap ratios, which are negatively associated with the interaction term ([AMBIGUOUS+GESTURE] – [UNAMBIGUOUS+GESTURE] < [AMBIGUOUS+NO GESTURE] – [UNAMBIGUOUS+NO GESTURE], i.e., a smaller difference between ambiguous and unambiguous speech when it was accompanied by gesture than when it was not accompanied by gesture).
As a confirmatory analysis, we conducted a repeated measures 2 × 2 ANOVA on the individual brain scores of each the high integrators, with speech (AMBIGUOUS, UNAMBIGUOUS) and gesture (GESTURE, NO GESTURE) as independent variables. There was no main effect of speech on the brain scores, F(1, 9)=.973, p=.35, and a marginally significant main effect of gesture, F(1,9)=3.483, p=.095. More importantly for our purposes, the interaction between speech and gesture was significant, F(1,9)=11.085, p=.009. To better interpret this interaction term, we conducted follow-up simple effects analyses comparing AMBIGUOUS and UNAMBIGUOUS conditions with GESTURE and then with NO GESTURE. The results are reported below.
Ambiguous vs. Unambiguous Speech with Gesture.
We compared activation in the AMBIGUOUS+GESTURE condition to the UNAMBIGUOUS+GESTURE condition in high integrators using non-rotated task PLS analysis. The non-rotated task PLS revealed a significant latent variable that differentiated the two conditions in the high integrators (permuted p=.02). For high integrators, the singular value for this significant latent variable accounted for 88% of the cross-block variance.
Table 3 characterizes the brain regions where activity was associated with the significant LV for high integrators, and displays positive and negative saliences, as well as Talairach coordinates. The positive saliences correspond to regions where activation is greater for the AMBIGUOUS+GESTURE condition than for the UNAMBIGUOUS+GESTURE condition. The pattern of brain activity that characterizes positive saliences, i.e., integration of information across speech and gesture, included the right MTG, both IFGs, and left STG. The negative saliences correspond to regions where activation is greater for the UNAMBIGUOUS+GESTURE condition than for the AMBIGUOUS+GESTURE condition. The pattern of brain activity that characterized negative saliences included the left MTG.
Table 3.
Reliable clusters identified for the significant non-centered task PLS analysis for AMBIGUOUS+GESTURE versus UNAMGUOUS+GESTURE contrast (bootstrap ratios ≥ |± 3|) for high integrators. For brevity, only clusters with > 50 voxels are listed. Cluster region indicates the locations determined using the Talairach atlas (Talairach & Tournoux, 1988). Talairach coordinates x, y, and z indicate voxel coordinates in the left/right, posterior/anterior, and superior/inferior (LPS) system used in the Talairach atlas. Size refers to the number of contiguous voxels in the cluster. Bootstrap is an index of reliability across subjects.
| Talairach | |||||
|---|---|---|---|---|---|
| Cluster region | X | Y | Z | Bootstrap | Cluster size |
| Positive saliences/bootstrap ratios | |||||
| Right Middle Temporal Gyrus | 55 | −17 | −8 | 7.1 | 134 |
| Left Superior Temporal Gyrus | −42 | −38 | 4 | 6.1 | 74 |
| Right Inferior Frontal Gyrus Opercularis | 40 | 16 | 13 | 6.0 | 461 |
| Left Inferior Frontal Gyrus Opercularis | −31 | 12 | 30 | 5.1 | 56 |
| Left Superior Temporal Gyrus | −49 | −24 | −6 | 4.3 | 91 |
| Right Middle Temporal Gyrus | 45 | −54 | 4 | 3.8 | 73 |
| Left Inferior Frontal Gyrus Opercularis | −41 | 7 | 15 | 3.8 | 53 |
| Left Inferior Frontal Gyrus Triangularis | −28 | 24 | 14 | 3.5 | 71 |
| Negative saliences/bootstrap ratios | |||||
| Left Middle Temporal Gyrus | −47 | −16 | −8 | −5.1 | 125 |
Brain scores for the significant LV with 95% confidence intervals are shown in Figure 3A. The figure shows that this significant cluster differentiates the AMBIGUOUS+GESTURE condition from the UNAMBIGUOUS+GESTURE condition, which is the contrast we specified for non-rotated task PLS. Brain activity data thresholded using the bootstrap ratios are presented in Figure 3B (≥ |±3|).
Figure 3.
(A) Brain scores for the significant latent variable (LV) from the mean-centering PLS analysis on AMBIGUOUS+GESTURE – UNAMBIGUOUS+GESTURE contrast in the left panel. Error bars indicate confidence intervals. The brain score for each condition are considered reliable if the confidence interval does not cross 0. (B) The singular image showing reliable clusters was mapped to the human population-average, landmark and surface-based (PALS) atlas using the average voxel algorithm via Caret (Van Essen et al., 2001; http://brainmap.wustl.edu/caret), and thresholded to show bootstrap ratios ≥ |+\−3| and number of nodes over 20. The group statistical map was mapped to the population cortical surface using multifiducial mapping. Warm colors indicate clusters with positive bootstrap ratios, which are positively associated with the AMBIGUOUS+GESTURE – UNAMBIGUOUS+GESTURE contrast. Cool colors indicate clusters with negative bootstrap ratios, which are negatively associated with AMBIGUOUS+GESTURE – UNAMBIGUOUS+GESTURE contrast.
Ambiguous vs. Unambiguous Speech without Gesture.
Next, we confirmed that the differences observed between the AMBIGUOUS and UNAMBIGUOUS conditions were specific to the presence of GESTURE and thus reflected gesture-speech integration. To do so, we ran non-rotated PLS analyses comparing AMBIGUOUS and UNAMBIGUOUS in the NO GESTURE conditions in high integrators. Non-rotated task PLS analysis did not reveal a significant latent variable that differentiated the AMBIGUOUS+NO GESTURE condition from UNAMBIGUOUS+NO GESTURE condition for high integrators (permuted p=.91),
Interim Summary.
For low integrators, non-rotated task PLS analysis did not reveal any brain activation patterns that differentiated the conditions. However, the brain activation profile was different for high integrators. For high integrators, a network consisting of STG in both hemispheres and IFG on the left was associated with gesture-speech integration. Moreover, for high integrators, a network consisting of both IFGs, left STG, and right MTG was associated with processing stories in the AMBIGUOUS+GESTURE condition, whereas left MTG was associated with processing stories in the UNAMBIGUOUS+GESTURE condition. The relations were specific in that these ROIs did not differentiate AMBIGUOUS and UNAMBIGUOUS speech when it was presented without gesture, that is, in the NO GESTURE conditions. This finding suggests that the differences we observed in the ROI were specific to gesture-speech integration.
Whole Brain Analysis: Ambiguous vs. Unambiguous Speech with Gesture.
Given that our main comparison of interest was the AMBIGUOUS+GESTURE versus UNAMBIGUOUS+GESTURE conditions, we conducted non-rotated task PLS at the whole brain level using only this contrast for the whole sample and also for low versus high integrators separately.
Whole brain non-rotated task PLS analysis for the entire sample did not reveal any significant latent variables that differentiated the AMBIGUOUS+GESTURE from the UNAMBIGUOUS+GESTURE conditions (permuted p=.36) for the whole sample or for low integrators (permuted p=.68). For high integrators, we found that whole brain non-rotated task PLS analysis did reveal a significant latent variable that differentiated the AMBIGUOUS+GESTURE from the UNAMBIGUOUS+GESTURE condition (permuted p=.03). The positive and negative saliences, as well as their Talairach coordinates, are listed in Table 4 for high integrators. The pattern of brain activity that characterizes positive saliences (i.e., integration of information across speech and gesture) overlapped with bilateral perisylvian regions that were identified in analyses reported above, such as right middle temporal gyrus, left superior temporal gyrus, and left inferior frontal gyrus. In addition, this brain activity also included bilateral brain regions involved in primary sensory processes (lingual gyrus, cuneus, postcentral gyrus) and motor control (putamen, caudate, insula, precentral gyrus). The pattern of brain activity that characterized negative saliences included the bilateral inferior, superior parietal lobules, precuneus and middle frontal gyrus.
Table 4.
Reliable clusters identified in the whole brain for the significant non-centered task PLS analysis for AMBIGUOUS+GESTURE versus UNAMGIUOUS+GESTURE contrast (bootstrap ratios ≥ |± 3|) for high integrators. For brevity, only clusters with > 400 voxels are listed (Please see supplemental materials for all clusters with > 50 voxels). Cluster regions are determined using the Talairach atlas (Talairach & Tournoux, 1988). Talairach coordinates x, y, and z indicate voxel coordinates in the left/right, posterior/anterior, and superior/inferior (LPS) system used in the Talairach atlas. Size refers to the number of contiguous voxels in the cluster. Bootstrap is an index of reliability across subjects.
| Talairach | |||||
|---|---|---|---|---|---|
| Cluster region | X | Y | Z | Bootstrap | Cluster size |
| Positive saliences/bootstrap ratios | |||||
| Left Caudate/Cingulate | −12 | 10 | 24 | 5.8 | 9836 |
| Right Lingual/Parahippocampal | 19 | −60 | 0 | 6.6 | 6590 |
| Right Putamen | 22 | 5 | 8 | 4.5 | 2802 |
| Right Hippocampus | 36 | −20 | −11 | 7.0 | 2711 |
| Left Precentral / Postcentral gyrus | −50 | −19 | 33 | 6.6 | 2679 |
| Right Inferior Frontal Gyrus | 40 | 16 | 13 | 5.9 | 2572 |
| Left Lingual/Parahippocampal | −13 | −54 | 3 | 8.8 | 1833 |
| Right Cingulate Gyrus | 3 | 2 | 23 | 5.3 | 1799 |
| Right Insula | 38 | −13 | 16 | 5.7 | 1582 |
| Right Lingual/Culmen | 5 | −36 | −11 | 6.0 | 1284 |
| Right Precuneus | 3 | −66 | 20 | 4.4 | 895 |
| Right Middle Temporal Gyrus | 55 | −17 | −8 | 6.7 | 889 |
| Right Inferior Frontal/Middle Temporal Gyrus | 48 | −55 | 1 | 5.8 | 806 |
| Left Superior Frontal Gyrus | −16 | 43 | 31 | 5.8 | 725 |
| Right Inferior Frontal Gyrus | 42 | 12 | −10 | 3.8 | 686 |
| Right Amgydala | 24 | −8 | −8 | 4.6 | 678 |
| Left Cingulate Gyrus | −17 | −13 | 33 | 3.7 | 673 |
| Left Putamen | −22 | −14 | 11 | 4.2 | 594 |
| Right Culmen | 4 | −36 | −22 | 5.3 | 550 |
| Left Insula | −25 | −27 | 26 | 5.7 | 538 |
| Left Insula | −29 | 13 | −3 | 4.3 | 503 |
| Left Fusiform Gyrus | −34 | −75 | −9 | 3.8 | 503 |
| Left Superior Temporal Gyrus | −42 | −38 | 4 | 6.2 | 499 |
| Right Putamen | 23 | 5 | −7 | 4.1 | 487 |
| Right Postcentral Gyrus | 50 | −20 | 32 | 3.9 | 462 |
| Right Inferior Frontal/Middle Frontal Gyrus | 31 | 33 | 6 | 3.9 | 448 |
| Negative saliences/bootstrap ratios | |||||
| Right Medial Frontal Gyrus | 6 | −4 | 53 | −6.9 | 1545 |
| Left Parahippocampal Gyrus | −31 | −32 | −23 | −7.7 | 1371 |
| Left Inferior Parietal/Superior Parietal Lobule | −36 | −44 | 46 | −7.1 | 747 |
| Right Inferior Parietal Lobule/Postcentral Gyrus | 45 | −33 | 44 | −6.1 | 646 |
| Left Precuneus | −9 | −67 | 39 | −4.1 | 589 |
| Left Inferior Parietal Lobule | −41 | −55 | 36 | −6.3 | 574 |
| Left Precentral/ Middle Frontal Gyrus | −30 | −10 | 55 | −4.6 | 559 |
| Left Precentral Gyrus | −18 | −21 | 61 | −5.4 | 485 |
| Left Middle Temporal Gyrus | −54 | −14 | −12 | −8.2 | 457 |
| Right Inferior Parietal Lobule | 41 | −35 | 34 | −5.6 | 426 |
| Left Middle Frontal Gyrus | −9 | 7 | 51 | −3.6 | 421 |
| Right Postcentral Gyrus | 13 | −39 | 61 | −8.1 | 420 |
Discussion
We examined the functional neuroanatomy of children’s processing of speech-associated gestures. When gesture conveyed information that could not be found anywhere in speech (i.e., in stories presented in the AMBIGUOUS+GESTURE condition, e.g., “pet” +flapping palms), 8- to 10-year-old children showed increased activation in the right MTG, both IFGs, and left STG. This pattern of activation was, not surprisingly, found only in children who were able to successfully integrate gesture and speech behaviorally, as indicated by their performance on post-test story comprehension questions.
Neuroimaging studies, including fMRI and EEG/ERP of both adults and children, commonly explore how participants process meaningful versus meaningless gestures; gestures conveying information that contradicts the information in speech or in the preceding context; or gestures that are unrelated to the speech content (e.g. Kelly, Ward, Creigh, & Bartolotti, 2007; Willems et al., 2007). A smaller number of studies has examined neural processing during meaningful gesture-speech integration in adults, for example by comparing gesture-speech integration when gesture disambiguates meaning of an otherwise ambiguous word (Holle & Gunter, 2007; Holle et al., 2008). To our knowledge, only one fMRI study (Dick et. al, 2014) has directly addressed how the brain carries out meaningful gesture-speech integration by comparing neural processing when gestures provide information that is missing from speech (disambiguating gesture) to neural processing when gestures provide information that is redundant with speech (reinforcing gesture). It should be noted that Dick et. al. (2014) used a very different analysis approach so caution is warranted when making comparisons between that study and our study. They found that a subset of frontal and temporal regions was preferentially involved in gesture-speech integration in the adults. In the frontal lobe, these regions included the left IFGOp and left IFGTr and, in the temporal lobe, the left MTGp. The regions were more active in response to stories where gesture had to be integrated with speech to get the gist of the story (i.e., the AMBIGUOUS+GESTURE condition, as opposed to the UNAMBIGUOUS+GESTURE condition). In Dick et al.’s study, the post-scan behavioral accuracy scores in the AMBIGUOUS+GESTURE condition were higher for adults (M=.72 for adults) than they were for the children in our study as a group (M=.53). Indeed, in the Dick et al. study, adult accuracy in the AMBIGUOUS speech combined with gesture condition was just as high as it was in the UNAMBIGUOUS speech conditions (with or without gesture); in other words, adults were just as good at gleaning information about the particular exemplar that was the focus of the story (that the pet was a bird) from gesture as they were at gleaning the same information from speech. In contrast, 8- to 10-year-old children exhibited individual variability in their ability to glean information from gesture and integrate it with speech.
As a result, we focused our brain activation analyses on those children whose accuracy scores in the AMBIGUOUS+GESTURE condition were as high as the adults’ scores (i.e., we focused on the gesture-speech integrators whose accuracy scores were .75 or greater). As in Dick et al. (2014), we found differences in IFG activation between the AMBIGUOUS+GESTURE and the UNAMBIGUOUS+GESTURE conditions, specifically in the left IFGTr and bilateral IFGOp. Although both IFGOp and IFGTr are among the most commonly reported regions for complex syntactic or semantic integration in sentence-level speech processing, they are not uniformly found to be active in gesture processing. Two main views contrast the role of the inferior frontal gyrus in gesture processing. In the first, IFG is assumed to be involved in both language and motor processing and in broad integrative processing (Andric & Small, 2012). According to Holle et al. (2008; 2010), temporal regions (i.e., the STSp/MTGp) carry the entire burden of integrating speech and gesture, regardless of the gesture’s relation to speech; posterior temporal regions play the role of initial conceptual matching between the auditory and gesture input streams. The IFG only plays a role in the modulation and revision of audiovisual information. In the second view (e.g., Willems et al., 2009), the general region encompassing both STSp and MTGp is assumed to perform “low-level” direct perceptual matching between speech and gesture; integration of meaning from both streams requires involvement of the IFG. Gesture-speech integration is just like sentence integration; the posterior temporal cortical network is involved in the gross activation of a common semantic representation, whereas the left IFG is involved in constructing a novel semantic representation appropriate to the ongoing speech stream.
Our results speak to these two views. We found, in high gesture-speech integrators, a difference in IFG activation when AMBIGUOUS+GESTURE stories were processed, compared to UNAMBIGUOUS+GESTURE stories. This difference is compatible with the idea that left IFG activity is critical for constructing a novel semantic representation, as suggested in the second view (Willems et al., 2009). Children who demonstrated gesture-speech integration behaviorally displayed the adult-like recruitment of IFG reported in Dick et al. (2014). Our findings thus support the view that left IFGTr activity indicates integration of information across different modalities.
Our results did, however, reveal differences between the networks underlying gesture-speech integration in children versus adults, specifically in the extent and lateralization of brain activation. We observed bilateral IFGOp involvement in gesture-speech integration in the children in our study. In contrast, Dick et al. (2014) found, in adults, that IFG activation during gesture-speech integration was heavily left-lateralized; that is, there was no right IFG involvement in gesture-speech integration. Right hemisphere activation is observed in this area in adults when hand movements are not meaningfully related to speech (i.e., in self-adaptors or grooming behaviors, Dick et al., 2009; 2014), suggesting that right IFG may be active in adults only when additional effort is needed to fit the hand movements to the accompanying speech (the adults may have been trying to interpret the self-adaptors as gestures). Half of the children in our study were unable to integrate information conveyed in gesture with information conveyed in speech, suggesting that this task is difficult for children of this age. Moreover, even the children who were able to integrate gesture and speech were still novices. They therefore may have needed to put more effort into the task of gesture-speech integration than adults, hence their right-hemisphere involvement (Dick et al., 2012). Overall, our results suggest that right IFG may be sensitive to gesture meaning starting from early childhood, but the nature of that sensitivity might change with age. As children get better at gesture-speech integration, left IFG might start to play a greater and more specialized role than right IFG in interpreting meaningful hand-movements that accompany speech, that is, gestures.
We also found a laterality difference in the role of MTG between adults and children. Dick and colleagues (2014) reported that left MTG, but not right MTG, was involved in gesture-speech integration in adults. In our study, however, it was right MTG that was associated with gesture-speech integration in children. In adults, left MTG is considered to be involved in conceptual integration, regardless of modality, at a supramodal level (Andric & Small, 2012). Right MTG, on the other hand, has been found to be involved in gesture processing when gestures are embedded in a conversational context. For example, in adults, right MTG activation occurs during face-to-face communication when adults are attempting to process communicative intent, as when they process speakers’ body orientation or eye gaze accompanying gestures (Holler, Kokal, Toni, Haggort, Kelly, & Ozyurek, 2015; Nagels, Kircher, Steines, & Straube, 2015). The 8- to 10-year-old children in our study may have relied on right MTG because they might have recruited a broader set of cues during gesture-speech integration (e.g., eye gaze or body orientation) than the adults in the Dick et al. (2014) study. Future studies could manipulate features such as eye-gaze to examine how they influence children’s vs. adults’ gesture-speech integration. As children get better at gesture-speech integration, we predict a decrease in activation of right MTG and an increase in activation of left MTG.
Finally, in the current study, we found activation in STG for gesture-speech integration in children, whereas Dick et al. (2014) did not report activation in this region. The STG is prominently involved in several recent neurobiologically inspired models of language processing and development (Bornkessel-Schlesewsky et al., 2015; Catani & Bambini, 2014). However, its role in gesture processing is less clear. In adults, STG has been argued to play a role in integrating visual and auditory modalities more broadly (Hubbard, Wilson, Callan, & Dapretto, 2009). Involvement of STG in gesture-speech integration in children provides support for the hypothesis that children rely on a broader set of cues and thus activate a wider network responsible for audio-visual integration more generally. As children become more proficient at gesture-speech integration, they may come to rely on a more specialized and narrow network.
Taken together, our results point to possible neurobiological mechanisms underlying children’s increasing ability to integrate gesture and speech over childhood (e.g., Kelly & Church, 1998; Thompson & Massaro, 1986). The extended network we observed in children, relative to adults, is, for the most part, in line with patterns of brain development previously identified in the literature. Human brain development follows a trajectory of increasing specialization of brain networks, accompanied by greater integration of brain regions (Johnson, 2001). Dick and colleagues (2012) compared gesture processing in 8- to 11-year-olds versus adults. They found that children activate a wider range of regions for gesture processing than adults. Wider activation in the brain is considered to reflect lower efficiency and greater effort (van den Heuvel, Stam, Kahn, & Pol, 2009). Our neuroimaging results reveal that children recruit a wider, less specialized network for gesture-speech integration than do adults. Our behavioral results also suggest that gesture-speech integration is more effortful for children than for adults. Taken together, our results suggest that gesture-speech integration is more effortful at younger ages than at older ages, and that behavioral changes may be tied to changes in the underlying network for gesture-speech integration.
Temporal-to-frontal maturational changes might also play a specific role in the neurobiological and behavioral changes in gesture-speech integration over development. In the prominent “temporal-to-frontal” maturational hypothesis of development (Huttenlocher & Dabholkar, 1997; Kinney et al., 1988; though see Leroy et al., 2011 for an alternative maturational hypothesis), temporal regions are assumed to mature earlier in development than frontal regions. Maturation of IFG, which is in the frontal lobe, is highly variable in children ages 8 to 10 (the age of our sample). White-matter connectivity between the temporal and the frontal areas has also been shown to increase with age (Lebel, Walker, Leemans, Phillips, & Beaulieu, 2008). Both dorsal and ventral fronto-temporal white matter tracts show extensive development from infancy to adulthood (Brauer, Anwander, Perani, & Friederici, 2013) and have been associated with developmental changes in general verbal functioning (Mills et al., 2013; Peters et al., 2014; Skeide, Brauer, & Friederici, 2016). As these underlying white matter tracts mature, more efficient connections between the brain regions involved in gesture-speech integration, and increasing specialization of those areas, are to be expected. Changes in connectivity might therefore account for different activation profiles for gesture-speech integration in children and in adults.
Over development, we expect maturational changes in temporal-frontal networks to accompany increasingly adult-like specialized and lateralized activation during gesture-speech integration. The wider activation that includes STG, MTG, and IFG in children’s gesture-speech integration should narrow and specialize as connections strengthen with age. Over time, STG and right MTG may become less involved in gesture-speech integration, whereas left IFG and left MTG may become more central. These changes ought to go hand-in-hand with increases in children’s gesture-speech integration ability. Current longitudinal work in our laboratory is investigating these hypotheses.
Importantly, we showed that the neural basis of gesture-speech integration varies among children. Half of the children in our sample were able to successfully glean information from gesture and integrate it with information gleaned from speech; half could not. Interestingly, these two groups did not differ in how well they understood the story content when all of the information was provided in speech. Not much is known about the sources of individual variability in children’s ability to integrate gesture and speech. Some argue that an individual’s own gesture production experience might influence how gestures are processed (Wakefield, James & James, 2013). Indeed, our whole brain results showed that high integrators used motor cortices to a greater extent when they had to integrate gesture and speech than when gesture provided information that was redundant with speech. Other variables related to individual differences in gesture processing include working memory capacity, verbal and visuo-spatial skill, and motor imagery skill (Gillespie, James, Federmeier, & Watson, 2014; Hostetter & Alibali, 2007). In the current paper, we did not control for individual differences in such skills. Future studies are needed to explore how these cognitive skills relate to individual differences in gesture-speech integration and its neural basis over development.
Our study is, to the best of our knowledge, the first to explore the neurobiology of meaningful gesture-speech integration in children, as opposed to gesture processing on its own. We find that the functional anatomy of gesture-speech integration in children incorporates the same frontal-temporal network as is found in adults, albeit extended to a wider network of regions. Importantly, gesture-speech integration is a skill that varies among children at the behavioral level and this variability is reflected in brain activation patterns.
Supplementary Material
Research Highlights.
The neural basis of gesture-speech integration in children varies as a function of (1) the content of the speech and (2) individual differences in how gesture is processed.
When gesture disambiguates speech, it leads to increased activity in inferior frontal gyri, the right middle temporal gyrus, and the left superior temporal gyrus, compared to when gesture reinforces speech.
Brain activation patterns for gesture-speech integration in children overlap with––but are broader than––patterns in adults performing the same task, and are found only in children who display behavioral evidence of being able to glean information from gesture and integrate it with speech.
The results suggest neurobiological mechanisms that could underlie children’s increasing ability to integrate gesture and speech over childhood, as well as individual differences in those abilities.
Acknowledgements
This research was supported by two institutes of the National Institutes of Health (NIH)––the National Institute of Child Health and Human Development (NICHD) under Grant P01 HD040605 (Goldin-Meadow and Small are PIs) and the National Institute of Deafness and other Communication Disorders (NIDCD) under Grant R01 DC003378. Their support is gratefully acknowledged. We also wish to thank Susan Duncan and Manali Khadilkar for carefully reading and editing an earlier version of this manuscript, Kristi Schonwald for her coordination of the entire project, and Virginia Li for running the fMRI acquisitions. We gratefully acknowledge the efforts of the children and families who participated and who sacrificed their personal time to help us learn about the neurobiology of language development.
Footnotes
To determine word frequency, we used the average of the 1st through 6th grade printed word frequency list published in the Educator’s Word Frequency Guide (Zeno, Ivens, Millard, & Duvvuri, 1995).
The narrative task was administered during a 60-minute scanning session, divided into two 30-minute sessions. In between the two sessions, children were given a 15-minute break to rest, during which they were taken out of the scanner. The narrative task was administered in the second session. The other tasks in the session included a resting state scan and a diffusion tensor imaging scan.
References
- Andric M, & Small SL (2012). Gesture’s neural language. Frontiers in Psychology, 3, 99. [DOI] [PMC free article] [PubMed] [Google Scholar]
- Bates E (1976). Language and context: The acquisition of pragmatics. Academic Press. [Google Scholar]
- Binder JR, Desai RH, Graves WW, & Conant LL (2009). Where is the semantic system? A critical review and meta-analysis of 120 functional neuroimaging studies. Cerebral Cortex, 19(12), 2767–2796. [DOI] [PMC free article] [PubMed] [Google Scholar]
- Bornkessel-Schlesewsky I, Schlesewsky M, Small SL, & Rauschecker JP (2015). Neurobiological roots of language in primate audition: common computational properties. Trends in Cognitive Sciences, 19(3), 142–150. [DOI] [PMC free article] [PubMed] [Google Scholar]
- Brauer J, Anwander A, Perani D, & Friederici AD (2013). Dorsal and ventral pathways in language development. Brain and Language, 127(2), 289–295. [DOI] [PubMed] [Google Scholar]
- Broaders SC, Cook SW, Mitchell Z, & Goldin-Meadow S (2007). Making children gesture brings out implicit knowledge and leads to learning. Journal of Experimental Psychology: General, 136(4), 539. [DOI] [PubMed] [Google Scholar]
- Catani M, & Bambini V (2014). A model for social communication and language evolution and development (SCALED). Current Opinion in Neurobiology, 28, 165–171. [DOI] [PubMed] [Google Scholar]
- Cook SW, Mitchell Z, & Goldin-Meadow S (2008). Gesturing makes learning last. Cognition, 106(2), 1047–1058. [DOI] [PMC free article] [PubMed] [Google Scholar]
- Dick AS, Goldin-Meadow S, Hasson U, Skipper JI, & Small SL (2009). Co-speech gestures influence neural activity in brain regions associated with processing semantic information. Human Brain Mapping,30(11), 3509–3526. [DOI] [PMC free article] [PubMed] [Google Scholar]
- Dick AS, Goldin-Meadow S, Solodkin A, & Small SL (2012). Gesture in the developing brain. Developmental Science, 15(2), 165–180. [DOI] [PMC free article] [PubMed] [Google Scholar]
- Dick AS, Mok EH, Raja Beharelle A, Goldin-Meadow S, & Small SL (2014). Frontal and temporal contributions to understanding the iconic co-speech gestures that accompany speech. Human Brain Mapping, 35(3), 900–917. [DOI] [PMC free article] [PubMed] [Google Scholar]
- Efron B, & Tibshirani R (1986). Bootstrap methods for standard errors, confidence intervals, and other measures of statistical accuracy. Statistical Science, 54–75. [Google Scholar]
- Eickhoff SB, Stephan KE, Mohlberg H, Grefkes C, Fink GR, Amunts K, & Zilles K (2005). A new SPM toolbox for combining probabilistic cytoarchitectonic maps and functional imaging data. Neuroimage, 25(4), 1325–1335. [DOI] [PubMed] [Google Scholar]
- Gillespie M, James AN, Federmeier KD, & Watson DG (2014). Verbal working memory predicts co-speech gesture: Evidence from individual differences. Cognition, 132(2), 174–180. [DOI] [PMC free article] [PubMed] [Google Scholar]
- Goldin-Meadow S (2005). Hearing gesture: How our hands help us think. Harvard University Press. Cambridge, MA. [Google Scholar]
- Goldin-Meadow S, Cook SW, & Mitchell ZA (2009). Gesturing gives children new ideas about math. Psychological Science, 20(3), 267–272. [DOI] [PMC free article] [PubMed] [Google Scholar]
- Goldin-Meadow S, Nusbaum H, Kelly SD, & Wagner S (2001). Explaining math: Gesturing lightens the load. Psychological Science, 12(6), 516–522. [DOI] [PubMed] [Google Scholar]
- Green A, Straube B, Weis S, Jansen A, Willmes K, Konrad K, & Kircher T (2009). Neural integration of iconic and unrelated coverbal gestures: A functional MRI study. Human Brain Mapping, 30(10), 3309–3324. [DOI] [PMC free article] [PubMed] [Google Scholar]
- Holle H, & Gunter TC (2007). The role of iconic gestures in speech disambiguation: ERP evidence. Journal of Cognitive Neuroscience, 19(7), 1175–1192. [DOI] [PubMed] [Google Scholar]
- Holle H, Gunter TC, Rüschemeyer SA, Hennenlotter A, & Iacoboni M (2008). Neural correlates of the processing of co-speech gestures. NeuroImage, 39(4), 2010–2024. [DOI] [PubMed] [Google Scholar]
- Holle H, Obleser J, Rueschemeyer SA, & Gunter TC (2010). Integration of iconic gestures and speech in left superior temporal areas boosts speech comprehension under adverse listening conditions. Neuroimage, 49(1), 875–884. [DOI] [PubMed] [Google Scholar]
- Holler J, Kokal I, Toni I, Hagoort P, Kelly SD, & Özyürek A (2015). Eye’m talking to you: speakers’ gaze direction modulates co-speech gesture processing in the right MTG. Social Cognitive and Affective Neuroscience,10(2), 255–261. [DOI] [PMC free article] [PubMed] [Google Scholar]
- Hostetter AB, & Alibali MW (2007). Raise your hand if you’re spatial: Relations between verbal and spatial skills and gesture production. Gesture,7(1), 73–95. [Google Scholar]
- Hubbard AL, Wilson SM, Callan DE, & Dapretto M (2009). Giving speech a hand: Gesture modulates activity in auditory cortex during speech perception. Human Brain Mapping, 30(3), 1028–1037. [DOI] [PMC free article] [PubMed] [Google Scholar]
- Iidaka T, Anderson ND, Kapur S, Cabez R, & Craik FI (2000). The effect of divided attention on encoding and retrieval in episodic memory revealed by positron emission tomography. Journal of Cognitive Neuroscience, 12(2), 267–280. [DOI] [PubMed] [Google Scholar]
- Johnson MH (2001). Functional brain development in humans. Nature Reviews Neuroscience, 2(7), 475–483. [DOI] [PubMed] [Google Scholar]
- Kelly SD, & Church RB (1998). A comparison between children’s and adults’ ability to detect conceptual information conveyed through representational gestures. Child Development, 69(1), 85–93. [PubMed] [Google Scholar]
- Kelly SD, Ward S, Creigh P, & Bartolotti J (2007). An intentional stance modulates the integration of gesture and speech during comprehension. Brain and Language, 101(3), 222–33. [DOI] [PubMed] [Google Scholar]
- Kinney HC, Kloman AS, & Gilles FH (1988). Sequence of central nervous system myelination in human infancy. II. Patterns of myelination in autopsied infants. Journal of Neuropathology & Experimental Neurology,47(3), 217–234. [DOI] [PubMed] [Google Scholar]
- Kircher T, Straube B, Leube D, Weis S, Sachs O, Willmes K, … & Green A (2009). Neural interaction of speech and gesture: differential activations of metaphoric co-verbal gestures. Neuropsychologia, 47(1), 169–179. [DOI] [PubMed] [Google Scholar]
- Krishnan A, Williams LJ, McIntosh AR, & Abdi H (2011). Partial Least Squares (PLS) methods for neuroimaging: a tutorial and review. Neuroimage,56(2), 455–475. [DOI] [PubMed] [Google Scholar]
- Lau EF, Phillips C, & Poeppel D (2008). A cortical network for semantics:(de) constructing the N400. Nature Reviews Neuroscience, 9(12), 920–933. [DOI] [PubMed] [Google Scholar]
- Lebel C, Walker L, Leemans A, Phillips L, & Beaulieu C (2008). Microstructural maturation of the human brain from childhood to adulthood. Neuroimage, 40(3), 1044–1055. [DOI] [PubMed] [Google Scholar]
- Leroy F, Glasel H, Dubois J, Hertz-Pannier L, Thirion B, Mangin JF, & Dehaene-Lambertz G (2011). Early maturation of the linguistic dorsal pathway in human infants. The Journal of Neuroscience, 31(4), 1500–1506. [DOI] [PMC free article] [PubMed] [Google Scholar]
- McIntosh AR, & Lobaugh NJ (2004). Partial least squares analysis of neuroimaging data: applications and advances. Neuroimage, 23, S250–S263. [DOI] [PubMed] [Google Scholar]
- McNeill D (1992). Hand and mind: What gestures reveal about thought. University of Chicago press; Chicago, IL. [Google Scholar]
- Mills BD, Lai J, Brown TT, Erhart M, Halgren E, Reilly J, Dale A, Appelbaum M & Moses P (2013). White matter microstructure correlates of narrative production in typically developing children and children with high functioning autism. Neuropsychologia, 51(10), 1933–1941. [DOI] [PMC free article] [PubMed] [Google Scholar]
- Morford M, & Goldin-Meadow S (1992). Comprehension and production of gesture in combination with speech in one-word speakers. Journal of Child Language, 19(03), 559–580. [DOI] [PubMed] [Google Scholar]
- Nagels A, Kircher T, Steines M, & Straube B (2015). Feeling addressed! The role of body orientation and co-speech gesture in social communication.Human brain mapping, 36(5), 1925–1936. [DOI] [PMC free article] [PubMed] [Google Scholar]
- Nichols T, & Hayasaka S (2003). Controlling the familywise error rate in functional neuroimaging: a comparative review. Statistical methods in medical research, 12(5), 419–446. [DOI] [PubMed] [Google Scholar]
- Novack MA, Congdon EL, Hemani-Lopez N, & Goldin-Meadow S From action to abstraction: Using the hands to learn math. Psychological Science, 2014, 25(4), 903–910. [DOI] [PMC free article] [PubMed] [Google Scholar]
- Oldfield RC (1971). The assessment and analysis of handedness: The Edinburgh inventory. Neuropsychologia 9(1), 97–113. [DOI] [PubMed] [Google Scholar]
- Perry M, Berch D, & Singleton J (1995). Constructing shared understanding: The role of nonverbal input in learning contexts. Journal of Contemporary Legal Issues, 6, 213. [Google Scholar]
- Peters BD, Ikuta T, DeRosse P, John M, Burdick KE, Gruner P, Prendergast DM, Szesko PR & Malhotra AK (2014). Age-related differences in white matter tract microstructure are associated with cognitive performance from childhood to adulthood. Biological Psychiatry, 75(3), 248–256. [DOI] [PMC free article] [PubMed] [Google Scholar]
- Ping R, & Goldin-Meadow S (2010). Gesturing saves cognitive resources when talking about nonpresent objects. Cognitive Science, 34(4), 602–619. [DOI] [PMC free article] [PubMed] [Google Scholar]
- Price CJ (2010). The anatomy of language: a review of 100 fMRI studies published in 2009. Annals of the New York Academy of Sciences, 1191(1), 62–88. [DOI] [PubMed] [Google Scholar]
- Raja AC (2013). Devleopmnet of Distriubted Nueral Sysetms for Readnig in Heatlhy and Brian-Injrued Chlidren* (*if you can read this you have a well-developed whole word reading system) (Doctoral dissertation, University of Toronto). [Google Scholar]
- Rowe ML, & Goldin-Meadow S (2009). Early gesture selectively predicts later language learning. Developmental Science, 12(1), 182–187. [DOI] [PMC free article] [PubMed] [Google Scholar]
- Singer MA, & Goldin-Meadow S (2005). Children learn when their teacher’s gestures and speech differ. Psychological Science, 16(2), 85–89. [DOI] [PubMed] [Google Scholar]
- Smith GS, Laxton AW, Tang-Wai DF, McAndrews MP, Diaconescu AO, Workman CI, & Lozano AM (2012). Increased cerebral metabolism after 1 year of deep brain stimulation in Alzheimer disease. Archives of neurology, 69(9), 1141–1148. [DOI] [PubMed] [Google Scholar]
- Skeide MA, Brauer J, & Friederici AD (2016). Brain functional and structural predictors of language performance. Cerebral Cortex, 26(5), 2127–2139. [DOI] [PubMed] [Google Scholar]
- Straube B, Green A, Bromberger B, & Kircher T (2011). The differentiation of iconic and metaphoric gestures: Common and unique integration processes. Human Brain Mapping, 32(4), 520–533. [DOI] [PMC free article] [PubMed] [Google Scholar]
- Thompson LA, & Massaro DW (1986). Evaluation and integration of speech and pointing gestures during referential understanding. Journal of Experimental Child Psychology, 42(1), 144–168. [DOI] [PubMed] [Google Scholar]
- Thompson LA, & Massaro DW (1994). Children′ s Integration of Speech and Pointing Gestures in Comprehension. Journal of Experimental Child Psychology, 57(3), 327–354. [DOI] [PubMed] [Google Scholar]
- Valenzeno L, Alibali MW, & Klatzky R (2003). Teachers’ gestures facilitate students’ learning: A lesson in symmetry. Contemporary Educational Psychology, 28(2), 187–204. [Google Scholar]
- van den Heuvel MP, Stam CJ, Kahn RS, & Pol HEH (2009). Efficiency of functional brain networks and intellectual performance. The Journal of Neuroscience, 29(23), 7619–7624. [DOI] [PMC free article] [PubMed] [Google Scholar]
- Van Petten C, & Luka BJ (2006). Neural localization of semantic context effects in electromagnetic and hemodynamic studies. Brain and Language, 97(3), 279–293. [DOI] [PubMed] [Google Scholar]
- Wakefield EM, James TW, & James KH (2013). Neural correlates of gesture processing across human development. Cognitive Neuropsychology,30(2), 58–76. [DOI] [PubMed] [Google Scholar]
- Willems RM, Özyürek A, & Hagoort P (2007). When language meets action: The neural integration of gesture and speech. Cerebral Cortex, 17(10), 2322–2333. [DOI] [PubMed] [Google Scholar]
- Willems RM, Özyürek A, & Hagoort P (2009). Differential roles for left inferior frontal and superior temporal cortex in multimodal integration of action and language. NeuroImage, 47(4), 1992–2004. [DOI] [PubMed] [Google Scholar]
- Zeno SM, Ivens SH, Millard RT, & Duvvuri R (1995). The educator’s word frequency guide. New York: Touchstone Applied Science Associates.Inc. My Book. [Google Scholar]
Associated Data
This section collects any data citations, data availability statements, or supplementary materials included in this article.