

Abstract
Background:
Only a fraction of circulating insulin-like activity is due to insulin itself. The aim of this study was to determine total serum insulin-like activity mediated via the insulin receptor isoform A (IR-A) and isoform B (IR-B) by using kinase receptor activation (KIRA) assays specific for the IR-A and IR-B.
Methods:
The IR-A and IR-B KIRA assays use human embryonic kidney cells which have been transfected with the human IR-A or IR-B gene and quantify serum-mediated phosphorylation of the IR.
Results:
Both IR KIRA assays were sensitive (detection limit 32 pmol/L) and precise (intra-and inter assay CV: <12% and <15%). The EC50s of insulin, IGF-I and IGF-II were 1.4,11.2 and 6.7 nmol/L for the IR-A KIRA assay, and 1.3, 31.0 and 15.7 nmol/L for the IR-B KIRA assay.
Results:
The operational range of both assays allowed for determination of total insulin-like activity in human serum. Analysis of serum samples showed that there was a significant positive correlation between serum insulin-like and immunoreactive insulin concentrations (IR-A: r =0.56, p = 0.01, IR-B: r = 0.68, p = 0.001). Importantly, addition of IGF-I or IGF-II antibodies to human serum samples could substantially decrease the endpoint signal in both KIRA assays.
Conclusions:
We showed that serum IGF-I and IGF-II may substantially contribute to IR signalling. Since IR isoform specific KIRA assays also take into account the contribution of IGFs present in serum on IR signalling, they may help to gain more insight into the roles of IGF mediated IR-A and IR-B activation in health and disease.
Keywords: Insulin, Insulin-like growth factors, Insulin receptor isoforms, Insulin bioactivity, Insulin receptor KIRA assays
1. Introduction
Early studies have shown that insulin-like mediated effects of serum on target tissues are much greater in vitro and in vivo than what would be expected on the basis of the measured immunoreactive insulin concentrations (Froesch et al., 1985).
Insulin elicits its various biological responses by binding to the insulin receptor (IR), which is then followed by activation of its intrinsic tyrosine kinase (Okada et al., 1998). In the human body, due to alternative splicing of exon 11 of the IR gene, two IR transcripts are generated, resulting in IR isoform A (IR-A) (lacking exon 11) and in IR isoform B (IR-B) (full length) (Belfiore et al., 2009). The relative abundance of mRNAs encoding the IR-A and IR-B isoforms is regulated in a tissue-specific manner (Moller et al., 1989) and also differs by stage of cell development and differentiation. IR-A is the predominant isoform in fetal tissues and cancer cells, while the IR-B is the classical receptor for insulin with metabolic effects in muscle, liver and adipose tissues. (Moller et al., 1989; Mosthaf et al., 1990). Although studies have suggested that differences between IR-A and IR-B in terms of receptor activation and signalling may result in different functions of each IR isoform (Belfiore et al., 2009), it appears that most cells have both IR isoforms and that the ratio of the two seems to be very important (Belfiore et al., 2009).
IGF-I and IGF-II primarily activate the IGF-I receptor (IGF-IR), but they can also activate the IRs (Boucher et al., 2010). According to the literature, the IR-B binds insulin with high affinity but the IGFs poorly, while the IR-A binds insulin and IGF-II with high affinity and IGF-I with low affinity (Denley et al., 2004). In this respect, it is important to underline that although the IGFs have a lower affinity for the IR than insulin, in vivo circulating total concentrations of IGFs are much higher than of insulin (picomolar vs. nanomolar range) and that IGF bioactivity (1–2% of the total IGF concentration) is modulated by the presence of IGF binding proteins (IGFBPs) and IGFBP proteases (Blakesley et al., 1996). Nevertheless, insulin immunoassays measure only immunoreactive insulin and by doing so they ignore at least the potential insulin-like effects of the IGFs in blood. Moreover, insulin immunoassays do not assess potential biological effects of circulating insulin-like factors on the IR-A and the IR-B.
The aim of this study was to determine the potential biologic actions of serum on the IR-A and the IR-B and to assess the relative contribution of circulating IGFs in this respect. For this purpose we used cell-based kinase receptor activation (KIRA) assays, one specific for the human IR-A and one specific for the human IR-B. Since there are no specific antibodies for the two isoforms available, specificity was determined not by isoform-specific antibodies but by transfecting HEK cells with either the IR-A or the IR-B.
The principle of these two assays is based on quantification of phosphorylated tyrosine residues within the IR after in vitro stimulation with serum. The same principle has been used for IGF-I KIRA assay specific for the IGF-IR (Brugts et al., 2008; Chen et al., 2003).
2. Materials and methods
2.1. Peptides
MAI1, a monoclonal antibody directed against the extracellular domain of both human IRs, was used as capture antibody (Novozymes-Gropep (Aidelade, Australia)). Europium-labelled PY20 (Eu-PY20); a monoclonal anti-phosphotyrosine antibody was used as detection antibody (PerkinElmer life sciences (Groningen, The Netherlands)). Human insulin (Actrapid®) was obtained from Novo Nordisk (Bagsvaerd, Denmark), human recombinant IGF-I from Invitrogen (Breda, The Netherlands) and human recombinant IGF-II was obtained from Sigma-Aldrich (Zwijndrecht, The Netherlands). An IGF-I neutralizing antibody was obtained from R&D Systems Europe Ltd. (Abingdon, UK). Monoclonal IGF-II antibody IgG1 m610 was developed in our laboratories (Feng et al., 2006).
2.2. Cell line and media
The human embryonic kidney (HEK) cell-line Flip-in™−293 from Invitrogen was transfected with plasmids (pNTK-2) containing a cDNA insert of the human IR-A (pNTK2-IR-A) or IR-B (pNTK2-IR-B) using Fugene® transfection reagens according to manufacturer’s protocol. The plasmids were kindly provided by Axel Ullrich (Martinsried, Germany). After 48 h, cells were trypsinized and cultured in Dulbecco’s Modified Eagles Medium (DMEM: gluc+, L-Glutamin +, Pyr+) from Invitrogen supplemented with 10% fetal bovine serum (FBS) from Invitrogen and geneticin 1000 μg/ mL from Invitrogen. Separate colonies were isolated, expanded and tested for IR expression defined by quantitative RT-PCR as relative copy number of mRNA (see below) and by immunocytochemistry (see below). The transfected cells were cultured in 75 cm3 culture flasks from Corning (Amsterdam, The Netherlands) using DMEM containing 10% FBS, 100U/mL penicillin, 100 μg/L streptomycin from Invitrogen and 500 μg/mL geneticin.
2.3. Quantitative RT-PC
Total RNA was isolated from 106 cells, using a commercially available kit (High pure RNA isolation kit) from Roche (Almere, The Netherlands), according to the recommendation by the manufacturer. Complementary DNA was synthesized using 500 ng of total RNA in a Super Reverse Transcriptase (RT) buffer from HT Biotechnology Ltd. (Cambridge, UK), together with 40 nmol of each deoxynucleotide triphosphate, 15 ng oligo-dT primer, 20 U RNAse inhibitor, and 4 U AMV Super RT also from HT Biotechnology, in a final volume of 40 μl. This mixture was incubated for 1 h at 40 °C and thereafter diluted 5 times in bidest. A quantitative PCR was performed using the TaqMan Gold nuclease assay from Roche, according to the manufacturer’s protocol. The primer and probe sequences (Sigma Aldrich (Zwijndrecht, The Nederlands)) were: IR-A forward, 5’-CGTTTGAGGATTACCTGCACAA-3’; IR-A reverse, 5’-GCCAAGGGACCTGCGTTT-3’; and IR-A probe, 5’-FAM-TGGTTTTCGTCCCCAGGCCATC-TAMRA-3’. IR-B forward, 5’-CCCAGAAAAACCTCTTCAGGC-3’; IR-B reverse, 5’-GGACCTGCGTTTCCGAGA-3’; and IR-B probe, 5’-FAM-CTGGTGCCGAGGACCCTAGGCC-TAMRA-3’. IGF-II Receptor forward, 5’-ACCGACCCCTCCACGC-3’; IGF-II Receptor reverse, 5’-CCTCCAAGGCCACCTTCAG3’; and IGF-II Receptor probe, 5’-FAM-AG-CAGTACGACCTCTCCAGTCTGGCAAA-TAMRA-3’. Samples were normalized against the expression of the housekeeping gene hypoxanthine-phospho-ribosyl-transferase (HPRT). Dilution curves were constructed for calculating the PCR efficiency for every primer set (Rasmussen, 2001). PCR efficiencies were: HPRT=1.98, IR-A= 1.89, IR-B = 1.92, IGF-II Receptor = 1.87. The primer and probe sequences for IGF-I, IGF-II and for the IGF-IR have been previously described (van Koetsveld et al., 2006; Vitale et al., 2009). The relative expression of genes were calculated using the comparative threshold method, 2-ΔCt (Schmittgen and Livak, 2008), after efficiency correction (Pfaffl, 2001) of target and reference transcripts.
2.4. Total human IR sandwich ELISA
HEK IR-A and HEK IR-B cells were plated into a 6 well culture plate (Corning, NY, USA), 300,000 cells/well in 2 mL of culture medium at 37 °C and 5% CO2. After 72 h medium was removed and replaced with 2 mL DMEM containing 0.1% HSA, 100U/mL penicillin and 100 μg/L streptomycin and 500 μg/mL geneticin. The next day, a total IR sandwich ELISA was performed according to manufactures protocol (Human total Insulin R, R&D Systems Europe Ltd., Abingdon, UK). Quantification of protein concentration was performed by using Nanodrop ND-1000 (Thermo Scientific). For the HEK IR-A 200 μg of lysate was used to perform the ELISA, compared to 100 μg for the HEK IR-B.
2.5. Immunocytochemistry
HEK IR-A and HEK IR-B cells were cultured on chamber slides from Invitrogen (Breda, The Netherlands) for 2 days (20.000 cells/chamber) in DMEM containing 10% FBS, 100U/mL penicillin, 100 μg/L streptomycin and 500 μg/mL geneticin. Prior to immunostaining, cells were fixed with 4% paraformaldehyde and 0.2% picric acid in phosphate buffer, pH 6.9 for 40 min at room temperature. After washing with Tris/HCl/Tween 0.5%, fixation of cells was finalized by incubating them with 50% methanol (3 min at room temperature) and 100% methanol (3 min at room temperature). Fixed cells were washed again with Tris/HCl/Tween 0.5% followed by washing with PBS. Subsequently they were incubated with H2O2 (30%) (15 min at room temperature) to quench endogenous peroxidase and were washed with Tris/HCl/Tween 0.5% thereafter. Fixed cells were then incubated with the following primary antibodies for 1 h at room temperature: anti-IR (Enzo Life Sciences, Antwerp, Belgium; mouse monoclonal, 1:25) and anti-IGF-IR (Novus Biologicals, Cambridge, United Kingdom; mouse monoclonal, 1:500). After incubation, cells were washed and two drops of HRP-Rabbit/Mouse from Dako (Heverlee, Belgium) were added to chamber slides and incubated for 30 min. Bound antibodies were visualized with freshly prepared 100 μl of DAB from Dako (Heverlee, Belgium) twice for 5 min at room temperature, in the dark. Staining was then stopped by rinsing with water. Slides were counterstained with haematoxylin and eosin and coverslipped. For negative controls, the primary antibody was omitted.
2.6. Buffers
Preparation of the antibody coating buffer (ACB), blocking buffer and lysis buffer has been previously described (Chen et al., 2003). Standards and serum samples were diluted in Krebs Ringer bicarbonate (KRB) buffer that was adjusted to pH 7.4 by CO2 and supplemented with 0.5% and 0.1%, respectively (wt./vol.), Human Serum Albumin (HSA), (Octalbine®) (Octopharma (Lachen, Switzerland)). EU-PY20 was diluted in a commercial assay buffer obtained from PerkinElmer Life Sciences as was the washing solution and the enhancement solution.
2.7. IR KIRA assay procedure
On day 1, cells were plated into a 48 well culture plate (Corning, NY, USA), 200,000 cells/well in 500 μl culture medium for 24 h at 37 °C and 5% CO2.
On day 2, medium was removed and replaced with 500 μl DMEM containing 0.1% HSA, 100U/mL penicillin and 100 μg/L streptomycin and 500 μg/mL geneticin. In addition, a 96-well microtiter test plate from Biozym (Landgraaf, The Netherlands) was coated with MAI-1 diluted in ACB in the indicated concentrations and incubated overnight at 4 °C. On day 3 the MAI-1 solution was replaced with 300 μl blocking buffer containing 1% HSA. The plate was incubated for 3 h at RT.
Transfected HEK IR cells were stimulated for the times indicated with either serial dilutions of insulin, IGF-I or IGF-II or human serum diluted in KRB containing 0.5% or 0.1% HSA at 37 °C as indicated. After stimulation, supernatant was removed and 250 μl lysis buffer was added to each well. The plate was incubated for 1 h on a plate shaker at 4 °C. Crude cell lysate (150 μl per well) was transferred to the blocked antibody plate and incubated overnight at 4 °C on a plate shaker.
On day 4, wells were washed 3 times with 250 μl wash buffer and 150 μl of EU-PY20 diluted in assay buffer was added in the indicated concentrations. Samples were incubated for 2 h at RT on a plate shaker. Wells were washed 6 times with 250 μl of wash buffer after which 150 μl of enhancement solution was added. The samples were incubated for 20 min at room temperature and were read in a time-resolved fluorometer (Victor2 multilabel counter) from PerkinElmer Life Sciences.
By performing the IR KIRA assay procedure as described above, optimal assay conditions were found. MAI1 dilutions were tested at 0.5, 2.5 and 5.0 μg/mL in combination with EU-PY20 dilutions at 1.25 μg/mL and 2.5 μg/mL. In both assays maximal S/N was reached at a concentration of 2.5 μg/mL of MAI-1 and at 1.25 μg/ mL of EU-PY20 (data not shown); remaining experiments were performed at these concentrations. Sample incubation times tested were 5, 10, 15, 20 and 30 min. Maximal S/N was reached after 10 min of stimulation with insulin (data not shown) and so 10 min was chosen as stimulation time for the remaining experiments. Sensitivity and specificity were tested using dose titration curves of insulin, IGF-I and IGF-II, respectively. For both IR KIRA assays the detection limit for insulin was found to be 32 pmol/L (determined by repeated measurements of a blank sample and reported as the mean plus 3 SD of the blank). The intra-assay CVs of both IR KIRA assays were <12% and the inter-assay CVs were <15%, respectively, for the samples analyzed in duplicates (5 repetitions on 5 different days).
Previously it has been described that serum needs to be diluted to perform a KIRA assay, since cells become repressed at high serum concentrations (Chen et al., 2003). In addition, by using the KIRA assay specific for the IGF-IR, it has previously been shown that the endpoint signal was relatively independent of serial dilutions of serum samples up to 20-fold (Chen et al., 2003). This phenomenon has been explained by the buffering capacity of IGFBPs, which liberate IGFs during serum dilution to maintain equilibrium. Due to this phenomenon, for the IGF-IR specific KIRA assay, bioactivity of serum samples is measured in samples that have been diluted 10-fold.
Therefore, to test whether a similar phenomenon of liberation of IGFs could be detected in the IR KIRA assays, we compared the endpoint signals induced by 4-, 8-, 16-, and 32-fold diluted serum. Subsequently we determined the relative contribution of the IGFs to the endpoint signal by coincubating 2-and 20-fold diluted serum samples from 2 healthy subjects with IGF-I and IGF-II neutralizing antibodies. First we tested at known concentrations of IGF-I or IGF-II in KRB 0.5% HSA, which concentrations of specific IGF-I-and IGF-II neutralizing antibodies reduced the IR-A KIRA assay signal >90% (neutralization dose 90 (ND90)). The neutralizing antibodies were then pre-incubated (at these ND90 concentrations) with 2-or 20-fold diluted sera at 37 °C for 1 h (ND90; 65 nmol/L neutralizing IGF-I antibody; 40 nmol/L IGF-II neutralizing antibody). After incubation, the protocol was followed as described above.
Serum insulin-like bioactivity (10-fold diluted) was compared to immunoreactive insulin concentrations as measured by a solid-phase, enzyme-labelled chemiluminescent immunometric assay (Immulite 2000, Siemens Medical Solutions).
All serum samples were collected in accordance with the Declaration of Helsinki. All subjects provided written informed consent.
2.8. Statistical analysis
Data were analysed using GraphPad software (Prism 5, London, United Kingdom). Statistical analysis was performed using the One-Way ANOVA or Two-way ANOVA repeated measures followed by Newman-Keuls Multiple Comparison Test or Bonferroni post tests, respectively. Means + SEM or 95% CI and signal-to-noise ratios of bioactivity measurements are presented. Noise was defined as the signal after stimulation with vehicle. Accordingly, the Signal-to-Noise ratios (S/N) were calculated by using the following formula: absolute counts after stimulation with a ligand/absolute vehicle counts. The CVs were calculated by using the formula: (SD/mean) × 100%. A p-value of (p < 0.05) was considered statistically significant.
3. Results
3.1. Cell-lines
Before transfection, endogenous relative mRNA expression levels of IR-A, IR-B and IGF-IR (normalized against HPRT) in the nontransfected HEK cells were 0.056, 0.005 and 0.046, respectively. After transfection, the IR-A mRNA expression level in HEK IR-A cells was 2.82, while IR-B mRNA expression level in the HEK IR-B cells was 6.96. IR protein content determined by ELISA was 90 pg/100 μg protein in the HEK IR-A cells compared to 450 pg/ 100 μg protein in the HEK IR-B cells. Immunocytochemical staining showed that both the HEK IR-A and HEK IR-B cells contained IRs and IGF-IRs (Fig. 1). The mRNA expression levels of IGF-IIR, IGF-I, and IGF-II after transfection were respectively 0.044, undetectable, and 0.003 in the HEK IR-A cells and 0.049, undetectable, and 0.014 in the HEK IR-B cells. These expression ratios remained stable over at least 20 cell passages (data not shown).
Fig. 1.
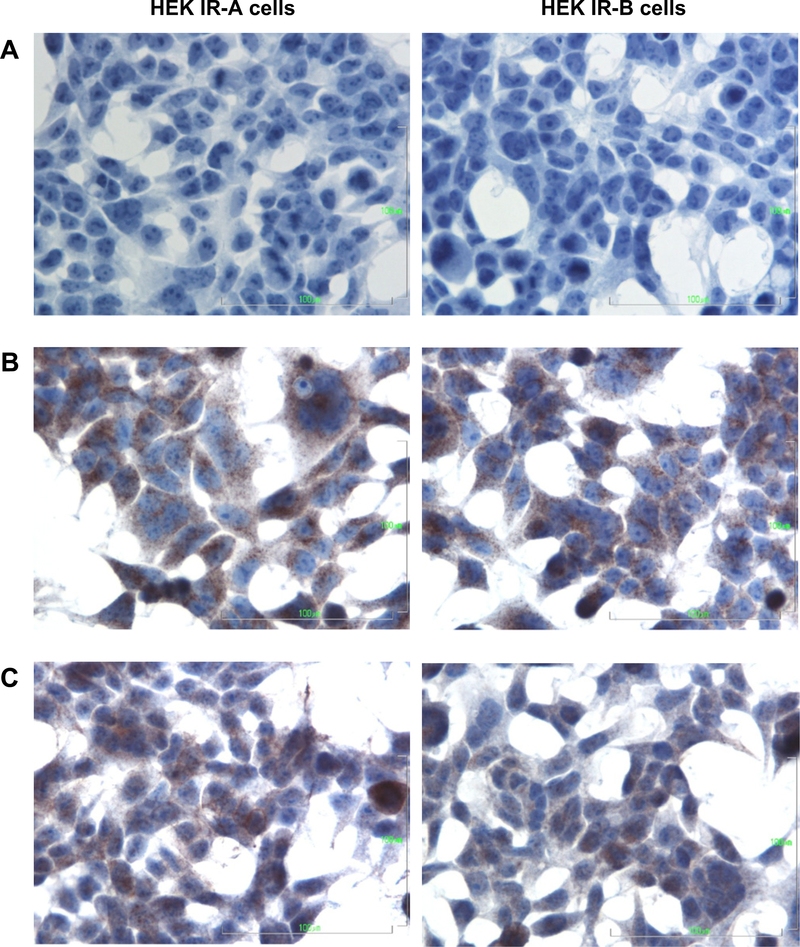
Immunocytochemical staining of the IR and IGF-IR on HEK IR-A (left) and HEK IR-B (right) cells (400×). Cells were cultured on chamber slides for two days after which the immunostaining was performed. (A) negative control, (B) IR, (C) IGF-IR.
3.2. Specificity
In the IR-A KIRA assay the EC50 for insulin was significantly lower than for IGF-I and IGF-II (1.4nmol/L [1.3–1.7] (mean [95% CI]) vs. 11.2nmol/L [8.6–14.8] and 6.7 [3.5–12.5], p <0.001, respectively) (Fig. 2). The EC50 for IGF-II was significantly lower than for IGF-I (p = 0.02) (Fig. 2A). Also in the IR-B KIRA assay the EC50 for insulin was significantly lower than for IGF-I and IGF-II (1.3 nmol/L [1.1–1.6] vs. 31.0nmol/L [29.2–32.8] and 15.7 [12.9–19.1], p <0.001, respectively) and the EC50 for IGF-II was significantly lower than for IGF-I (p < 0.001) (Fig. 2B).
Fig. 2.

Specificity of the IR-A (A) and IR-B (B) KIRA assays. Protocol was followed as described in Section 2. Plates were coated with 2.5 μg/mL of capture antibody (MAI1)and 1.25 μg/mL of detection antibody (EU-PY20) was used. Cells were stimulated with a dose titration curve of insulin (solid line), IGF-I (dashed line, squares) or IGF-II (dashed line, triangles) for 10 min. Data are presented as mean (+SEM) KIRA assay signal of three independent experiments. Stimulation with 100 nmol/L of insulin was arbitrarily set at 100%. ***p < 0.001 for significant difference between insulin vs. IGF-I and IGF-II. •p < 0.05 for significant difference between IGF-I vs. IGF-II. •••p < 0.001 for significant difference between IGF-I and IGF-II.
3.3. Contribution of IGFs to IR signaling
To test whether the endpoint signal was relatively independent of serial dilutions of serum samples, serum samples from two healthy subjects were serially diluted (1:4, 1:8, 1:16 and 1:32). Analysis of these serial dilutions showed that, as in the IGF-IR specific KIRA assay, the signal in both IR KIRA assays was relatively independent of serum dilution. For the IR-A KIRA assay, when a serum sample was diluted 16-fold it induced a significant lower signal than when it was diluted 4-fold (Fig. 3 left panel). For the IR-B KIRA assay, when a serum sample was diluted 32-fold it induced a significant lower signal than when it was diluted 4-fold (Fig. 3 right panel). To test whether indeed IGFs contribute substantially to the endpoint signal of both IR KIRA assays, we coincubated 2-fold and 20-fold diluted serum samples from two healthy subjects with IGF-I and IGF-II neutralizing antibodies. First the IR-A KIRA assay was used to test the specificities of the blocking antibodies that were used in the neutralizing experiments. Adding a constant amount of an IGF-I antibody (65 nmol/L) to a dilution of IGF-I blocked the endpoint signal with >90% (Fig. 4A) whereas the endpoint signal produced by IGF-II or insulin was not influenced (data not shown). Adding a constant amount of an IGF-II neutralizing antibody (40 nmol/L) to a dilution of IGF-II blocked the endpoint signal with >90% (Fig. 4B) whereas the endpoint signal produced by IGF-I or insulin was not influenced by co-incubation with an IGF-II antibody (data not shown).
Fig. 3.

Effects of serum dilution on the IR-A (A) and IR-B (B) KIRA assay signal. Protocol was followed as described in Section 2. Cells were stimulated with insulin (range 63–500 pmol/L) (black line) or with serum samples from two healthy subjects (control 1 triangles, control 2 squares) that were diluted 1:4, 1:8, 1:16 and 1:32. Data are shown as mean (+SEM) bioactivity (expressed as Signal-to-Noise ratio) from three independent experiments.*p < 0.05,**p < 0.01 for significant decrease in Signal-to-Noise ratio.
Fig. 4.

Testing ND90 (dose at which the endpoint KIRA signal is 90% reduced) ofIGF-1-and IGF-II neutralizing antibodies in the IR-A KIRA assay. Samples with IGF-I or IGF-II (range from 0.1–10 nM) were preincubated with a constant concentration of neutralizing antibodies at 37° for 1 h. After incubation, protocol was followed as described in Section 2. (A) IR-A KIRA assay signal without (black bars) and with (white bars) addition of 65 nmol/L of an IGF-I neutralizing antibody to a standard curve of IGF-I. (B) IR-A KIRA assay signal without (black bars) and with (white bars) addition of 40 nmol/L of an IGF-II neutralizing antibody to a standard curve of IGF-II. Data are presented as mean (+SD) bioactivity (expressed as Signal-to-Noise-Ratio) of two experiments.
Signal reduction by the neutralizing antibodies directed to IGF-I or IGF-II in serum varied between the two subjects (Fig. 5). In control 1, coincubation with an IGF-I or IGF-II antibody in 2-fold diluted serum did not reduce the endpoint signal in both assays. However, in 20-fold diluted serum addition of the IGF-I antibody reduced the endpoint signal with 38% in the IR-A KIRA assay and with 26% in the IR-B KIRA assay. Also addition of the IGF-II neutralizing antibody reduced the signal in both assays with 41% and with 40%, respectively. In control 2, coincubation of 2-fold diluted serum with an IGF-I or IGF-II antibody also did not reduce the endpoint signal in both assays. However, coincubation of 20-fold diluted serum with an IGF-I antibody reduced the signal with 73 % in the IR-A KIRA assay compared to 20% in the IR-B KIRA assay. Coincubation of an IGF-II antibody reduced the signal in both assays with 27% and 22%, respectively.
Fig. 5.

Contribution of IGF-I and IGF-II in serum samples to the endpoint signal of the IR-A (A) and IR-B (B) KIRA assay. Serum samples from two healthy subjects were diluted 2-fold and 20-fold and preincubated at 37 °C for 1 h with an IGF-I neutralizing antibody (65 nmol/L) or with an IGF-II (40 nmol/L) neutralizing antibody. After incubation, protocol was followed as described in Section 2. For both controls immunoreactive insulin, IGF-I, IGF-II, IGFBP-1 and IGFBP-3 concentrations were measured and were 14 pmol/L, 37 nmol/L, 69 nmol/L, 3.6 nmol/L and 174 nmol/L, respectively for control 1 and 46 pmol/L, 24nmol, 73 nmol/L, 1.1 nmol/L and 205 nmol/L, respectively for control 2. Data are shown as mean (+SD) percentage reduction in endpoint signal. 100% is the endpoint signal measured in serum without adding neutralizing antibodies.
Serum bioactivity was higher than its immunoreactive insulin content. Analysis of 20 serum samples (10-fold diluted) showed that there was a clear correlation between serum bioactivity and immunoreactive insulin concentrations (Fig. 6).
Fig. 6.

(A) Relationships between immunoreactive insulin concentrations, IR-A bioactivity (black dots) and IR-B bioactivity (open dots) measured in 20 serum samples collected in fasting state. (B) Relationships between immunoreactive IGF-I concentrations, IR-A bioactivity (black dots) and IR-B bioactivity (open dots) measured in 20 serum samples collected in fasting state. Serum samples were diluted 10-fold before insulin-like bioactivity was measured.
4. Discussion
Here we show that IGF-I and IGF-II present in human serum may contribute substantially to IR-A and IR-B signalling in vitro. Sample dilution in a KIRA assay has been described to be necessary because cells become repressed at high serum concentrations (Chen et al., 2003). Previously it has been shown that in the KIRA assay specific for the IGF-IR the endpoint signal is relatively independent of serum dilution (Chen et al., 2003). This phenomenon has not only been described for free IGF-I but also for free thyroid hormones (Weeke and Orskov, 1975). In the case of IGFs this has been attributed to the liberation of IGFs from IGFBPs during dilution to maintain equilibrium. We determined whether the same phenomenon was present in the IR KIRA assays. Also in the IR KIRA assays the endpoint signal was relatively independent of serum dilution as long as the serum dilutions were kept below 1:16. Although there may be several reasons for different kinetics by either insulin or serum (e.g. including different ligand-receptor affinity, binding proteins, non-specific serum protein interference), the non-paralellism could also indicate that circulating IGFs substantially contribute to the endpoint signal in both IR KIRA assays. The latter was supported by the finding that, in both IR KIRA assays, IGF-I and IGF-II antibodies could partially reduce the endpoint signal.
When antibodies directed against IGF-I and IGF-II were added to 20-fold diluted serum samples, as discussed above, only part of the IR-A or IR-B bioactivity was neutralized. However, when these specific antibodies were added to “pure” samples containing IGF-I or IGF-II, IR-A or IR-B activation could almost completely neutralized by these antibodies. The only partial effect of the neutralizing antibodies in 20-fold diluted serum may be explained as follows; Since up to 90% of the circulating IGFs are normally contained in heterotrimeric complexes with the acid-labile subunit and IGFBP-3 or IGFBP-5 (Twigg and Baxter, 1998), the effect of these neutralizing antibodies in serum could be decreased (or even absent) if the IGFs are sequestered by the IGFBPs in these complexes. This suggests that, in contrast to ‘‘pure’’ samples of the IGFs, the interactions and competition between insulins, IGFs, IGFBPs in serum at the level of the IRs are very intricate. In order to explain the substantial contributions of serum IGFs to IR signalling we would like to provide the reader a mathematical example. Under healthy circumstances, fasting insulin levels are around 50 pmol/ L. Giving an individual with a concentration of total IGF-I of around 20 nmol/L and an IGF-II concentration of around 80 nmol/L, there will be around 2000 pmol/L of free IGFs (free IGFs are around 2% of the total IGF concentration (Brugts et al., 2008). Although the affinity of insulin for the IRs is 10–100× fold higher than of IGF-I and IGF-II, the free concentration of IGFs, in this example, is about 40-fold compared to insulin. Since the biological response of a target cell is not only determined by the affinity for the IR, but also by the concentrations of insulin and IGFs, this example illustrates that it may not be surprising that IGFs may substantially contribute to the total insulin receptor bioactivity. More than fifty years ago it was already found that serum contained a higher amount of total insulin-like bioactivity than immunoreactive insulin (Yalow and Berson, 1960) and that anti-insulin antibodies could only block a small portion of the total insulin bioactivity of serum (Froesch et al., 1963). However, due to the highly variable results of bioassays, they were replaced by insulin radioimmunoassays (RAI) in the sixties (Yalow and Berson, 1960). Although the RIA for insulin has greatly increased knowledge of the physiology of glucose homeostatasis and of the diverse causes of diabetes mellitus it neglects the potential contributions of IGFs to insulin-like signalling (Blumenthal, 2009).
Over time several attempts have been made to introduce new bioassays to measure insulin-like activity but so far they have not been able to determine human serum bioactivity on human cells with high sensitivity and low intra-and interassay variability. The two IR KIRA assays that were used in this study both show a reasonably sensitivity and for bioassays an exceptionally low intra-and inter-assay CVs. In line with previous studies, the EC50 of IGF-I was higher than IGF-II in both the IR-A and IR-B KIRA assay (Denley et al., 2004; Frasca et al., 1999) In addition, since they are specific for either the human IR-A or human IR-B, it is possible to distinguish the potential insulin-like mediated effects of serum on both IR isoforms. The latter may help to gain more insight into the functional roles of the two IR isoforms that, in recent years, have attracted renewed interest due to the finding that the IR isoform A besides binding to insulin also binds IGF-II with high affinity (Morcavallo et al., 2011). So, the two IR KIRA assays may be useful tools to disentangle the relative contribution of the IGFs present in serum on IR specific signalling. Nevertheless the authors would like to emphasize that with the IR KIRA assays true quantification of the specific and relative contribution of IGFs to overall IR activity remains difficult and therefore results should be interpreted with care.
Although the operational range of the assays allows to quantify the overall effect of total insulin-like factors in serum, it should be acknowledged that KIRA assays (as for all in-vitro systems) do not mimic the exact in vivo situation. KIRA assays only provide a crude, albeit convenient, measure of IR activation. The contribution of various circulating peptides in activating the IRs in vivo depends not only on their concentrations and bioavailability, but also on the relative and absolute concentrations of the two IR present on various target tissues. In most tissues and cells where significant levels of both IRs and IGF-IRs are present, hybrids may be formed. These hybrids are heterodimeric receptors consisting of an IR alpha/beta monomer and an IGF-IR alpha/beta monomer linked by disulfide bonds. Such hybrids are probably formed during normal post-translational processing of both receptors (LeRoith et al., 1995) and are widely expressed in normal tissues and often aberrantly expressed in cancer cells (Pandini et al., 2002). Since both IR isoforms and IGF-IRs are endogenously expressed in our cell lines, at least three hybrids may be formed: IR-A/IR-B, IR-A/IGF-IR and IR-B/IGF-IR which could influence our findings. However, our cell lines have very low endogenous levels of both IR-isoforms and the IGF-IRs compared to the transfected IR-isoform. The endogenous IRs and IGF-IRs are most probably out-competed in our IR KIRA assays following the high expression levels of the exogenous IRs achieved by transfection. In addition, although the precise biological role of the hybrids is still unclear, functional studies have demonstrated that IR/IGF-IR hybrids behave more like IGF-IRs than IRs (Belfiore et al., 2009). So, although hybrid receptors may well play an important role in vivo, their relative contribution to the endpoint signal of both KIRA assays is assumed to be low but cannot be completely excluded.
Moreover, the IRs have up to six key tyrosine residues and the antibody used in our study to detect the tyrosine residues may not necessarily recognize all residues with the same affinity. As the distinct roles of the different tyrosine residues remain to be clarified, this aspect may be of importance.
In conclusion, serum IGF-I and IGF-II may substantially contribute to IR signalling. Since IR isoform specific KIRA assays, in sharp contrast to insulin immunoassays, take into account the contribution of the IGFs on IR signalling they may help to gain more insight into the roles of IGF mediated IR-A and IR-B activation in health and disease.
Acknowledgements
The authors are grateful to Prof. A. Ullrich, Max-Planck-Institut für Biochemie, Martinsried, Germany for kindly providing the plasmids containing a cDNA insert of the human IR-A or IR-B. Also they would like to thank Dr. J. van Doorn, Department of Metabolic Diseases University Medical Center Utrecht, for measuring IGFBP-1 and IGF-II concentrations in serum samples.
This research was [in part] supported by the Intramural Research Program of the NIH, National Cancer Institute, Center for Cancer Research. Part of this study was presented as a poster at the Annual Endocrine Society meeting in June 2010, San Diego, USA.
Footnotes
Disclosures
All authors have nothing to disclose.
References
- Belfiore A, Frasca F, Pandini G, Sciacca L, Vigneri R, 2009. Insulin receptor isoforms and insulin receptor/insulin-like growth factor receptor hybrids in physiology and disease. Endocr. Rev 30, 586–623. [DOI] [PubMed] [Google Scholar]
- Blakesley VA, Scrimgeour A, Esposito D, Le Roith D, 1996. Signaling via the insulin-like growth factor-I receptor: does it differ from insulin receptor signaling? Cytokine Growth Factor Rev. 7,153–159. [DOI] [PubMed] [Google Scholar]
- Blumenthal S, 2009. The insulin immunoassay after 50 years: a reassessment. Perspect. Biol. Med 52, 343–354. [DOI] [PubMed] [Google Scholar]
- Boucher J, Tseng YH, Kahn CR, 2010. Insulin and insulin-like growth factor-1 receptors act as ligand-specific amplitude modulators of a common pathway regulating gene transcription. J. Biol. Chem 285,17235–17245. [DOI] [PMC free article] [PubMed] [Google Scholar]
- Brugts MP, Ranke MB, Hofland LJ, van der Wansem K, Weber K, Frystyk J, Lamberts SW, Janssen JA, 2008. Normal values of circulating insulin-like growth factor-I bioactivity in the healthy population: comparison with five widely used IGF-I immunoassays. J. Clin. Endocrinol. Metab 93, 2539–2545. [DOI] [PubMed] [Google Scholar]
- Chen JW, Ledet T, Orskov H, Jessen N, Lund S, Whittaker J, De Meyts P, Larsen MB, Christiansen JS, Frystyk J, 2003. A highly sensitive and specific assay for determination of IGF-I bioactivity in human serum. Am. J. Physiol. Endocrinol. Metab 284, E1149–E1155. [DOI] [PubMed] [Google Scholar]
- Denley A, Bonython ER, Booker GW, Cosgrove LJ, Forbes BE, Ward CW, Wallace JC, 2004. Structural determinants for high-affinity binding of insulin-like growth factor II to insulin receptor (IR)-A, the exon 11 minus isoform of the IR. Mol. Endocrinol 18, 2502–2512. [DOI] [PubMed] [Google Scholar]
- Feng Y, Zhu Z, Xiao X, Choudhry V, Barrett JC, Dimitrov DS, 2006. Novel human monoclonal antibodies to insulin-like growth factor (IGF)-II that potently inhibit the IGF receptor type I signal transduction function. Mol. Cancer Ther 5,114–120. [DOI] [PubMed] [Google Scholar]
- Frasca F, Pandini G, Scalia P, Sciacca L, Mineo R, Costantino A, Goldfine ID, Belfiore A, Vigneri R, 1999. Insulin receptor isoform A, a newly recognized, high-affinity insulin-like growth factor II receptor in fetal and cancer cells. Mol. Cell. Biol 19, 3278–3288. [DOI] [PMC free article] [PubMed] [Google Scholar]
- Froesch ER, Buergi H, Ramseier EB, Bally P, Labhart A, 1963. Antibody-suppressible and nonsuppressible insulin-like activities in human serum and their physiologic significance. An insulin assay with adipose tissue of increased precision and specificity. J. Clin. Invest 42,1816–1834. [DOI] [PMC free article] [PubMed] [Google Scholar]
- Froesch ER, Schmid C, Schwander J, Zapf J, 1985. Actions of insulin-like growth factors. Annu. Rev. Physiol 47, 443–467. [DOI] [PubMed] [Google Scholar]
- LeRoith D, Adamo M, Werner H, Roberts CT Jr., 1995. Molecular and cellular biology of the insulin-like growth factors In: Weintraub B. (Ed.), Molecular Endocrinology: Basic Concepts and Clinical Correlations. Raven; Press, NY, New York, pp. 181–193. [Google Scholar]
- Moller DE, Yokota A, Caro JF, Flier JS, 1989. Tissue-specific expression of two alternatively spliced insulin receptor mRNAs in man. Mol. Endocrinol 3, 1263–1269. [DOI] [PubMed] [Google Scholar]
- Morcavallo A, Gaspari M, Pandini G, Palummo A, Cuda G, Larsen MR, Vigneri R, Belfiore A, 2011. Research resource: new and diverse substrates for the insulin receptor isoform A revealed by quantitative proteomics after stimulation with IGF-II or insulin. Mol. Endocrinol 25, 1456–1468. [DOI] [PMC free article] [PubMed] [Google Scholar]
- Mosthaf L, Grako K, Dull TJ, Coussens L, Ullrich A, McClain DA, 1990. Functionally distinct insulin receptors generated by tissue-specific alternative splicing. EMBO J. 9, 2409–2413. [DOI] [PMC free article] [PubMed] [Google Scholar]
- Okada Y, Yokono K, Katsuta A, Yoshida M, Morita S, Irino H, Goto T, Baba S, Roth RA, Shii K, 1998. Development of an assay for bioactive insulin. Anal. Biochem 257, 134–138. [DOI] [PubMed] [Google Scholar]
- Pandini G, Frasca F, Mineo R, Sciacca L, Vigneri R, Belfiore A, 2002. Insulin/ insulin-like growth factor I hybrid receptors have different biological characteristics depending on the insulin receptor isoform involved. J. Biol. Chem 277, 39684–39695. [DOI] [PubMed] [Google Scholar]
- Pfaffl MW, 2001. A new mathematical model for relative quantification in realtime RT-PCR. Nucleic Acids Res. 29, e45. [DOI] [PMC free article] [PubMed] [Google Scholar]
- Rasmussen R, 2001. Quantification on the LightCycler In: Meuer S, Wittwer C, Nagakawara K. (Eds.), Rapid Cycle Real-Time PCR, Methods and Application. Springer Press, Heidelberg, pp. 21–34. [Google Scholar]
- Schmittgen TD, Livak KJ, 2008. Analyzing real-time PCR data by the comparative C(T) method. Nat. Protoc 3, 1101–1108. [DOI] [PubMed] [Google Scholar]
- Twigg SM, Baxter RC, 1998. Insulin-like growth factor (IGF)-binding protein 5 forms an alternative ternary complex with IGFs and the acid-labile subunit. J. Biol. Chem 273, 6074–6079. [DOI] [PubMed] [Google Scholar]
- van Koetsveld PM, Vitale G, de Herder WW, Feelders RA, van der Wansem K, Waaijers M, van Eijck CH, Speel EJ, Croze E, van der Lely AJ, Lamberts SW, Hofland LJ, 2006. Potent inhibitory effects of type I interferons on human adrenocortical carcinoma cell growth. J. Clin. Endocrinol. Metab 91, 4537–4543. [DOI] [PubMed] [Google Scholar]
- Vitale G, van Koetsveld PM, de Herder WW, van der Wansem K, Janssen JA, Colao A, Lombardi G, Lamberts SW, Hofland LJ, 2009. Effects of type I interferons on IGF-mediated autocrine/paracrine growth of human neuroendocrine tumor cells. Am. J. Physiol. Endocrinol. Metab 296, E559–E566. [DOI] [PubMed] [Google Scholar]
- Weeke J, Orskov H, 1975. Ultrasensitive radioimmunoassay for direct determination of free triiodothyronine concentration in serum. Scand. J. Clin. Lab. Invest 35, 237–244. [PubMed] [Google Scholar]
- Yalow RS, Berson SA, 1960. Immunoassay of endogenous plasma insulin in man. J. Clin. Invest 39, 1157–1175. [DOI] [PMC free article] [PubMed] [Google Scholar]