Abstract
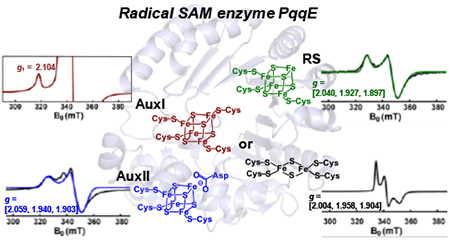
Pyrroloquinoline quinone (PQQ) is an important redox active quinocofactor produced by a wide variety of bacteria. A key step in PQQ biosynthesis is a carbon-carbon crosslink reaction between glutamate and tyrosine side chains within the ribosomally-synthesized peptide substrate PqqA. This reaction is catalyzed by the radical SAM enzyme PqqE. Previous X-ray crystallographic and spectroscopic studies suggested that PqqE, like the other members of the SPASM domain family, contains two auxiliary Fe–S clusters (AuxI and AuxII) in addition to the radical SAM [4Fe–4S] cluster. However, a clear assignment of the EPR signal of each Fe–S cluster was hindered by the isolation of a His6-tagged-PqqE variant with an altered AuxI cluster. In this work, we are able to isolate soluble PqqE variants by using a less-disruptive strep-tactin® chromatographic approach. We have unambiguously identified the EPR signatures for four forms of Fe–S clusters present in PqqE through the use of multi-frequency EPR spectroscopy: the RS [4Fe–4S] cluster, the AuxII [4Fe–4S] cluster, and two different clusters ([4Fe–4S] or [2Fe–2S]) bound in the AuxI site. The RS [4Fe–4S] cluster, the AuxII [4Fe–4S] cluster and the [2Fe–2S] cluster form in the AuxI site, can all be reduced by sodium dithionite, with g tensors of their reduced form determined as [2.040, 1.927, 1.897], [2.059, 1.940, 1.903] and [2.004, 1.958, 1.904], respectively. The AuxI [4Fe–4S] cluster that is determined based on its relaxation profile can only be reduced by using low-potential reductants such as Ti(III) citrate or Eu(II)-DTPA to give rise to a g1 = 2.104 signal. Identification of the EPR signature for each cluster paves the way for further investigations of SPASM domain radical SAM enzymes.
Keywords: Pyrroloquinoline Quinone PQQ Biosynthesis, SPASM-Domain Enzyme, Radical SAM Enzyme PqqE, Ribosomally-synthesized and Post-translationally-modified Peptide RiPP PqqA, Carbon-Carbon Crosslink reaction
Graphical Abstract
1. INTRODUCTION
Pyrroloquinoline quinone (PQQ) was initially identified as a redox cofactor for prokaryotic dehydrogenases, such as alcohol and sugar dehydrogenases, and plays an important role in bacterial metabolism of alcohols and sugars.1–4 Recently, PQQ has also been recognized as an important nutrient for higher organisms (plants and animals), providing benefits for their growth and oxidative-stress tolerance.5,6 In particular, PQQ has been shown to be beneficial to human health, especially in anti-diabetic, anti-oxidative and neuroprotective actions.6 Higher organisms are not known to synthesize PQQ and therefore rely fully on bacteria to provide this important nutrient.
The biosynthesis of PQQ is accomplished by the gene products of pqqABCDEFG.7–9 PqqA is a short peptide and is translated by the ribosome and later modified by a series of enzymes encoded by other pqq genes, placing it into the family of ribosomally-synthesized and post-translationally-modified peptides (known as RiPPs). The biosynthesis of PQQ begins with a carbon-carbon crosslink reaction between glutamate and tyrosine side chains within PqqA. This reaction (Figure 1) is catalyzed by the radical S-adenosyl-L-methionine (SAM) enzyme PqqE and employs a chaperone protein PqqD to deliver the peptide substrate PqqA to PqqE.8
Figure 1.
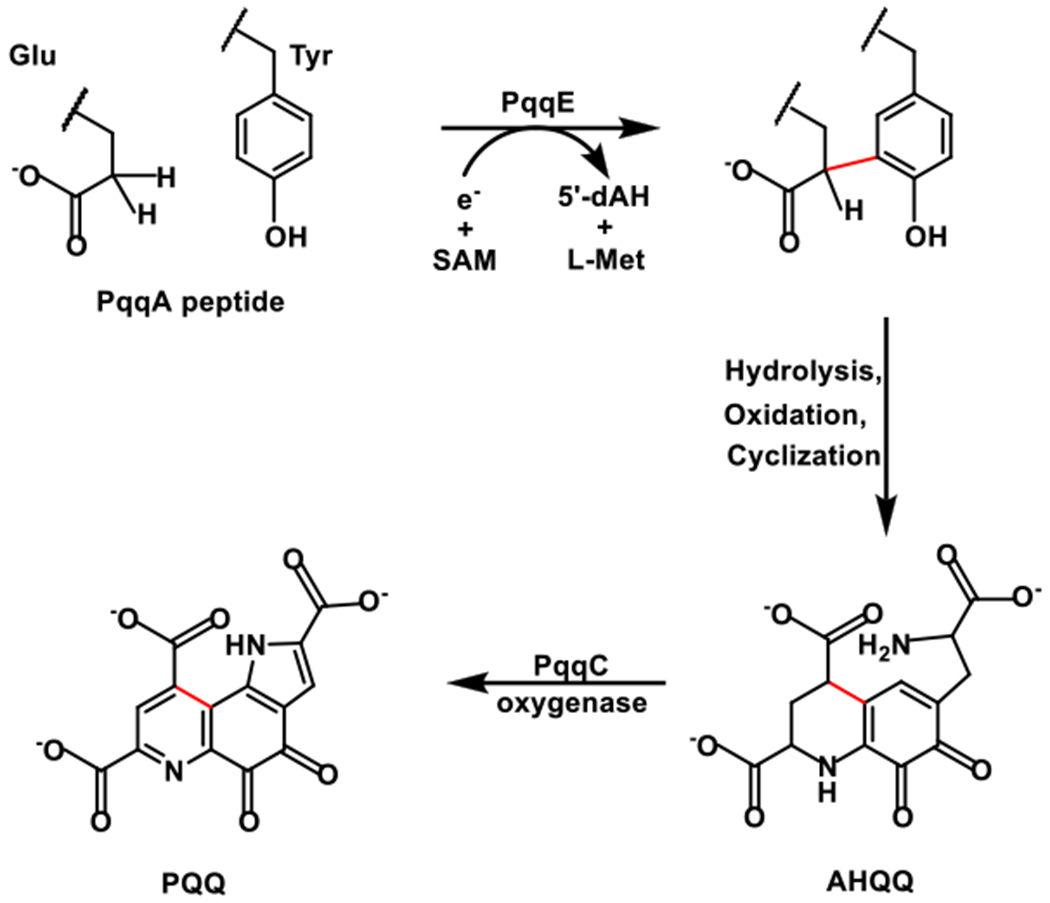
Proposed PQQ biosynthesis pathway, with the carbon–carbon bond formation between glutamate and tyrosine side chains within the peptide PqqA shown in the scheme.
The radical SAM enzyme PqqE contains a canonical CX3CX2C motif10 which provides three cysteine (Cys) residues to ligate a radical SAM (RS) [4Fe–4S] cluster, leaving a site for SAM binding at the fourth site-differentiated Fe.8,11 This RS cluster is responsible for generating a 5’-deoxyadenosine radical (5’-dA•) via the reductive cleavage of SAM; the 5’-dA• radical then initiates the radical chemistry by abstracting a hydrogen atom from the substrate.10 In addition to the N-terminal RS cluster, PqqE is reported to harbor two auxiliary Fe–S clusters (AuxI and AuxII) located in the C-terminal SPASM domain.11,12 The origin of the acronym SPASM comes from the founding enzyme members,12 i.e., AlbA,13,14 PqqE,11,15 anSMEs,16–19 and MftC,20,21 which are involved in the formation of subtilosin A and PQQ as well as the maturation of anaerobic sulfatase and mycofactocin. More recently, an increasing number of new SPASM-domain containing enzymes have been reported and studied in the biosynthesis of RiPPs natural products, such as CteB,22 Tte1186,23 NxxcB24 and HuaB25; these are responsible for sulfur-carbon cross-linkage to form a thioether bond, as well as StrB,26 SuiB,27 AgaB28,29 and WgkB30 that catalyze carbon-carbon cross-linkage between lysine and tryptophan side chains, along the lines of PqqE.
In addition to the RS cluster, SPASM-domain containing enzymes bind two auxiliary Fe–S clusters in their C-terminal domains through the presence of extra Fe–S cluster binding motifs.12 X-ray crystal structures of a number of enzymes in this superfamily, i.e., anSME,18 SuiB27 and CteB,22 show three Fe–S clusters that are all [4Fe–4S] clusters. As will be discussed in detail below, PqqE is an exception, showing a [2Fe–2S] cluster in the AuxI site.11 Electron paramagnetic resonance (EPR) spectroscopy, which is widely employed to study Fe–S cluster-containing enzymes and reaction intermediates, is challenged in investigating the three Fe–S clusters in SPASM-domain containing RS enzymes because of overlap of the EPR signals and possible inter-cluster dipolar interactions. Furthermore, instability of prepared mutant samples designed to knock out one or two clusters can hinder the reliability of Fe–S cluster EPR signal analyses.11
Previous investigations of PqqE from Methylorubrum extorquens (M extorquens) provide a good example.11,31,32 Our earlier X-ray crystallographic report showed that the AuxI cluster is a [2Fe–2S] cluster ligated by four cysteine residues (Cys248, Cys268, Cys323, Cys325) and the AuxII cluster is a [4Fe–4S] cluster that is ligated by three cysteine residues (Cys310, Cys313, Cys341) and one aspartate residue (Asp319).11 However, the RS cluster was missing in the structure, and difficulties in obtaining high quality crystals of this enzyme have limited further understanding of both the number and the type of Fe–S clusters in PqqE. Associated EPR spectroscopic studies using wild-type, an RS cluster knockout variant (AuxI/AuxII, see nomenclature in Table 1) and an AuxII cluster knockout variant (RS/AuxT) suggested a mixture of [2Fe–2S] and [4Fe–4S] clusters for the auxiliary clusters. However, we were previously not able to isolate a PqqE variant lacking the AuxI cluster (RS/AuxII), making it difficult to fully assign observed complicated EPR signals or extract a unique g tensor for each cluster. In this prior work, we used Ni-NTA affinity chromatography to isolate both wild-type and PqqE variants containing a hexahistidine (His6) tag, followed by Fe–S cluster reconstitution. However, several desalting steps may disturb the Fe–S clusters.33,34 To mitigate this issue, we now employ a less-disruptive chromatography, i.e., the strep-tactin® approach,33,34 to purify the full range of PqqE variants. This change is in part inspired by our work on the RS enzyme HydG, in which the unique dangler Fe site of the auxiliary [5Fe–4S] cluster is found to be better retained using the strep-tactin® approach as opposed to metal-affinity chromatography.33,34
Table 1.
Nomenclature of PqqE variants studied in this work.
| nomenclature | description | replaced residues | nomenclature in previous publication11 |
|---|---|---|---|
| RS only | RS-only with AuxI/AuxII double knockout | C310A/C313A/C323A/C325A | +RS |
| AuxI/AuxII | RS knockout | C28A/C32A/C35A | −RS |
| AuxI/AuxII/D319H | D319H with RS knockout | C28A/C32A/C35A/D319H | - |
| AuxI/AuxII/D319C | D319C with RS knockout | C28A/C32A/C35A/D319C | - |
| RS/AuxI | AuxII knockout | C310A/C313A | −AuxII |
| RS/AuxII | AuxI knockout | C248A/C268A | −AuxI |
Here we report the use of multi-frequency EPR spectroscopy in identifying and characterizing the EPR signatures for four forms of Fe–S clusters present in PqqE enzyme: the RS [4Fe–4S] cluster, the AuxII [4Fe–4S] cluster, and two different clusters ([4Fe–4S] or [2Fe–2S]) bound in the AuxI site. The RS [4Fe–4S] cluster, the AuxII [4Fe–4S] cluster and the [2Fe–2S] cluster form in the AuxI site, can all be reduced by sodium dithionite, revealing the corresponding EPR signals of their reduced forms. However, the AuxI [4Fe–4S] cluster can only be reduced by lower potential reductants, such as Ti(III) citrate or Eu(II)-DTPA. The identification and analysis of the EPR signature for all of the possible clusters within PqqE is an important advance to the EPR characterization of RS proteins, as well as to ongoing efforts to obtain detailed mechanistic understanding of members of the roles of auxiliary sites in SPASM-domain RS enzymes.
2. MATERIALS AND METHODS
2.1. Plasmids and nomenclature.
The plasmid used in this wok for expressing wild-type PqqE is an N-terminal strep-tag II containing pET-28a vector with a M. extorquens pqqE insert (UniProt number P71517). The PqqE variants used in this work are listed in Table 1. They were generated using Quick-change method, and the primers are listed in Table SI. In order to clarify the clusters in each variant, we denoted each variant using the cluster that presents in the protein sample rather than using the one being knocked out (see Table 1).
2.2. PqqE expression and purification.
The His6-tagged wild-type PqqE was expressed as described previously.35 The strep-tagged wild-type PqqE and its variants were expressed aerobically in an E. coli BL21(DE3) GOLD strain that harbors both an N-terminal strep-tag II containing pET-28a plasmid with a pqqE insert and the suf operon plasmid pPH151. The cells were grown at 31 °C in Terrific Broth (TB) media containing 50 μg/ml of kanamycin, 50 μg/ml of chloramphenicol, 200 μM ammonium ferric citrate and 500 μM MgSO4 to an O.D.600 ≈ 0.6. Then the temperature was decreased to 18 °C; after 1 hour, protein expression was initiated by adding isopropyl β-D-1-thiogalactopyranoside (IPTG) to a final concentration of 100 μM and cysteine to a concentration of 100 μM. After expression at 18 °C for around 18 hours, the cells were harvested by centrifugation (3,500 rpm at 4 °C for 30 min), flash frozen in liquid nitrogen, and stored in −80 °C.
The His6-tagged wild-type PqqE was purified as described previously.35 The strep-tagged PqqE was purified anaerobically using a standard manufactory protocol (Germantown, MD) with modifications. The harvested cells were transferred to an anaerobic chamber and suspended in a deoxygenated lysis buffer with the volume ca. five times the mass of cell pastes. The lysis buffer was a HEPES-buffered solution (buffer W, 50 mM HEPES, 150 mM KCl, pH = 7.9) supplemented with BugBuster (Novagen), Benzonase (Novagen) and lysozyme (Novagen). The lysate was then transferred to O-ring sealed tubes and centrifuged at 20,000 rpm for 30 min. The sealed tubes that contained clarified lysate were transferred to the anaerobic chamber. The supernatant was loaded onto the Strep-tactin Superflow Plus resin (QIAGEN, Germantown, MD) with a column volume of 10 mL. The unbound protein fraction was removed by gravity-flowing through the resin and the resin was washed with 2 column volumes of buffer W. The PqqE protein fraction was then eluted by adding buffer W containing 3 mM d-Desthiobiotin, The eluted PqqE protein fraction was gently concentrated by using 30 kDa cutoff Amicon centrifugal filters at 6,000 rpm for 15 min. We used the fresh prepared protein (without freezing) to prepare all the EPR samples in these studies.
The Strep-tactin Superflow Plus resin was regenerated by using 5 column volumes of buffer W supplemented with 1 mM 2-(4-hydroxyphenylazo)benzoic acid and washed with 5 column volumes of buffer W. The concentration of the protein and the Fe content was determined using the method published previously.35
For the sample of globally-15N-labled D319H, the protein was expressed in 4 L M9 minimal medium supplemented with 4 g 15NH4Cl and 4 g ISOGRO®-15N medium powder. Instead of using the overnight cell culture to inoculate the M9 minimal media directly, 40 mL overnight cell culture was centrifuged, and washed using autoclaved deionized water first. Then the washed cell that was re-suspended in autoclaved deionized water was used for inoculating the media for expression. 200 μM ferreic chloride was added as extra iron source to replace the ammonium ferric citrate. The other expression and purification procedures were same as the natural abundance PqqE protein.
2.3. EPR spectroscopy and analysis.
2.3.1. EPR sample preparation.
We used the fresh prepared protein to prepare all the EPR samples in these studies. For dithionate-reduced samples, ≈20 equivalents of sodium dithionate was added to PqqE protein in an X-band or Q-band EPR tube and allowed to incubate for 10 min. Then the EPR samples were transferred outside the anaerobic chamber, and frozen in liquid nitrogen for EPR spectroscopic analysis.
For cyanide-treated samples, ≈100 equivalents of isotope-labeled K13C15N (Cambridge Isotope Laboratories, Inc) was added to PqqE variant (RS only or AuxI/AuxII) which has already pre-incubated with ≈20 equivalents of sodium dithionate in an X-band or Q-band EPR tube. The samples were then transferred outside the anaerobic chamber, quickly frozen in liquid nitrogen and analyzed by using EPR spectroscopy.
For Ti(III) citrate-reduced samples,36 fresh Ti(III) citrate (89.7 mM) was prepared by adding 50 μL of a 15% TiCl3 solution to a 500 μL of 0.2 M sodium citrate solution and neutralized with 100 μL saturated sodium carbonate solution. Then ≈45 equivalents of Ti(III) citrate was added to PqqE protein and allowed to incubate for 1 hour. The EPR samples were then transferred outside the anaerobic chamber, quickly frozen in liquid nitrogen and analyzed by using EPR spectroscopy.
For Eu(II)-DTPA-reduced samples, fresh Eu(II)-DTPA was prepared by anaerobically adding one equivalent Eu(II)Cb powder to Tris-buffered solution (100 mM Tris, pH = 8.0) of DTPA (diethylenetriaminepentaacetic acid).37,38 Then ≈30 equivalents of Eu(II)-DTPA was added to PqqE protein and allowed to incubate for ~30 min. The EPR samples were then transferred outside the anaerobic chamber, quickly frozen in liquid nitrogen and analyzed by using EPR spectroscopy.
2.3.2. X-band CW EPR spectroscopy.
X-band (9.37 GHz) continuous-wave (CW) EPR spectra were recorded on a Bruker (Billerica, MA) EleXsys E500 spectrometer equipped with a super-high Q resonator (ER4122SHQE). Cryogenic temperatures were achieved and controlled using an ESR900 liquid helium cryostat in conjunction with a temperature controller (Oxford Instruments ITC503) and a gas flow controller. CW EPR data were collected under slow-passage conditions. The spectrometer settings were as follows: conversion time = 40 ms, modulation amplitude = 0.5 mT, and modulation frequency = 100 kHz; other settings are given in the corresponding figure captions. Spin quantification was determined by comparison of the double integral intensity of the EPR spectra to that of a standard solution of 100 μM CuSO4 with 200 μM HC1, 200 mM NaClO4 and 20% ethylene glycol. Simulations of the CW spectra and the following pulsed EPR spectra were performed using the EasySpin 5.1.10 toolbox39,40 within the Matlab 2014a software suite (The Mathworks Inc., Natick, MA). Euler angles follow the zyz convention.
2.3.3. Q-band EPR spectroscopy.
Q-band two pulse electron spin-echo (ESE)-detected field swept EPR spectra (π/2-τ-π-τ-echo) were collected using a Bruker (Billerica, MA) EleXsys E-580 spectrometer equipped with a 10 W amplifier and a R.A. Isaacson-built cylindrical TE011 resonator mounted in an Oxford CF935 cryostat. Pulse sequences were programmed with the PulseSPEL programmer via the XEPR interface. Experiment parameters were as follows: π/2 = 12 ns, τ = 300 ns, and other settings are given in the corresponding figure captions. The Q-band spectra presented in this work are pseudo-modulated spectra using a modulation amplitude of 3.0 mT.
2.3.4. X-band and Q-band HYSCORE.
Hyperfine sublevel correlation spectroscopy (HYSCORE) is a two-dimensional pulse EPR technique, which correlates nuclear spin-flip transition frequencies in one electron-spin manifold to those in another electron-spin manifold. HYSCORE spectra were recorded at 10 K on the Bruker Biospin EleXsys 580 spectrometer by employing a split-ring (MS5) resonator for X-band and the Isaacson cylindrical TE011 resonator for Q-band. The pulse sequence π/2-τ-π/2-t1-π-t2-π/2-τ-echo was programmed with the PulseSPEL programmer via the XEPR interface. The pulse length for inversion pulse (tπ) and the π/2 pulse (tπ/2) was 24 ns. Eight-step phase cycling was used. Time-domain spectra were baseline-corrected (third-order polynomial), apodized with a hamming window, zero-filled to eight-fold points, and fast Fourier-transformed to yield the frequency-domain spectra. Particular spectrometer settings are given in the corresponding figure captions.
3. RESULTS AND DISCUSSION
Our previous studies supported the view that PqqE enzyme requires all three Fe–S clusters (RS, AuxII and AuxI clusters) to yield the carbon-carbon crosslink activity. Our goal in this work is to identify the EPR signature for each cluster by characterizing various mutant samples (as listed in Tables 1&2) via multi-frequency EPR spectroscopy, as a critical step towards understanding the role each cluster plays in PqqE catalysis. We employed the non-disruptive strep-tactin® approach33,34 to purify all enzyme samples. Also, in order to minimize any potential degradation at the Fe–S clusters in WT and protein variants, all EPR samples were “as-eluted PqqE” that had avoided purification steps capable of damaging the protein such as harsh centrifugation (> 6,000 rpm) or freeze-thaw cycles (see Materials and Methods for details). Figure 2 shows the CW EPR spectrum of the as-eluted wild-type strep-tagged PqqE reduced by dithionite, indicating in this case an EPR spectrum very similar to previously reported EPR data for His6-tagged PqqE. In what follows, we disentangle the EPR spectrum of dithionite-reduced wild-type PqqE—identifying which signal arises from each Fe–S cluster (section 3.1, 3.2 and 3.4). In addition, in section 3.3, a low-potential [4Fe–4S] cluster is observed by using low-potential reductants (Ti(III) citrate or Eu(II)-DTPA), and we discuss these properties in the context of potential mechanisms for carbon-carbon crosslink catalysis (section 3.5).
Table 2.
Summary of g-values of varying Fe–S cluster species identified in this work.
| Fe–S cluster | g-values | PqqE samplea | Reductant |
|---|---|---|---|
| [4Fe–4S]RS | [2.040, 1.927, 1.897] | RS only | dithionite |
| CN-bound [4Fc–4S]RS | [2.063, 1.957, 1.913] | RS only + K13C15N | dithionite |
| [4Fe–4S]AuxII | [2.059, 1.940, 1.903] | AuxI/AuxII | dithionite |
| CN-bound [4Fe–4S]AuxII | [2.087, 1.955, 1.941] | AuxI/AuxII + K13C15N | dithionite |
| [4Fe–4S]AuxII with H319 | [2.046, 1.935, 1.922] | AuxI/AuxII/D319H | dithionite |
| [4Fe–4S]AuxII with C319 | [2.042, 1.938, 1.917] | AuxI/AuxII/D319C | dithionite |
| [2Fe–2S]AuxI | [2.004, 1.958, 1.904] | WT, RS/AuxI | dithionite |
| [4Fe–4S]AuxI | g1 = 2.104 | WT, AuxI/AuxII, and RS/AuxI | Ti(III) citrate or Eu(II)-DTPA |
The sample we employed to identify the corresponding cluster signal.
Figure 2.
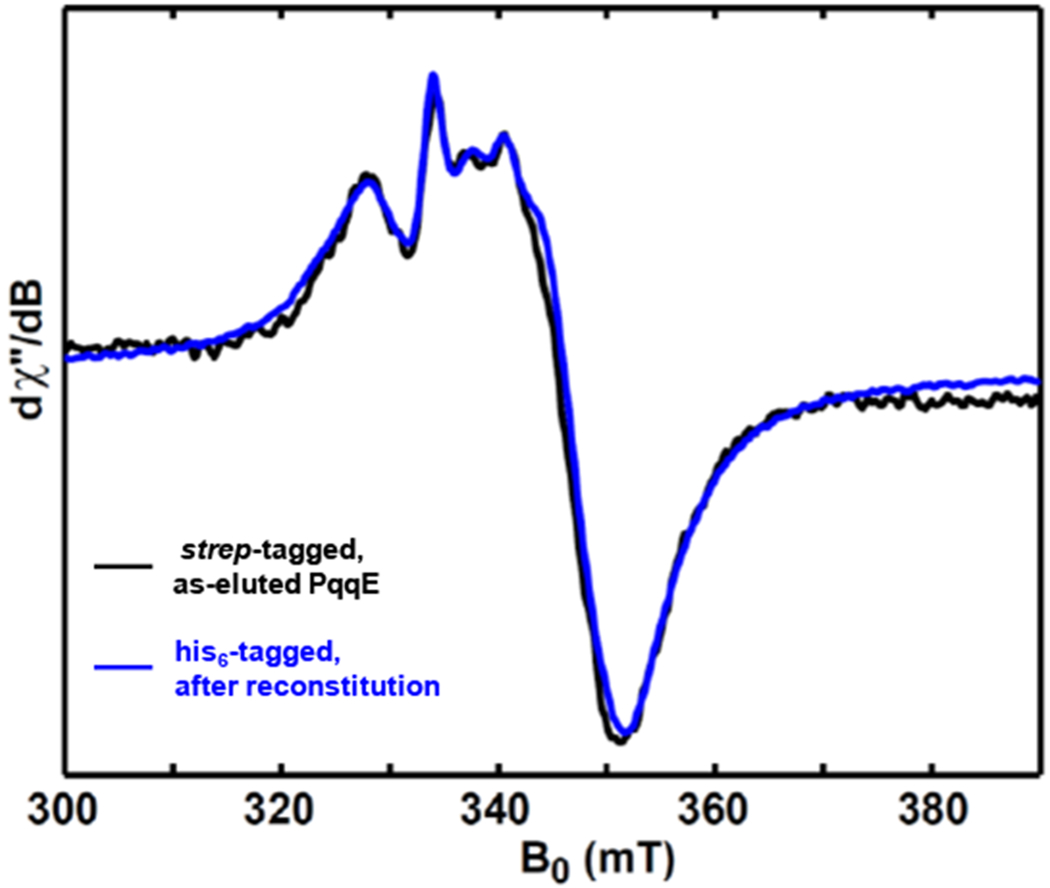
Comparison of X-band (9.37 GHz) CW EPR spectra of dithionite-reduced as-eluted strep-tagged wild-type PqqE (black trace) and the reconstituted His6-tagged wild-type PqqE (blue trace). The CW EPR spectra were recorded at 10 K, with 0.02 mW microwave power (shown to be non-saturating).
3.1. Characterization of the Radical SAM (RS) [4Fe–4S]RS cluster.
We first prepared a double-knockout variant (termed as RS only) that only contained the cysteine motif C28X3C32X2C35 for binding the RS [4Fe–4S] cluster. For the deletion of auxiliary clusters, two cysteine residues from each auxiliary cluster were mutated to alanine residues (see Table 1 for details). The corresponding X-band (9.37 GHz) and Q-band (33.91 GHz) EPR spectra of this mutant reduced by dithionite are shown in Figures 3A and 3B, respectively. As expected, the EPR spectra show a single paramagnetic component which is well simulated by employing the g-values = [2.040, 1.927, 1.897], typical for a reduced RS [4Fe–4S]+ cluster.10 The observation of one paramagnetic species is reasonable, as this double-knockout variant presumably only contains the remaining RS cluster.
Figure 3.
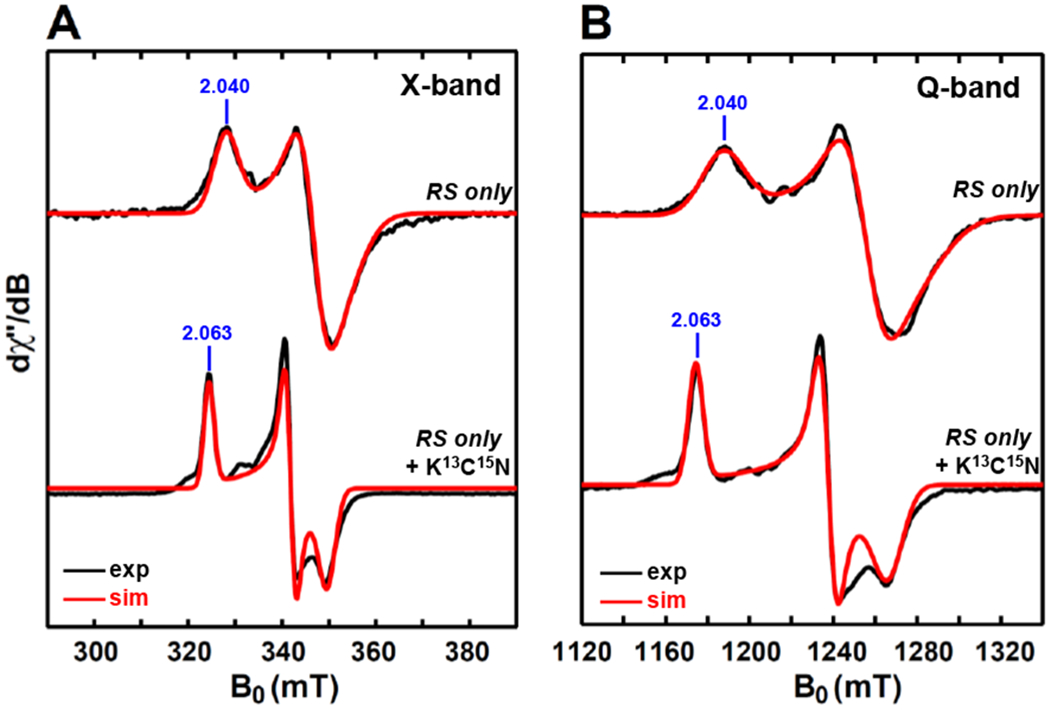
X-band (9.37 GHz) CW EPR (A) and Q-band (34.0 GHz) pseudo-modulated electron spin-echo detected field-swept EPR spectra (B) of the dithionite-reduced double-knockout PqqE variant of RS only as well the results from treatment with ≈100 equivalents of K13C15N. The black traces are experimental spectra, while the red traces are the simulated spectra by employing the g-values = [2.040, 1.927, 1.897] for dithionite-reduced RS-only variant and the g-values = [2.063, 1.957, 1.913] for the sample with the addition of K13C15N. The CW EPR spectra were recorded at 10 K, with 0.02 mW microwave power (shown to be non-saturating).The Q-band EPR spectra were recorded at 10 K by using a two-pulse sequence of π/2-τ-π-τ-echo, with π/2 = 12 ns and τ = 300 ns. The modulation amplitude of 3.0 mT was used to convert the absorption spectra to the pseudo-modulated spectra in (B).
To determine the type of this Fe–S cluster, we probed its spin-relaxation properties by examining the signal intensity as a function of both sample temperature and microwave power. As shown in Figures 4A (blue diamonds) and S1C, when the sample temperature was varied between 10 and 50 K, the EPR signal follows the Curie law—the signal intensity is inversely proportional to the temperature; at high temperatures (> 50 K), the signal relaxes too fast to be observed. This temperature dependence of the EPR signals behaves as a typical reduced [4Fe–4S]+ cluster.41 The power dependence of the EPR signals, as shown in Figures 4B (blue filled diamonds) and S1D, yields a half-saturation power (P1/2) ca. 1.0 mW at 10 K, which is close to the P1/2 value (0.8 mW at 12.5 K) of the reduced [4Fe–4S]+ cluster in B. stearothermophilus ferredoxin.41 Therefore, spin-relaxation properties of this paramagnetic species with g-values = [2.040, 1.927, 1.897] match the properties of a reduced [4Fe–4S]+ cluster.
Figure 4.
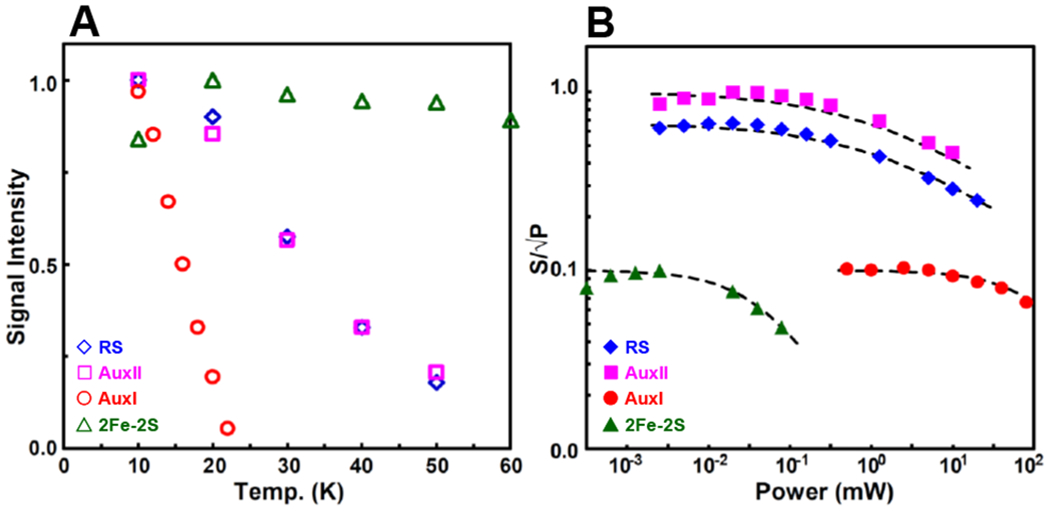
Temperature dependence (A) and power dependence (B) of the EPR signals corresponding to the four Fe–S clusters that are investigated in this work.
For the temperature dependence (A), the RS cluster (blue diamonds) signal intensities are taken from the varying peak amplitudes at the g1 2.040 position in the spectra of dithionite-reduced RS-only variant, shown in Figure S1. The AuxII cluster (magenta squares) signal intensities are taken from the peak amplitudes at the g1 2.059 position in the spectra of dithionite-reduced AuxI/AuxII, shown in Figure S2. The AuxI [4Fe–4S]+ cluster (red circles) signal intensities are taken from the peak amplitudes at the g1 2.104 position in the spectra of Ti(III) citrate-reduced WT sample, shown in Figure S10. The [2Fe–2S]+ cluster (green triangles) signal intensities are taken from the peak amplitudes at the g1 2.004 position in the spectra of dithionite-reduced RS/AuxI, shown in Figure S13.
The power dependence experiment was conducted at 10 K (B). The signal intensity at varying microwave power divided by the square root of the microwave power is plotted vs power. Data points are fit to power saturation curves (dash lines) based on the equation of by using P1/2 = 1.0 mW and b =1.22 for the RS cluster, P1/2 = 1.1 mW and b = 1.22 for the AuxII cluster, P1/2 = 100 mW and b = 1.22 for the AuxI [4Fe–4S]+ cluster and P1/2 = 0.04 mW and b = 1.34 for [2Fe–2S]+ cluster, where P1/2 is the half-saturation power and b is the “inhomogeneity parameter” varying from 1.0 for the inhomogeneous system to 2.0 for the homogeneous system.41
In order to further confirm that this paramagnetic species corresponds to the reduced RS [4Fe–4S]+ cluster, we sought to record an EPR spectrum after adding SAM to the dithionite-reduced RS-only variant to see if we can observe the corresponding SAM-bound [4Fe–4S]+RS signal which has a typical g tensor [2.01, 1.88, 1.85],10 However, this double-knockout sample was unstable and started to precipitate upon the addition of SAM, preventing us from further EPR analysis. Our previous studies suggested that this RS-only variant conserves the activity of uncoupled SAM-cleavage reaction,11 which could also be a reason for our inability to observe the EPR signal of the SAM-bound [4Fe–4S]+RS complex. As an alternate approach, we employed isotope-labeled cyanide (i.e., K13C15N) as a small molecule probe: cyanide has been shown to bind to the unique Fe site of the RS [4Fe–4S]+ cluster, generating an S = 1/2 13C15N-bound [4Fe–4S]+RS species.42 The EPR sample was prepared by adding ≈100 equivalents of K13C15N to the sample of dithionite-reduced RS-only variant and then analyzed by using both X-band (9.37 GHz) and Q-band (33.90 GHz) EPR spectroscopy, with the corresponding spectra presented in Figures 3A and Figure 3B, respectively. As expected, the addition of K13C15N resulted in a complete conversion of the [4Fe–4S]+ cluster signal with g-values = [2.040, 1.927, 1.897] to a new paramagnetic species with a rhombic g tensor of [2.063, 1.957, 1.913]. This g tensor is similar to the g tensor [2.06, 1.95, 1.93] of the CN-bound [4Fe–4S]+RS species observed in RS enzyme HydG (see Table 3),42 consistent with this new rhombic signal being indicative of the 13C15N-bound [4Fe–4S]+RS species in PqqE.
Table 3.
Summary of 13C and 15N hyperfine-values of varying 13C15N-bound [4Fe–4S]+ species.
| Enzyme | CN-bound species | g-values | A(13C) (MHz) | A(15N) (MHz) | Ref. |
|---|---|---|---|---|---|
| PqqE | CN-bound [4Fe–4S]+RS | [2.063, 1.957, 1.913] | [−4.00, −4.70, 1.80] | [2.00, 0.45, 2.60] | this work |
| PqqE | CN-bound [4Fe–4S]+AuxII | [2.087, 1.955, 1.941] | [−4.40, −4.40, 1.00] | [2.10, 2.10, 0.45] | this work |
| HydG | CN-bound [4Fe–4S]+RS | [2.06, 1.95, 1.93] | – | – | 42 |
| HydG | CN-bound [4Fe–4S]+Aux | [2.09, 1.94, 1.93] | [−5.0, −4.7, 0.9] | – | 34 |
| IspH | CN-bound [4Fe–4S]+ | [2.08, 1.94, 1.93] | [−3.9, −3.8, 0.1] | [1.1, 1.1, 2.3] | 43 |
| P. furiosus ferredoxin | CN-bound [4Fe–4S]+ | [2.009, 1.95, 1.92] | [−4.5, −4.5, 0.1] | – | 44 |
Pulse EPR studies confirm this 13C15N-bound [4Fe–4S]+RS species assignment. X-band HYSCORE spectra acquired at multiple magnetic field positions (corresponding to the g-values of 2.060, 1.959 and 1.927, Figure 5A) show obvious two sets of cross-peaks centered at 13C- and 15N-Larmor frequencies, validating the presence of 13C and 15N in the vicinity of the [4Fe–4S]+ cluster. These two sets of cross-peaks are well simulated by using a pseudo-axial hyperfine coupling interaction tensor A for 13C or 15N, with A(13C) = [−4.00, −4.70, 1.80] MHz and A(15N) = [2.00, 0.45, 2.60] MHz, respectively, as shown in Figure 5B. These hyperfine coupling values are comparable to the reported 13C- and 15N-hyperfine values for 13C15N-bound [4Fe–4S]+ clusters (as listed in Table 3) in HydG (A(13C) = [−5.0, −4.7, 0.9] MHz),34 IspH (A(13C) = [−3.9, −3.8, 0.1] MHz and A(15N) = [1.1, 1.1, 2.3] MHz),43 and Pyrococcus furiosus (P. furiosus) ferredoxin (A(13C) = [−4.5, −4.5, 0.1] MHz).44 In the HydG enzyme, in addition to the reported CN-bound [4Fe–4S]+RS species formed in N-terminus (vide supra), cyanide produced from tyrosine is also able to displace the generated [Fedangler(CO)2CN] synthon during HydG reaction by forming an S = 1/2 CN-bound [4Fe–4S]+AUX species in C-terminus.34 The [4Fe–4S] cluster in IspH is ligated by three cysteine residues and thus, has a unique Fe site for cyanide binding to produce a CN-bound [4Fe–4S]+ species described above.43 The [4Fe–4S] cluster in P. furiosus ferredoxin is ligated by three cysteine residues, with the fourth residue as an aspartate (D14) providing a carboxylate ligand, which is able to displaced by CN− to form a CN-bound [4Fe–4S]+ species (vide supra).44
Figure 5.
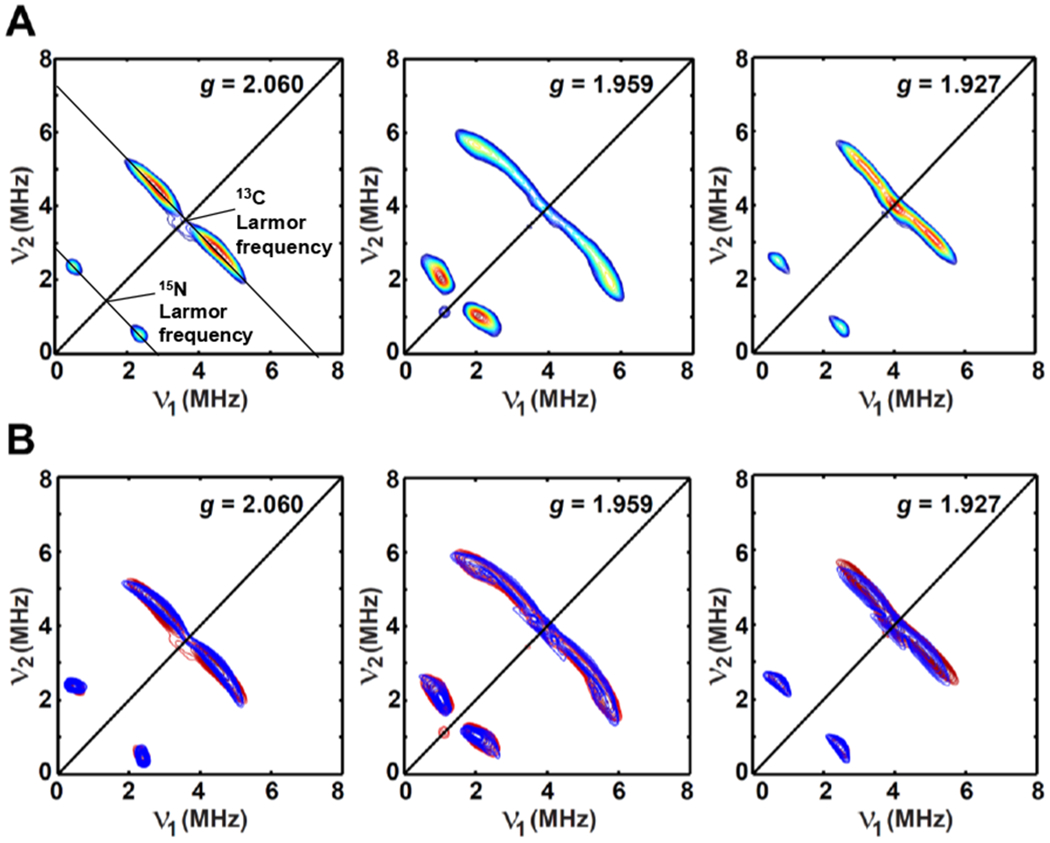
Orientation-selected X-band HYSCORE spectra (A) of dithionite-reduced RS-only variant with the addition of ≈100 equivalents of K13C15N. The corresponding X-band and Q-band EPR spectra of this sample are given in Figure 3. (B) The simulated HYSCORE spectra are shown in blue (contour plot) by using the parameters of g = [2.063, 1.957, 1.913]; A(13C) = [−4.00, −4.70, 1.80] MHz, Euler angle = [0, 35, 0]°; A(15N) = [2.00, 0.45, 2.60] MHz, Euler angle = [0, 30, 0]°, while the experimental spectra are shown in red.
Experimental parameters: temperature = 10 K; tπ/2 = 12 ns; tπ = 24 ns; microwave frequency = 9.188 GHz, magnetic field = 318.7 mT, τ = 148 ns for g = 2.060; microwave frequency = 9.455 GHz, magnetic field = 344.7 mT, τ = 136 ns for g = 1.959; microwave frequency = 9.455 GHz, magnetic field = 350.5 mT, τ = 136 ns for g = 1.927. The time increment in both dimensions was 24 ns with 180 steps.
The observed 13C- and 15N-hyperfine couplings for K13C15N-treated dithionite-reduced RS-only variant confirm the generation of the 13C15N-bound [4Fc–4S]RS+ species with a rhombic g tensor of [2.063, 1.957, 1.913]. These findings provide strong support that the paramagnetic species with the g tensor [2.040, 1.927, 1.897] prior to cyanide addition corresponds to the reduced RS [4Fe–4S]+ cluster with a unique Fe site. Finally, we note that sodium dithionite is able to reduce this RS [4Fe–4S] cluster in PqqE.
3.2. Characterization of the Auxiliary II (AuxII) [4Fe–4S] cluster.
In this section, we prepared a single-knockout PqqE variant (termed AuxI/AuxII), in which the three cysteine residues for the RS cluster were replaced by alanine residues (see Table 1 for details). Therefore, presumably only the clusters in the two auxiliary sites remain for this PqqE variant. The X-band and Q-band EPR spectra of dithionite-reduced AuxI/AuxII are shown in Figure 6A and 6B. The major paramagnetic component (≈ 85% via spin quantification of the total signal is well simulated by using a g tensor of [2.059, 1.940, 1.903]. There is also a minor component (≈ 15% via spin quantification) present in the spectra.
Figure 6.
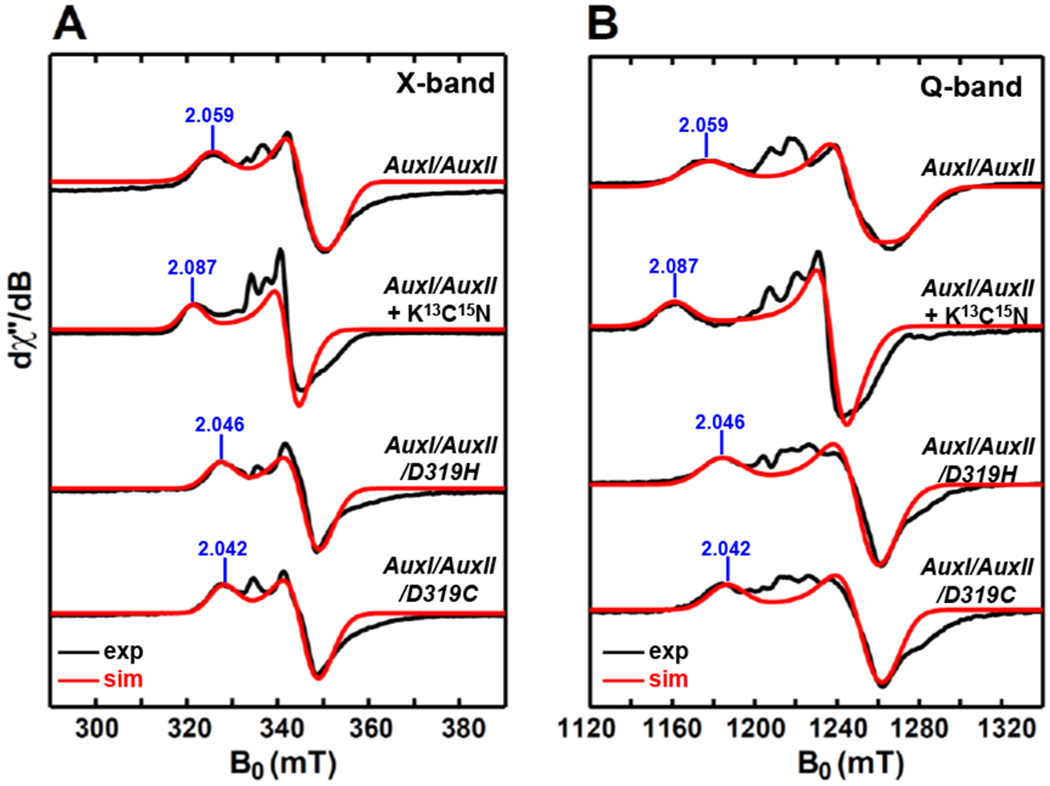
X-band (9.37 GHz) CW EPR (A) and Q-band (34.0 GHz) pseudo-modulated electron spin-echo detected field-swept EPR spectra (B) of dithionite-reduced AuxI/AuxII, the sample with the addition of ≈100 equivalents of K13C15N, as well as dithionite-reduced AuxI/AuxII/D319H and AuxI/AuxII/D319C. The black traces are experimental spectra, while the red traces are the simulated spectra employing the g-values = [2.059, 1.940, 1.903] for dithionite-reduced AuxI/AuxII, the g-values = [2.087, 1.955, 1.941] for the AuxI/AuxII sample with the addition of K13C15N, the g-values = [2.046, 1.935, 1.922] for dithionite-reduced AuxI/AuxII/D319H and the g-values = [2.042, 1.938, 1.917] for dithionite-reduced AuxI/AuxII/D319C, respectively. The spectra for the AuxI/AuxII sample with the addition of K13C15N, as well as AuxI/AuxII/D319H and AuxI/AuxII/D319C are the residual spectra after subtracting the [2Fe–2S] cluster signals from the original spectra that are given in Figures S3&S4. The CW EPR spectra were recorded at 10 K, with 0.02 mW microwave power (no saturation). The Q-band EPR spectra were recorded at 10 K by using a two-pulse sequence of π/2-τ-π-τ-echo. with π/2 = 12 ns and τ = 300 ns. The modulation amplitude of 3.0 mT was used to convert the absorption spectra to the pseudo-modulated spectra in (B).
Spin-relaxation properties of the major component were probed by examining the signal intensity (the peak amplitude at g1 2.059 of the major component) as a function of both sample temperature and microwave power. The temperature dependence of the major-component signals, as shown Figures 4A (magenta squares) and S2C, behaves similarly to that of the [4Fe–4S]+RS cluster (vide supra), i.e., when the sample temperature was varied between 10 and 50 K, the major-component signals follow the Curie law; when the temperature was higher than 50 K, the signal of the major component relaxes too fast to be observed, leaving only the minor-component signal to persist at 60 K (see Figure S2C). The temperature-dependence performance of this minor-component signal is similar as that of the [2Fe–2S]+ cluster with slow-relaxation properties.41 In what follows, we focus on probing the major-component signal and will discuss the [2Fe–2S] cluster-related minor component further in section 3.4. The origin and function of this minor component is of interest, with the caveat that it may have arisen from a degraded Fe–S cluster.45 The power dependence of the major-component signals, presented in Figures 4B (magenta filled squares) and S2D, gives a half-saturation power P1/2 ca. 1.1 mW at 10 K, which is similar to the P1/2 value (1.0 mW at 10 K) of the [4Fe–4S]+RS cluster described above. Therefore, spin-relaxation properties of this major component suggest that it corresponds to a reduced [4Fe–4S]+ cluster. Since both auxiliary clusters are present in the AuxI/AuxII sample, this [4Fe–4S]+ cluster could be either the AuxII cluster, or a possible [4Fe–4S] cluster form in the AuxI site (this is in part inspired by the crystal structures of three other enzymes in the SPASM superfamily, i.e., anSME,18 SuiB27 and CteB,22 which show a [4Fe–4S] cluster in the AuxI site.). Also at this point, we could not rule out the possibility that the major-component signal has contributions from both the reduced [4Fe–4S]+AuxII and the [4Fe–4S]+AuxI cluster, which share the same g tensor and identical spin-relaxation properties.
To address this further we again employed isotope-labeled cyanide (K13C15N), noting that Hoffman et al.44 showed that for the [4Fe–4S] cluster in P. furiosus ferredoxin that is ligated by three cysteine and one aspartate residue (D14), cyanide can displace the carboxylate ligand of the aspartate residue and bind to the Fe site to form an S = 1/2 CN-bound [4Fe–4S]+ species (vide supra). Our previous X-ray structure of PqqE showed that the AuxII [4Fe–4S] cluster is also ligated by three cysteine and one aspartate residue (D319),11 with the binding motif exactly identical to the P. furiosus ferredoxin [4Fe–4S] cluster. Therefore, cyanide should also be able to displace the carboxylate ligand of D319 to form an S = 1/2 CN-bound [4Fe–4S]+AuxII species. In contrast, the AuxI cluster, displayed in the form of a [2Fe–2S] cluster in X-ray structure, was fully ligated by four cysteine residues.11 If a [4Fe–4S] cluster form in the AuxI site exists, it would presumably be fully ligated by the same four cysteine residues that ligate the [2Fe–2S] cluster in the crystal structure. In this case, cyanide-treatment will not alter the [4Fe–4S]+AuxI EPR signal. As shown in Figure 6, by adding ≈100 equivalents of K13C15N to a dithionate-reduced AuxI/AuxII sample, we observed that the major-component signal is completely converted to a new pseudo-axial S = 1/2 signal well simulated with g-values = [2.087, 1.955, 1.941]. The minor component was unaltered by the cyanide treatment (Figure S3). The obtained new g tensor is notably similar to that of CN-bound [4Fe–4S]+Aux in HydG (g-values = [2.09, 1.94, 1.93]) and CN-bound [4Fe–4S]+ in IspH (g-values = [2.08, 1.94, 1.93]), indicating its correspondence to a CN-bound [4Fe–4S]+ species (Table 3). The complete conversion of the reduced [4Fe–4S]+ cluster signal to the CN-bound [4Fe–4S]+ species indicates that the major EPR component corresponds to the reduced [4Fe–4S]+AuxII cluster rather than the [4Fe–4S]+AuxI cluster. Also, the results rule out the possibility that the major-component signal consists of contributions from both of the two auxiliary [4Fe–4S]+ clusters, because if this were the case, we would only be able to see partial signal conversion upon cyanide-treatment.
We further pursued X-band 13C- and 15N-HYSCORE studies to confirm the assignment of the new pseudo-axial signal as the 13C15N-bound [4Fe–4S]+AuxII species. X-band HYSCORE spectra acquired at multiple magnetic field positions (corresponding to the g-values of 2.080, 1.956 and 1.945, Figure 7A) clearly show two sets of cross-peaks centered at 13C- and 15N-Larmor frequencies, supporting the above assignment. These two sets of cross-peaks are well simulated by using a pseudo-axial hyperfine coupling interaction tensor A for 13C or 15N, with A(13C) = [−4.40, −4.40, 1.00] MHz and A(15N) = [2.10, 2.10, 0.45] MHz, respectively, as shown in Figure 7B. These hyperfine coupling values for both 13C and 15N are comparable to the values of those CN-bound [4Fe–4S]+ species described in section 3.1 (Table 3). Therefore, the obtained 13C15N-bound [4Fe–4S]+AuxII species supports the conclusion that the major-component signal observed from dithionate-reduced AuxI/AuxII arises solely from the reduced [4Fe–4S]+AuxII cluster.
Figure 7.
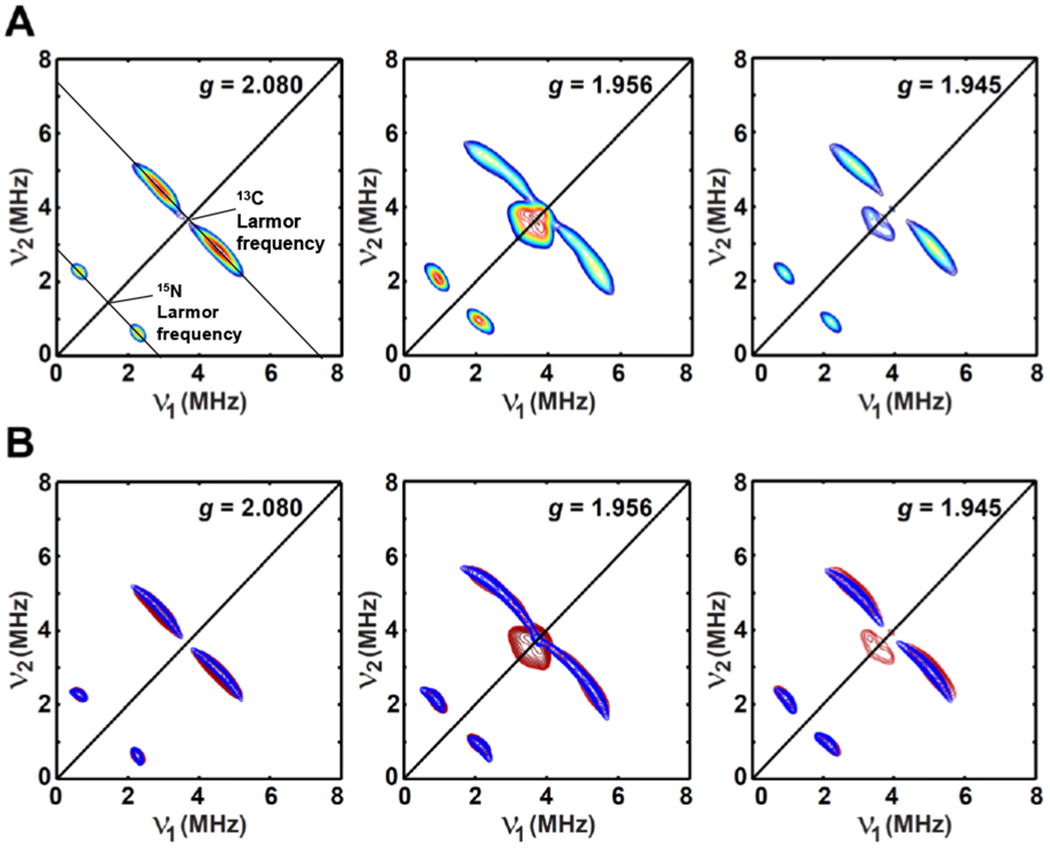
Orientation-selected X-band HYSCORE spectra (A) of dithionite-reduced AuxI/AuxII with the addition of ≈100 equivalents of K13C15N. The corresponding X-band and Q-band EPR spectra are given in Figure 6. (B) The simulated HYSCORE spectra are shown in blue (contour plot) by using the parameters of g = [2.087, 1.955, 1.941]; A(13C) = [−4.40, −4.40, 1.00] MHz, Euler angle = [0, 43, 0]°; A(15N) = [2.10, 2.10, 0.45] MHz, Euler angle = [0, 20, 0]°, while the experimental spectra are shown in red.
Experimental parameters: temperature = 10 K; tπ/2 = 12 ns; tπ = 24 ns; microwave frequency = 9.482 GHz, magnetic field = 325.7 mT, τ = 144 ns for g = 2.080; microwave frequency = 9.308 GHz, magnetic field = 339.9 mT, τ = 136 ns for g = 1.956; microwave frequency = 9.484 GHz, magnetic field = 348.4 mT, τ = 136 ns for g = 1.945. The time increment in both dimensions was 24 ns with 180 steps.
In addition, we performed site-directed mutagenesis on the gene construct of AuxI/AuxII by replacing the aspartate residue (D319) with a histidine or cysteine residue to generate two new variants, i.e., AuxI/AuxII/D319H and AuxI/AuxII/D319C. By probing whether the g tensor of the [4Fe–4S]+AuxII cluster will be affected upon altering the ligand environment, we can further prove that it is the reduced [4Fe–4S]+AuxII cluster that gives rises to the major-component EPR signal. The X-band and Q-band EPR spectra of dithionite-reduced AuxI/AuxII/D319H and AuxI/AuxII/D319C are shown in Figure 6. In the spectrum of each sample, although there is a minor component which is the residual [2Fe–2S] cluster signal after subtraction (see Figure S4 and section 3.4 for details), a major component with the expected g tensor changes is observed, as presented in Figure 6 and listed in Table 2. We note that the g1 feature is shifted from 2.059 for AuxI/AuxII to 2.046 and 2.042 for AuxI/AuxII/D319H and AuxI/AuxII/D319C, respectively, presenting increasingly smaller g-anisotropy as the aspartate D319 residue is mutated to histidine and cysteine. The trend in the g-anisotropy with the more symmetric ligand environment resulting in less g-anisotropy is consistent with the reported g-tensor changes in the P. furiosus ferredoxin [4Fe–4S]+ cluster,46 where the g-values changed from [2.10, 1.87, 1.79] to a less anisotropic tensor [2.08, 1.93, 1.89] as the aspartate D14 residue was mutated to cysteine residue. The sensitivity of the observed g-tensor changes to the ligand environment further confirms the AuxII [4Fe–4S]+ cluster assignment.
Of considerable interest, X-band HYSCORE spectrum of dithionate-reduced AuxI/AuxII/D319H acquired at the magnetic position corresponding to g1 value of 2.046 (Figure 8C) shows the correlation ridges in the (−, +) quadrant that are diagnostic of the presence of hyperfine-coupled 14N nucleus in the vicinity of the reduced [4Fe–4S]+ cluster. This contrasts to the remote 14N couplings from protein backbone nitrogens that usually yield weak 14N-hyperfme coupling HYSCORE signals shown in the (+, +) quadrant. As expected, the 14N-hyperfine coupling signals in the (−, +) quadrant were absent in the HYSCORE spectra of dithionate-reduced AuxI/AuxII or AuxI/AuxII/D319C (Figures 8A and 8B), in which the fourth residue of AuxII [4Fe–4S] cluster is the aspartate (D319) and cysteine, respectively, as depicted in Figure 8. The observation of 14N-hyperfine coupling signals in the (−, +) quadrant suggests that the histidine (H319) coordinates to the [4Fe–4S]AuxII cluster, which also supports our assignment of the reduced [4Fe–4S]+AuxII cluster (vide supra).
Figure 8.
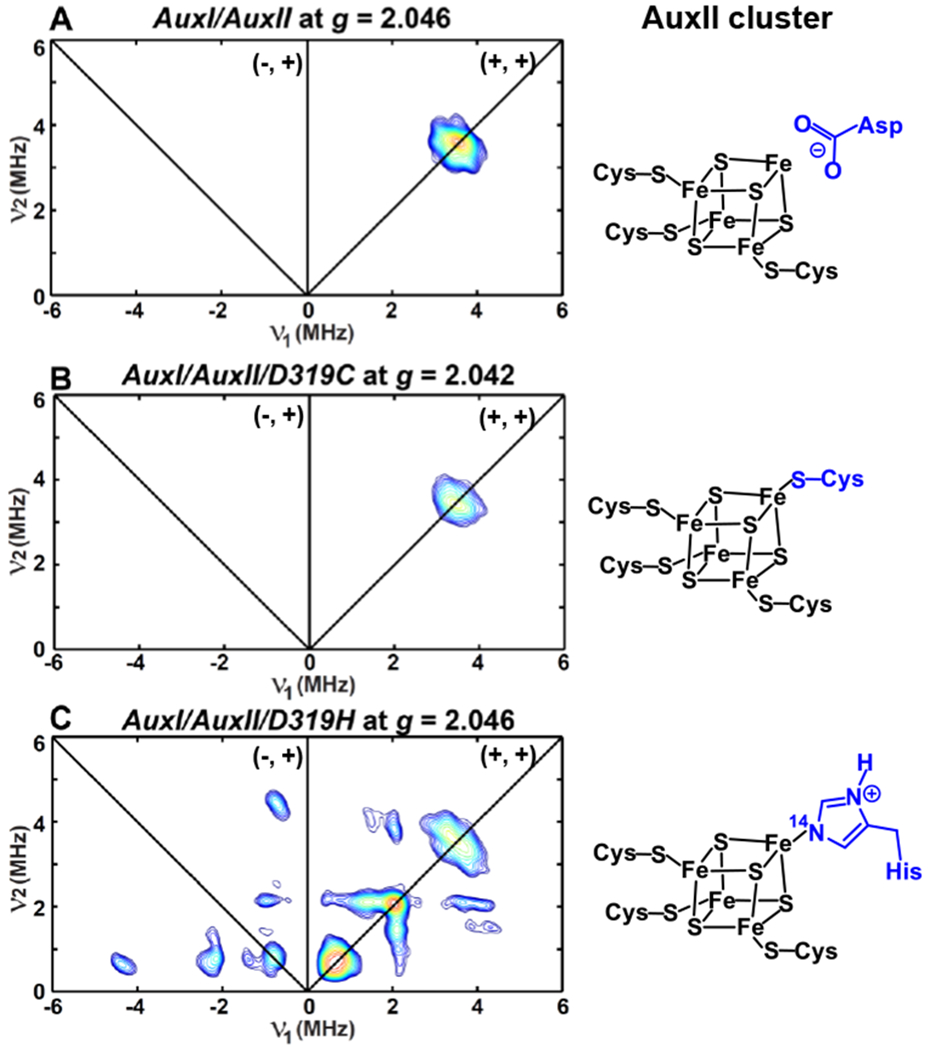
X-band HYSCORE spectra of dithionite-reduced AuxI/AuxII (A), AuxI/AuxII/D319C (B) and AuxI/AuxII/D319H (C) acquired at the magnetic field position corresponding to the g-value of 2.046, 2.042 and 2.046, respectively. The X-band and Q-band EPR spectra of these three samples are given in Figure 6. The corresponding AuxII cluster present in each sample is also depicted in the figure.
Experimental parameters: temperature = 10 K; tπ/2 = 12 ns; tπ = 24 ns; microwave frequency = 9.486 GHz, magnetic field = 331.2 mT, τ = 140 ns (A); microwave frequency = 9.187 GHz, magnetic field = 321.4 mT, τ = 144 ns (B); microwave frequency = 9.403 GHz, magnetic field = 328.4 mT, τ = 144 ns (C). The time increment in both dimensions is 24 ns with 180 steps.
To evaluate the 14N-hyperfme coupling arising from the Fe-histidine interaction in the AuxI/AuxII/D319H sample, a globally-15N-labled sample of D319H was prepared by expressing the protein in M9 medium supplemented with 15NH4Cl and ISOGRO®-15N medium powder. This globally-15N-labled sample allows us to extract the strong 15N-histidine hyperfine-coupling tensor A, as the nuclei spin (I = 1/2) of 15N does not have a nuclear quadrupole interaction (in contrast to 14N with I = 1) and will display a simplified HYSCORE spectrum. To be noted, the reason that 15N-labeled D319H was chosen rather than AuxI/AuxII/D319H is due to the higher yield of the former PqqE variant, which therefore can provide enough protein for pulse EPR analysis, and the target 15N-hyperfine coupling from the Fe-histidine interaction will not be altered. Orientation-selected Q-band HYSCORE spectra of dithionate-reduced 15N-labled D319H acquired at multiple magnetic field positions (corresponding to the g-values of 2.044, 1.957 and 1.922) are shown in Figure 9. One set of cross-peaks centered at 15N-Larmor frequencies is observed and is indicative of a strongly 15N-hyperfine interaction between Fe and histidine H319. The HYSCORE spectra are well simulated by using the 15N-hyperfine tensor of A(15N) = [−1.02, −4.55, −1.42] MHz and Euler angle = [55°, 100°, 25°], which corresponds to aiso = −2.33 MHz and T = −1.11 MHz. The spin density delocalized from the reduced [4Fe–4S+AuxII cluster to the ε-nitrogen in the histidine ligand (H319) is ca. 0.36% by using the equation of aiso = a0ρ[1/(1+n)], where ρ is the spin density residing on 15N, a0 (−2540 MHz for 15N)47 is the isotropic hyperfine-interaction for one electron in the 2s orbital of nucleus, and n is the hybridization constant (2spn) that is equal to 3 for an ε-nitrogen.
Figure 9.
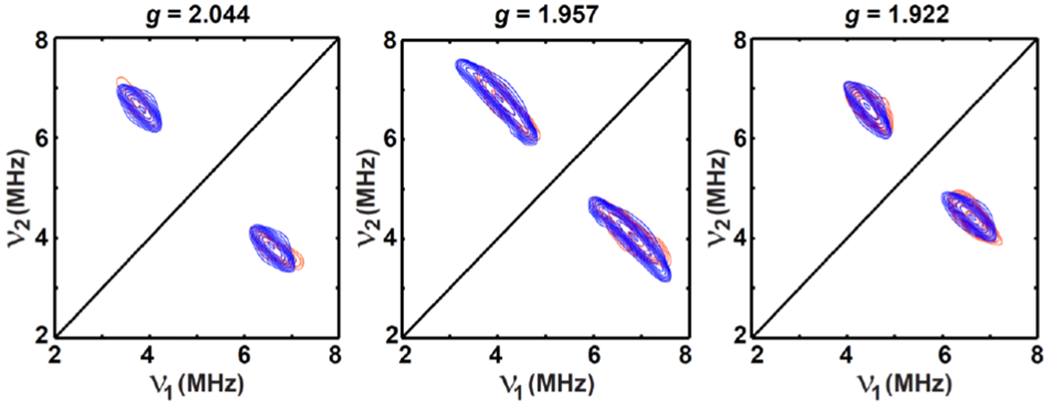
Orientation-selected Q-band HYSCORE spectra of dithionite-reduced globally-15N-labled D319H. The experimental spectra (contour plot) are in red, while the simulated spectra are in blue by using the parameters of g = [2.046, 1.935, 1.922]; A(15N) = [−1.02, −4.55, −1.42] MHz, Euler angle = [55, 100, 25]°.
Experimental parameters: temperature = 10 K; tπ/2 = 12 ns; tπ = 24 ns; microwave frequency = 34.161 GHz, magnetic field = 1194.4 mT, τ = 388 ns for g = 2.044; microwave frequency = 34.161 GHz, magnetic field = 1247.1 mT, τ = 372 ns for g = 1.957; microwave frequency = 34.161 GHz, magnetic field = 1269.8 mT, τ = 364 ns for g = 1.922. The time increment in both dimensions is 24 ns with 180 steps.
With the hyperfine parameters of 15N from the coordinated histidine ligand in hand, we can obtain the corresponding hyperfine parameters of 14N by scaling A(15N) to A(14N) via A(15N)/A(14N) = gn(15N)/gn(14N) = −1.403, resulting in A(14N) = [0.73, 3.25, 1.01] MHz and the same Euler angle = [55, 100, 25]°, which corresponds to aiso = 1.66 MHz and T = 0.8 MHz. By performing spectral simulations, as shown in Figure S5, the quadrupole parameters e2Qq/h = −2.05 MHz and η = 0.55 and the quadrupolar Euler angle = [50, 27, 20]° relative to the hyperfine tensor are determined. As listed in Table 4, the 14N-hyperfine and quadrupole interaction values fall in the range of the typical Fe-14N interactions. Especially, the 14N-quadrupole values are comparable to those of strongly-coupled 14N-histidine from the reduced [4Fe–4S]+ K1 cluster in MaNifB e2Qq/h = −2.1 MHz and η = 0.4) that is ligated by one putative histidine residue as well as three cysteine residues.48
Table 4.
Summary of hyperfine and quadrupole coupling values of 14N nitrogen ligated to Fe center.
| Enzyme | Species | g-values | aiso (MHz) | T (MHz) | e2Qq/ha (MHz) | η | Ref. |
|---|---|---|---|---|---|---|---|
| PqqE | D319H [4Fe–4S]+AuxII | [2.046, 1.935, 1.922] | 1.66 | 0.8 | −2.05 | 0.55 | this work |
| MaNifB | K1 [4Fe–4S]+b | [2.050, 1.905, 1.900] | 3.8 | 0.9 | −2.1 | 0.4 | 48 |
| BioB | [2Fe–2S]+-14N-Argc | [1.993, 1.941, 1.847]d [2.005, 1.960, 1.881]e |
−3.5 | −0.9 | 2.6-2.8 | 0.36-0.54 | 49, 50 |
| MitoNEET | [2Fe–2S]+-14N-His | [2.007, 1.937, 1.897] | −6.25 | −0.94 | −2.47 | 0.38 | 51 |
| Reiskef | [2Fe–2S]+-14N1-His | [2.02, 1.91, 1.75] | −3.6 | n.d. | 2.2-2.8 | 0.25-0.69 | 52 |
| [2Fe–2S]+-14N2-His | −4.8 | n.d. | 2.2-2.4 | 0.25-0.69 | 52 | ||
| Reiskeg | [2Fe–2S]+-14N1-His | [2.01, 1.92, 1.76] | −4.3 | −0.74 | −2.6 | 0.31 | 53 |
| [2Fe–2S]+-14N2-His | −5.5 | −0.74 | −2.3 | 0.4 | 53 | ||
| MoaA | MoaA-GTP | [2.063, 1.897, 1.897] | 3.6 | n.d. | −2.8 | n.d. | 54 |
| MoaA-ITP | [2.057, 1.883, 1.883] | 3.5 | n.d. | −3.2 | n.d. | 54 | |
| Myoglobin | heme | [5.97, 5.97, 2.0] | 9.32 | 1.11 | −2.24 | 0.44 | 55 |
The quadrupole coupling tensor we report in this work is defined as [P1, P2, P3] = e2Qq/4I(2I-1)h[−1+η, −1-η, 2], with the asymmetry parameter η = (P1-P2)/P3, which is in the range from 0 to 1, corresponding to an axially symmetric and rhombic electric field gradient at the nucleus, respectively.
The cluster is ligated by three cysteine and one putative histidine residue.
Paramagnetic intermediate with arginine coordinated to the ferrous of [2Fe–2S]+-MDTB (MDTB = 9-mercaptodethiobiotin).
Pseudomonas putida benzene dioxygenase.
Pseudomonas cepacia phthalate dioxygenase.
In this section, we have, thus, clearly identified the EPR signature for the AuxII [4Fe–4S]+ cluster with aspartate D319 as the fourth ligand, confirming the previous X-ray structure study. This assignment is corroborated by the generation of an S = 1/2 CN-bound [4Fe–4S]+AuxII species as well as the corresponding g-tensor shifts once the aspartate ligand (D319) was mutated to a histidine or cysteine residue.
3.3. Auxiliary I (AuxI) [4Fe–4S] cluster.
In section 3.2, we have shown that the reduced [4Fe–4S]+AuxII cluster gives rise to the major-component signal in the EPR spectra of dithionate-reduced AuxI/AuxII, indicating that dithionate is able to reduce the AuxII [4Fe–4S] cluster. However, as only the RS cluster was knocked out and the iron content was assayed as ≈10 Fe per AuxI/AuxII enzyme (see Table 5), there presumably should be some [4Fe–4S] AuxI cluster (besides the observed [2Fe–2S] cluster signal that will be discussed specifically in section 3.4) in the AuxI/AuxII sample.18,22,27 Also, as shown from crystal structures of three other enzymes (anSME,18 SuiB27 and CteB22) in the SPASM superfamily, all of these examples indicate [4Fe–4S] clusters at AuxI. We therefore sought alternate explanations for the absence of an EPR signature corresponding to an inferred [4Fe–4S] cluster within the AuxI site of PqqE. It was possible that our inability to observe its EPR signal was due to an inability of dithionate to reduce AuxI, such that it had remained diamagnetic and EPR silent. This suggested that the reduction potential of [4Fe–4S] within AuxI in PqqE may be lower than that of dithionite (−660 mV vs NHE at pH 7.0).
Table 5.
Type of Fe–S clusters present in PqqE variants in this work.
| PqqE Enzyme | Dithionite-reducible cluster | Low-potential cluster | Fe content Fe/enzyme | Crosslink activity | ||
|---|---|---|---|---|---|---|
| RS [4Fe–4S]a | AuxII [4Fe–4S]b | AuxI [2Fe-2S]c | AuxI [4Fe–4S]d | |||
| wild-type | + | + | + | + | 13 | + |
| RS only | + | − | − | −g | n.d. | − |
| AuxI/AuxII | − | + | + | + | 10 | − |
| AuxI/AuxII/D319H | − | +e | + | +g | n.d. | − |
| AuxI/AuxII/D319C | − | +f | + | +g | n.d. | − |
| RS/AuxI | + | − | + | + | 8 | − |
| RS/AuxII | + | + | − | − | 7 | − |
The g tensor for the RS [4Fe–4S]+ cluster is [2.040, 1.927, 1.897].
The g tensor for the AuxII [4Fe–4S]+ cluster with Asp319 as the fourth ligand is [2.059, 1.940, 1.903].
The g tensor for the AuxI [2Fe–2S]+ cluster is [2.004, 1.958, 1.904].
The g1 = 2.104 for the AuxI [4Fe–4S]+ cluster.
The g tensor for the AuxII [4Fe–4S]+ cluster with His319 as the fourth ligand is [2.046, 1.935, 1.922].
The g tensor for the AuxII [4Fe–4S]+ cluster with Cys319 as the fourth ligand is [2.042, 1.938, 1.917].
The corresponding EPR spectra are provided in Figure S6.
To test this hypothesis, we employed Ti(III) citrate (≈45 equivalents), a low-potential reductant that has a reduction potential lower than −800 mV at pH 7.0,36,56 to reduce the AttxI/AttxII sample and recorded the EPR spectrum to see whether an additional paramagnetic species could be detected at AuxI. As presented in Figure 10 (blue trace), an additional signal shows up at the magnetic field of 318.1 mT, corresponding to g1 value of 2.104, outside the region around g ~2.0 where the large Ti(III) (S = 1/2, 3d1) EPR signal dominated (orange trace, and also see Figure S6). This new g1 = 2.104 signal is also observed in the spectra of Ti(III) citrate-reduced samples of wild-type PqqE (black trace) and RS/AuxI (red trace), but is absent in the RS/AuxII variant (green trace). Taken together, these results point to the g1 = 2.104 signal arising from a reduced AuxI cluster in PqqE, which can only be EPR-observable by using Ti(III) citrate as the reductant. This assignment is corroborated via cyanide-treatment experiment in which the g1 = 2.104 signal is not affected, suggesting that the signal is due to a fully ligated AuxI cluster with four cysteine ligands (Figure S7). We rule out the possibility that this g1 = 2.104 signal is due to a splitting arising from the dipolar interaction between two reduced clusters as observed in Complex I,57 because the Q-band spectrum shows a signal at the same g-value (see Figure S8).51 If this signal were due to an inter-cluster dipolar interaction that contributes to the spin Hamiltonian, the EPR spectrum is expected to show a microwave-frequency dependence, which is not the case here.
Figure 10.
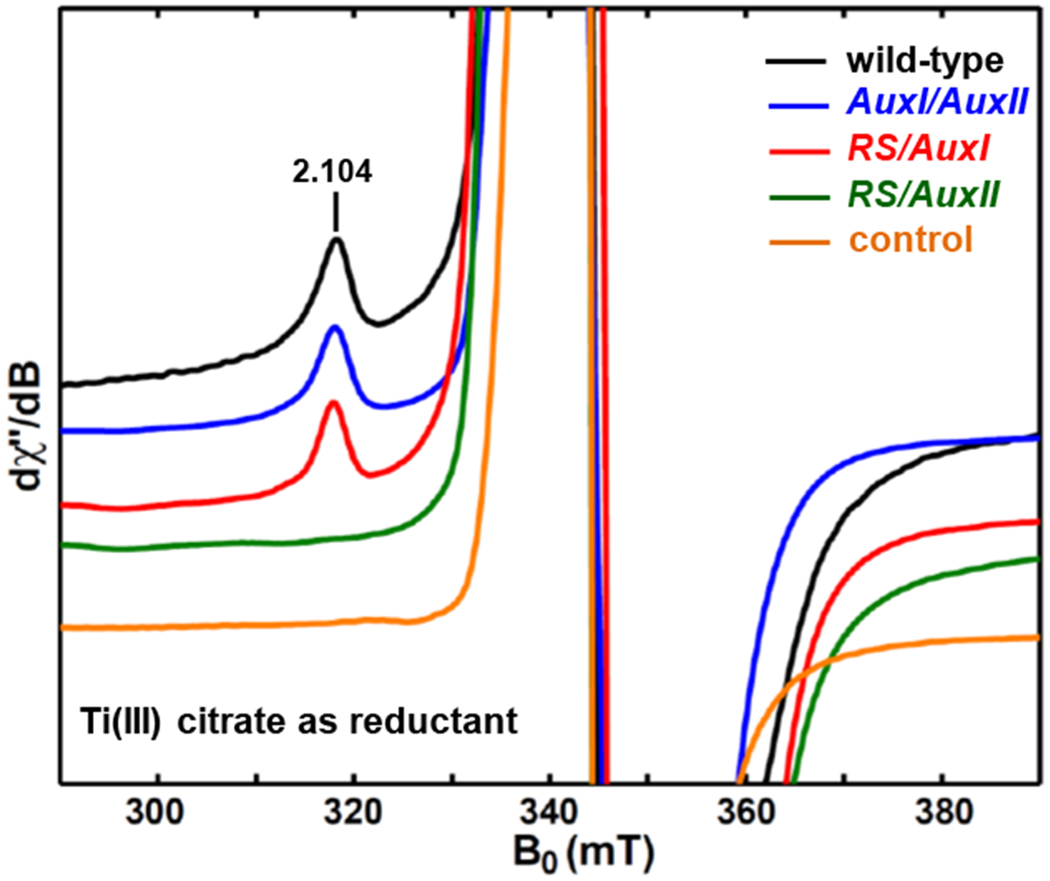
X-band (9.37 GHz) CW EPR spectra of Ti(III) citrate-reduced PqqE samples of wild-type (black trace), AuxI/AuxII (blue trace), RS/AuxI (red trace) and RS/AuxII (green trace). The control sample (orange trace) is Ti(III) citrate in HEPES-buffered solution. The CW EPR spectra were recorded at 10 K using 2.518 mW microwave power (no saturation). The full-scale spectra showing the Ti(III)-EPR signals dominant in the g ~ 2.0 region are given in Figure S6. The corresponding spectra of the dithionite-reduced samples of wild-type, AuxI/AuxII, RS/AuxI and RS/AuxII are presented in Figure 12, Figure 6 and Figure S9, respectively.
Therefore, the above results suggest that, in addition to a [2Fe–2S] cluster, the AuxI site of PqqE is also able to accommodate a low-potential Fe–S cluster, with a reduction potential lower than that of dithionite but higher than that of Ti(III) citrate. To be noted, while this AuxI cluster can only be reduced by Ti(III) citrate, the dithionite-reducible [4Fc–4S]RS and [4Fc–4S]AuxII clusters can also be reduced by Ti(III) citrate. Therefore, their corresponding EPR signals should appear in the spectra of Figure 10; however, the overlap with the hugely dominant Ti(III) signals complicates the interpretation of spectra in the g ~2.0 region in Figure 10. This does not invalidate the well characterized spectra of PqqE variants (cf. Figure S9) that verify, for example, the [4Fe–4S]+RS signal in dithionite-reduced RS/AuxI, as well as an [2Fe–2S] cluster signal and the [4Fe–4S]+RS and [4Fe–4S]+AuxII cluster signal in dithionite-reduced RS/AuxII; these results are consistent with the signal assignments described in section 3.1 and 3.2.
To determine the nature of this low-potential AuxI cluster, we probed its spin-relaxation properties by examining the g1 = 2.104 signal intensity as a function of both sample temperature and microwave power. Both the temperature dependence and power dependence of the signal behave dramatically different from those of either the [4Fe–4S]+RS cluster or the [4Fe–4S]+AuxII cluster (vide supra). As shown in Figures 4A (red circles) and S10A, the signal follows the Curie law, when the sample temperature is varied between 10 and 22 K, and relaxes too fast to be observed when the temperature is higher than 22 K (see Figure S10A).
The power dependence of the signal, presented in Figure 4B (red filled circles) and S10B, gives a half-saturation power P1/2 ca. 100 mW at 10 K, which is dramatically higher than the P1/2 values (1.0 mW and 1.1 mW at 10 K) for the [4Fe–4S]+RS and [4Fe–4S]+AuxII cluster, respectively. Therefore, the fast spin-relaxation properties of this g1 = 2.104 signal suggest it arises from a fast-relaxing [4Fe–4S] cluster rather than a [2Fe–2S] cluster, because [2Fe–2S] clusters usually relax much slower as shown in Figure 4 (green triangles), with the signal still persistent at 60 K and a much smaller half-saturation power P1/2 ca. 0.04 mW at 10 K. Even in the case of a [2Fe–2S] cluster that relaxes faster than the typical [2Fe–2S] cluster, e.g., the [2Fe–2S] cluster in xanthine oxidase that relaxes faster due to the dipolar interaction with its nearby paramagnetic Mo(V) center, the [2Fe–2S]+ cluster signal is still observable at 60 K.58 In addition, a second low-potential reductant, Eu(II)-DTPA,37–38 with the reduction potential ca. −1.14 V vs NHE at pH 8.0, was employed to verify the g1 = 2.104 signal, as shown in Figures 11 and S11. The observed g1 = 2.104 signal shows the same spin-relaxation properties as that obtained by using Ti(III) citrate (Figure 11), i.e., it is observed at 10 K but not observable at 25 K, suggesting its independence regarding the specific low-potential reductant and confirming its ascription to the reduced AuxI [4Fe–4S]+ cluster in PqqE. We note that the fast-relaxation properties of the AuxI [4Fe–4S] cluster are not altered by the presence or absence of nearby AuxII or RS clusters, as the spin-relaxation properties are similar for the wild-type, AuxI/AuxII and RS/AuxI samples. This is consistent with no inter-cluster dipolar interactions observed in PqqE (vide supra). We also rule out the possible effect of the presence of paramagnetic species, such as Ti(III) or Eu(II). As shown in Figure 11, the EPR spectrum of the wild-type PqqE reduced by Eu(II)-DTPA recorded at 25 K still shows the signals from reduced [4Fe–4S]+RS (g1 = 2.040) and [4Fe–4S]+AuxII clusters (g1 = 2.059), suggesting that the presence of the paramagnetic specie Eu(II) does not alter the spin-relaxation properties of these two clusters as compared to dithionite-reduced samples (vide supra).
Figure 11.
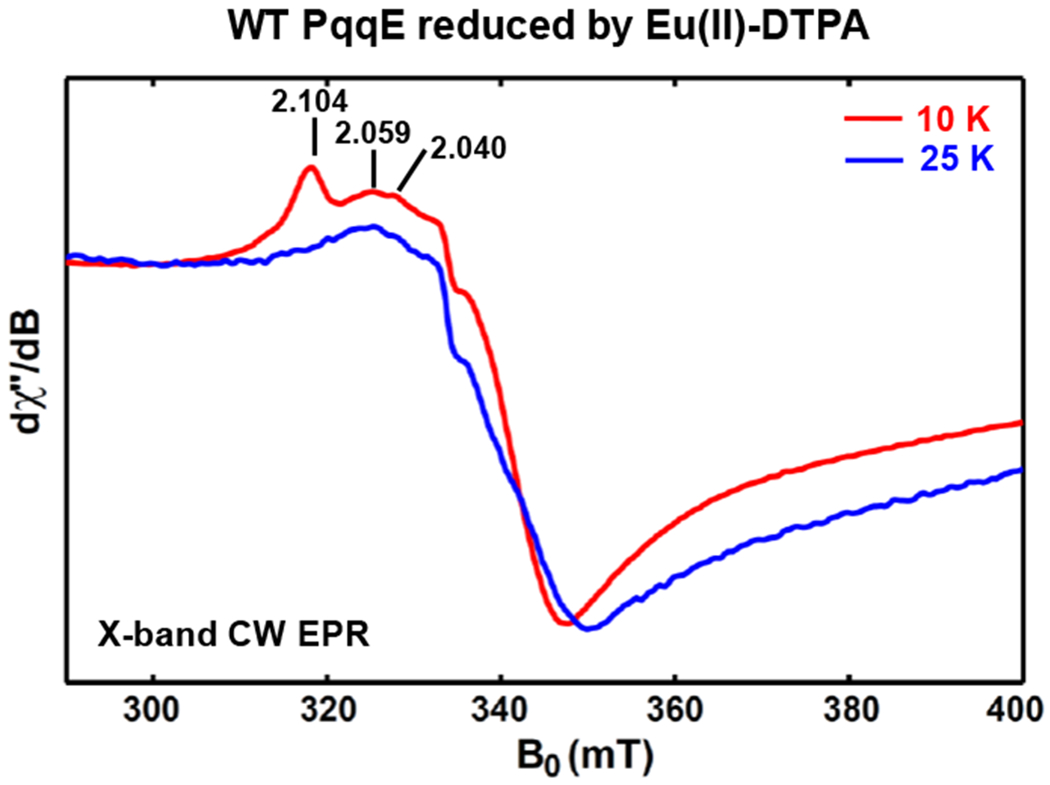
X-band (9.37 GHz) CW EPR spectra of Eu(II)-DTPA reduced wild-type PqqE after desalting. The red trace and blue trace is the spectrum recorded at 10 K and 25 K, respectively. The g1 value of 2.104, 2.059 and 2.040 is corresponding to the AuxI [4Fe–4S]+ cluster, the AuxII [4Fe–4S]+ cluster and the RS [4Fe–4S]+ cluster, respectively. The full spectra are shown in Figure S11.
Therefore, we reasoned that it is the local protein environment of the [4Fe–4S] cluster in the AuxI site that causes its fast relaxation. This is the first spectroscopic evidence of low-potential Fe–S cluster in SPAMS-domain containing radical SAM enzymes, which could be relevant to the oxidative cross-link catalysis (see section 3.5).
3.4. Auxiliary I (AuxI) [2Fe–2S] cluster.
We have identified a novel low-potential [4Fe–4S] cluster in the AuxI site as described in section 3.3. However, our previous X-ray structure of PqqE revealed a [2Fe–2S] cluster form in the AuxI site.11 In terms of the EPR spectra, the [2Fe–2S]+ cluster signal was observed in both previous EPR studies and this work. As mentioned in section 3.2, a minor component (15%) that has similar slow-relaxation properties as a [2Fe–2S]+ cluster was shown in the EPR spectrum of dithionite-reduced AuxI/AuxII. However, we noticed that the amount of the [2Fe–2S] cluster present in the AuxI/AuxII sample varied from batch to batch. Figure S12 shows the EPR spectrum of dithionate-reduced AuxI/AuxII sample from another batch (batch B, where batch A refers to the sample described in section 3.2); while the AuxII [4Fe–4S]+ signal with g-values = [2.059, 1.940, 1.903] remains the same as that identified from batch A, the [2Fe–2S]+ cluster has higher signal intensity (30% via spin quantification). The reason for varying amounts of the [2Fe–2S] cluster present in AuxI/AuxII could be due to variable lengths of time for purifying the enzyme in the anaerobic chamber; longer purification times led to higher signal intensity of the [2Fe–2S]+ cluster. Also, varying amounts of the [2Fe–2S] cluster were noted when inoculating the expression media with freshly co-transformed E. coli competent cell vs. freeze-thaw glycerol cell stock. In addition, we have observed obvious [2Fe–2S] cluster signals in the samples of dithionite-reduced AuxI/AuxII/D319H and AuxI/AuxII/D319C as well as cyanide-treated AuxI/AuxII, as shown in Figures S3&S4. The minor component shown in these three EPR spectra in Figure 6 is the residual [2Fe–2S] cluster signal after subtraction.
Besides these AuxI/AuxII-derived PqqE variants, we also detected [2Fe–2S]+ cluster signals in samples of dithionite-reduced wild-type PqqE and RS/AuxI, as shown in Figures 12&S9. Especially for the RS/AuxI sample with the AuxII cluster knocked out, similar to previous studies,11 the [2Fe–2S] cluster signal intensity is dramatically higher than other PqqE variants; the reason for this observation remains unclear. By employing the high-temperature EPR spectra of dithionite-reduced RS/AuxI, we extracted the g tensor [2.004, 1.958, 1.904] for the [2Fe–2S]+ cluster. We also characterized its slow spin-relaxation properties at 10 K for comparative purposes, as shown in Figures S13&4 (green triangles).
Figure 12.
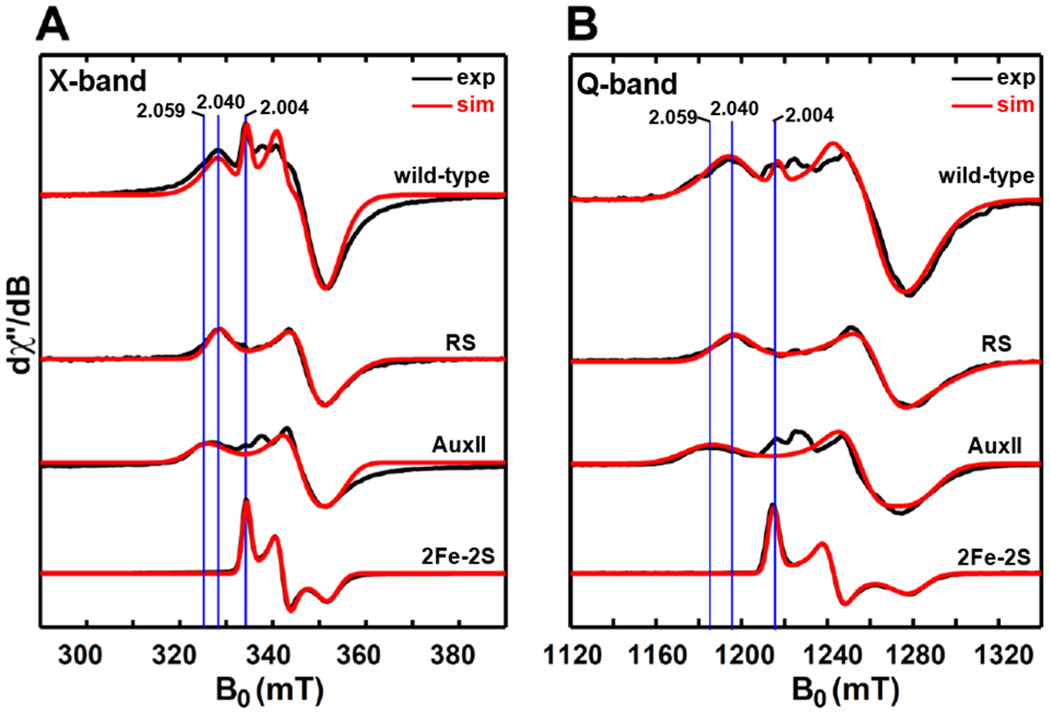
X-band (9.38 GHz) CW EPR (A) and Q-band (34.0 GHz) pseudo-modulated electron spin-echo detected field-swept EPR spectra (B) of dithionite-reduced wild-type PqqE. The top black trace is experimental spectrum, while the top red trace is the simulated spectrum involving the contributions from three reduced clusters, i.e., the RS cluster with g = [2.040, 1.927, 1.897], the AuxII cluster with g = [2.059, 1.940, 1.903] and the [2Fe–2S]+ cluster with g = [2.004, 1.958, 1.904]. The ratio of these three clusters employed for the simulation is 1 : 1 : 1. The CW EPR spectra were recorded at 10 K, with 0.02 mW microwave power (no saturation). The Q-band EPR spectra were recorded at 10 K by using a two-pulse sequence of π/2-τ-π-τ-echo, with π/2 = 12 ns and τ = 300 ns. The modulation amplitude of 3.0 mT was used to convert the absorption spectra to the pseudo-modulated spectra in (B).
The bottom three sets of spectra show the corresponding EPR signal for each cluster, with the RS cluster, the AuxII cluster and the [2Fe–2S]+ cluster signals obtained from dithionite-reduced samples of RS-only variant (Figure 3), AuxI/AuxII (Figure 6) and RS/AuxI (Figure S13).
As summarized in Table 5, the only samples that did not display the [2Fe–2S]+ cluster signal are the variants with the AuxI cluster knocked out, i.e., RS/AuxII and RS-only variant. While no low-potential AuxI [4Fe–4S]+ cluster with g1 = 2.104 signal was detected by using Ti(III) citrate to treat either RS/AuxII or RS-only variant (Figures 10&S6), no [2Fe–2S] cluster signal was observed at high-temperature (60 K) EPR spectra of the corresponding dithionite-reduced samples (Figure S9&S1) either. Correspondingly, the remaining reduced [4Fe–4S]+RS and [4Fe–4S]+AuxII signals are shown in the low-temperature (10 K) spectrum of dithionite-reduced RS/AuxII (Figure S9), and only the [4Fe–4S]+RS is observed for RS-only variant (Figure 3).
To summarize this section, the results of detailed EPR analyses on a myriad of enzyme samples indicate that the Fe–S cluster in the AuxI site of PqqE can exist in the form of either a [2Fe–2S] or a [4Fe–4S] cluster 11,31 Thus, at this juncture, it is not yet possible to conclude with certainty which form is essential for PqqE catalysis.
3.5. Possible roles of the Fe–S clusters in PqqE catalysis.
With multi-frequency EPR spectroscopy we have unambiguously identified four forms of Fe–S clusters present in PqqE. They can be categorized into two groups according to their reduction potentials. One group, reducible by dithionite, includes the RS [4Fe–4S], the AuxII [4Fe–4S] and the AuxI [2Fe–2S] clusters. Hence these three Fe–S clusters when reduced by dithionite give corresponding EPR signals, as described above (see section 3.1, 3.2 and 3.4). The other group is reducible by Ti(III) citrate or Eu(II)-DTPA but not dithionite and contains only the AuxI [4Fe–4S] cluster, which yields the EPR signal with a characteristic g1 = 2.104 feature (see section 3.3). Based on the present categorization, the EPR spectra of dithionite-reduced wild-type PqqE can be well simulated by summing the contributions of three reduced clusters in the first group, with a ratio of 1:1:1 for [4Fe–4S]+RS, [4Fe–4S]+AuxII and [2Fe–2S]+AuxI cluster, as shown in Figure 12. Combining the X-band and Q-band simulations, we did not observe any major spectral contributions arising from inter-cluster dipolar interactions. While precise redox potentials have yet to be been measured for any of the clusters in PqqE, this EPR study shows this to be an important future research goal.
In PqqE catalysis, the RS [4Fe–4S] cluster is in charge of initiating the reaction via reductive cleavage of the sulfonium C5′–S bond of SAM to yield a cluster-bound methionine and a 5’-deoxyadenosine radical (5’-dA•). The transient 5’-dA• radical abstracts a hydrogen atom from the β-carbon of glutamate residue to generate a glutamyl radical. The RS cluster is essential and is required for carbon-carbon cross-link activity, as suggested by our previous studies.11 In addition to the RS cluster, both auxiliary clusters (AuxI and AuxII) in the SPASM domain play essential roles in PqqE catalysis, as variants lacking either auxiliary cluster abolish the cross-link activity.
In the AuxI site of PqqE, with a mixture of Fe–S clusters identified, it is not yet possible to ascertain which form ([4Fe–4S] or [2Fe–2S]) is functionally relevant. We note in this context that a low-potential AuxI [4Fe–4S] cluster supports the radical aromatic substitution mechanism catalyzed by StrB/SuiB/AgaB,26,28,29 in which a carbon-carbon bond is formed between the β-carbon of lysine residue and the aromatic C7 of tryptophan residue in the peptide substrate of StrA/SuiA/AgaA, a reaction highly analogous to that performed by PqqE. One proposed requirement for the radical aromatic substitution mechanism is to maintain the AuxI cluster in an oxidized state, poised for acceptance of one electron from an radical anion intermediate generated via de novo carbon-carbon bond formation. Since the PqqE cross-link activity can only be achieved using a biological reducing system (such as NADPH/Flavodoxin A/Flavodoxin reductase11) with a potential much higher than achieved with either the Ti(III) or Eu(II) salts, it is expected that a functional [4Fe–4S] cluster in the AuxI site would remain oxidized during catalytic turnover and, as such could promote radical anion oxidation at an aromatic ring. However, the redox potential of such a radical anion intermediate is expected to be much lower59 than that anticipated for a [2Fe–2S] site at AuxI as well, indicating that other properties are likely, in the end, to rationalize the participation of [2Fe–2S] vs. [4Fe–4S] in the AuxI site of PqqE. The answer to this intriguing question will need to await future studies.
4. CONCLUSIONS
We have unambiguously identified the EPR spectroscopic signatures for four forms of Fe–S clusters present in PqqE: the RS [4Fe–4S] cluster, the AuxII [4Fe–4S] cluster, and two alternative clusters ([4Fe–4S] or [2Fe–2S]) bound in the AuxI site. They can be categorized into two groups according to their reduction potentials. One group is dithionite-reducible, including the RS [4Fe–4S] cluster, the AuxII [4Fe–4S] cluster and the [2Fe–2S] cluster in the AuxI site, with g tensors of their reduced form determined as [2.040, 1.927, 1.897], [2.059, 1.940, 1.903] and [2.004, 1.958, 1.904], respectively. The other group contains the AuxI [4Fe–4S] cluster giving rise to a g1 = 2.104 signal, which can only be reduced by using low-potential reductants, such as Ti(III) citrate or Eu(II)-DTPA. This low-potential AuxI [4Fe–4S] cluster has faster relaxation properties than that of the RS [4Fe–4S] and the AuxII [4Fe–4S] clusters, indicating a specific protein environment of the AuxI site in the SPASM-domain of PqqE. No inter-cluster dipolar interactions are observed. Identification and analysis of the EPR signature for each cluster pave the way for further investigations of PqqE catalysis via EPR spectroscopy. These results also raise interesting, unsolved questions regarding the mechanism of the oxidative carbon-carbon crosslink catalyzed by PqqE.
Supplementary Material
ACKNOWLEDGMENT
The work was supported by the National Institutes of Health (GM104543, 1R35GM126961–01 to R.D.B.; GM039296 to J.P.K). The EPR spectrometers at the CalEPR facility used in this study were funded by the National Institutes of Health (S10-RR021075) and the NSF (CHE-1048671).
Footnotes
Supporting Information Available: Temperature-dependence and power-dependence of the EPR signals of the RS [4Fe–4S]+ cluster, the AuxII [4Fe–4S]+ cluster, the AuxI [4Fe–4S]+ cluster and the AuxI [2Fe–2S]+ cluster; X-band 14N-HYSCORE spectrum and the simulated spectrum of dithionite-reduced AuxI/AuxII/D319H; Full spectra of WT PqqE and mutant samples reduced by Ti(III) citrate or Eu(II)-DTPA; Q-band pseudo-modulated electron spin-echo detected field-swept EPR spectrum (5 K) of WT PqqE reduced by Ti(III) citrate. This material is available free of charge via the Internet at http://pubs.acs.org.
The Accession ID of MePqqE Enzyme: https://www.uniprot.org/uniprot/P71517
REFERENCES
- [1].Duine JA (1999) The PQQ story, J. Biosci. Bioeng 88, 231–236. [DOI] [PubMed] [Google Scholar]
- [2].Anthony C (2001) Pyrroloquinoline quinone (PQQ) and quinoprotein enzymes, Antioxid. Redox Signal 3, 757–774. [DOI] [PubMed] [Google Scholar]
- [3].Goodwin PM, and Anthony C (1998) The biochemistry, physiology and genetics of PQQ and PQQ-containing enzymes, In Advances in Microbial Physiology (Poole RK, Ed.), pp 1–80, Academic Press. [DOI] [PubMed] [Google Scholar]
- [4].Klinman JP, and Bonnot F (2014) Intrigues and intricacies of the biosynthetic pathways for the enzymatic quinocofactors: PQQ, TTQ, CTQ, TPQ, and LTQ, Chem. Rev 114, 4343–4365. [DOI] [PMC free article] [PubMed] [Google Scholar]
- [5].Sode K, Ito K, Witarto AB, Watanabe K, Yoshida H, and Postma P (1996) Increased production of recombinant pyrroloquinoline quinone (PQQ) glucose dehydrogenase by metabolically engineered Escherichia coli strain capable of PQQ biosynthesis, J. Biotechnol 49, 239–243. [DOI] [PubMed] [Google Scholar]
- [6].Akagawa M, Nakano M, and Ikemoto K (2016) Recent progress in studies on the health benefits of pyrroloquinoline quinone, Biosci. Biotechnol. Biochem 80, 13–22. [DOI] [PubMed] [Google Scholar]
- [7].Shen Y-Q, Bonnot F, Imsand EM, RoseFigura JM, Sjölander K, and Klinman JP (2012) Distribution and properties of the genes encoding the biosynthesis of the bacterial cofactor, pyrroloquinoline quinone, Biochemistry 51, 2265–2275. [DOI] [PMC free article] [PubMed] [Google Scholar]
- [8].Barr I, Latham JA, Iavarone AT, Chantarojsiri T, Hwang JD, and Klinman JP (2016) Demonstration that the radical S-adenosylmethionine (SAM) enzyme PqqE catalyzes de novo carbon-carbon cross-linking within a peptide substrate PqqA in the presence of the peptide chaperone PqqD, J. Biol. Chem 291, 8877–8884. [DOI] [PMC free article] [PubMed] [Google Scholar]
- [9].Latham JA, Iavarone AT, Barr I, Juthani PV, and Klinman JP (2015) PqqD Is a novel peptide chaperone that forms a ternary complex with the radical S-adenosylmethionine protein PqqE in the pyrroloquinoline quinone biosynthetic pathway, J. Biol. Chem 290, 12908–12918. [DOI] [PMC free article] [PubMed] [Google Scholar]
- [10].Broderick JB, Duffus BR, Duschene KS, and Shepard EM (2014) Radical S-adenosylmethionine enzymes, Chem. Rev 114, 4229–4317. [DOI] [PMC free article] [PubMed] [Google Scholar]
- [11].Barr I, Stich TA, Gizzi AS, Grove TL, Bonanno JB, Latham JA, Chung T, Wilmot CM, Britt RD, Almo SC, and Klinman JP (2018) X-ray and EPR characterization of the auxiliary Fe–S clusters in the radical SAM enzyme PqqE, Biochemistry 57, 1306–1315. [DOI] [PMC free article] [PubMed] [Google Scholar]
- [12].Grell TAJ, Goldman PJ, and Drennan CL (2015) SPASM and twitch domains in S-sdenosylmethionine (SAM) radical enzymes, J. Biol. Chem 290, 3964–3971. [DOI] [PMC free article] [PubMed] [Google Scholar]
- [13].Flühe L, Knappe TA, Gattner MJ, Schäfer A, Burghaus O, Linne U, and Marahiel MA (2012) The radical SAM enzyme AlbA catalyzes thioether bond formation in subtilosin A, Nat. Chem. Biol 8, 350. [DOI] [PubMed] [Google Scholar]
- [14].Benjdia A, Guillot A, Lefranc B, Vaudry H, Leprince J, and Berteau O (2016) Thioether bond formation by SPASM domain radical SAM enzymes: Cα H-atom abstraction in subtilosin A biosynthesis, Chem. Commun 52, 6249–6252. [DOI] [PubMed] [Google Scholar]
- [15].Houck DR, Hanners JL, and Unkefer CJ (1991) Biosynthesis of pyrroloquinoline quinone. 2. biosynthetic assembly from glutamate and tyrosine, J. Am. Chem. Soc 113, 3162–3166. [Google Scholar]
- [16].Grove TL, Lee K-H, Clair J, Krebs C, and Booker SJ (2008) In vitro characterization of AtsB, a radical SAM formylglycine-generating enzyme that contains three [4Fe–4S] Clusters, Biochemistry 47, 7523–7538. [DOI] [PMC free article] [PubMed] [Google Scholar]
- [17].Grove TL, Ahlum JH, Qin RM, Lanz ND, Radle MI, Krebs C, and Booker SJ (2013) Further characterization of Cys-type and Ser-type anaerobic sulfatase maturating enzymes suggests a commonality in the mechanism of catalysis, Biochemistry 52, 2874–2887. [DOI] [PMC free article] [PubMed] [Google Scholar]
- [18].Goldman PJ, Grove TL, Sites LA, McLaughlin MI, Booker SJ, and Drennan CL (2013) X-ray structure of an AdoMet radical activase reveals an anaerobic solution for formylglycine posttranslational modification, Proc. Natl. Acad. Sci. USA 110, 8519. [DOI] [PMC free article] [PubMed] [Google Scholar]
- [19].Benjdia A, Leprince J, Guillot A, Vaudry H, Rabot S, and Berteau O (2007) Anaerobic sulfatase-maturating enzymes: radical SAM enzymes able to catalyze in vitro sulfatase post-translational modification, J. Am. Chem. Soc 129, 3462–3463. [DOI] [PubMed] [Google Scholar]
- [20].Khaliullin B, Ayikpoe R, Tuttle M, and Latham JA (2017) Mechanistic elucidation of the mycofactocin-biosynthetic radical S-adenosylmethionine protein, MftC, J. Biol. Chem 292, 13022–13033. [DOI] [PMC free article] [PubMed] [Google Scholar]
- [21].Bruender NA, and Bandarian V (2016) The radical S-adenosy-L-methionine enzyme MftC catalyzes an oxidative decarboxylation of the C-terminus of the MftA peptide, Biochemistry 55, 2813–2816. [DOI] [PMC free article] [PubMed] [Google Scholar]
- [22].Grove TL, Himes PM, Hwang S, Yumerefendi H, Bonanno JB, Kuhlman B, Almo SC, and Bowers AA (2017) Structural insights into thioether bond formation in the biosynthesis of sactipeptides, J. Am. Chem. Soc 139, 11734–11744. [DOI] [PMC free article] [PubMed] [Google Scholar]
- [23].Bruender NA, Wilcoxen J, Britt RD, and Bandarian V (2016) Biochemical and spectroscopic characterization of a radical S-adenosy-L-methionine enzyme involved in the formation of a peptide thioether cross-link, Biochemistry 55, 2122–2134. [DOI] [PMC free article] [PubMed] [Google Scholar]
- [24].Caruso A, Bushin LB, Clark KA, Martinie RJ, and Seyedsayamdost MR (2019) Radical approach to enzymatic β-thioether bond formation, J. Am. Chem. Soc 141, 990–997. [DOI] [PubMed] [Google Scholar]
- [25].Hudson GA, Burkhart BJ, DiCaprio AJ, Schwalen CJ, Kille B, Pogorelov TV, and Mitchell DA (2019) Bioinformatic mapping of radical S-adenosylmethionine-dependent ribosomally synthesized and post-translationally modified peptides identifies new Cα, Cβ, and Cγ-linked thioether-containing peptides, J. Am. Chem. Soc 141, 8228–8238. [DOI] [PMC free article] [PubMed] [Google Scholar]
- [26].Schramma KR, Bushin LB, and Seyedsayamdost MR (2015) Structure and biosynthesis of a macrocyclic peptide containing an unprecedented lysine-to-tryptophan crosslink, Nat. Chem 7, 431. [DOI] [PMC free article] [PubMed] [Google Scholar]
- [27].Davis KM, Schramma KR, Hansen WA, Bacik JP, Khare SD, Seyedsayamdost MR, and Ando N (2017) Structures of the peptide-modifying radical SAM enzyme SuiB elucidate the basis of substrate recognition, Proc. Natl. Acad. Sci. USA 114, 10420. [DOI] [PMC free article] [PubMed] [Google Scholar]
- [28].Schramma KR, and Seyedsayamdost MR (2017) Lysine-tryptophan-crosslinked peptides produced by radical SAM enzymes in pathogenic streptococci, ACS Chem. Biol 12, 922–927. [DOI] [PubMed] [Google Scholar]
- [29].Schramma KR, Forneris CC, Caruso A, and Seyedsayamdost MR (2018) Mechanistic investigations of lysine-tryptophan cross-link formation catalyzed by streptococcal radical S-adenosylmethionine enzymes, Biochemistry 57, 461–468. [DOI] [PubMed] [Google Scholar]
- [30].Bushin LB, Clark KA, Pelczer I, and Seyedsayamdost MR (2018) Charting an unexplored streptococcal biosynthetic landscape reveals a unique peptide cyclization motif, J. Am. Chem. Soc 140, 17674–17684. [DOI] [PubMed] [Google Scholar]
- [31].Saichana N, Tanizawa K, Ueno H, PechouŠek J, Novák P, and Frébortová J (2017) Characterization of auxiliary iron–sulfur clusters in a radical S-adenosylmethionine enzyme PqqE from Methylobacterium extorquens AM1, FEBS Open Bio. 7, 1864–1879. [DOI] [PMC free article] [PubMed] [Google Scholar]
- [32].Tanizawa K, Saichana N, Frébortová J, PechouŠek J, Novák P, Yakushi T, and Toyama H (2015) PqqE from Methylobacterium extorquens AM1: a radical S -adenosyl- l -methionine enzyme with an unusual tolerance to oxygen, J. Biochem 159, 87–99. [DOI] [PMC free article] [PubMed] [Google Scholar]
- [33].Kuchenreuther JM, Shiigi SA, and Swartz JR (2014) Cell-free synthesis of the H-Cluster: a model for the in vitro assembly of metalloprotein metal centers, In Metalloproteins: Methods and Protocols (Fontecilla-Camps JC, and Nicolet Y, Eds.), pp 49–72, Humana Press, Totowa, NJ. [DOI] [PubMed] [Google Scholar]
- [34].Suess DLM, Bürstel I, De La Paz L, Kuchenreuther JM, Pham CC, Cramer SP, Swartz JR, and Britt RD (2015) Cysteine as a ligand platform in the biosynthesis of the FeFe hydrogenase H cluster, Proc. Natl. Acad. Sci. USA 112, 11455. [DOI] [PMC free article] [PubMed] [Google Scholar]
- [35].Zhu W, Martins AM, and Klinman JP (2018) Chapter Fourteen - methods for expression, purification, and characterization of PqqE, a radical SAM enzyme in the PQQ biosynthetic pathway, In Enzymol Methods. (Bandarian V, Ed.), pp 389–420, Academic Press. [DOI] [PMC free article] [PubMed] [Google Scholar]
- [36].Zehnder AJ, and Wuhrmann K (1976) Titanium (III) citrate as a nontoxic oxidation-reduction buffering system for the culture of obligate anaerobes, Science 194, 1165. [DOI] [PubMed] [Google Scholar]
- [37].Vincent KA, Tilley GJ, Quammie NC, Streeter I, Burgess BK, Cheesman MR, and Armstrong FA (2003) Instantaneous, stoichiometric generation of powerfully reducing states of protein active sites using Eu(II) and polyaminocarboxylate ligands, Chem. Commun, 2590–2591. [DOI] [PubMed] [Google Scholar]
- [38].Lee CC, Hu Y, and Ribbe MW (2012) ATP-independent substrate reduction by nitrogenase P-cluster variant, Proc. Natl. Acad. Sci. USA 109, 6922. [DOI] [PMC free article] [PubMed] [Google Scholar]
- [39].Stoll S, and Schweiger A (2006) EasySpin, a comprehensive software package for spectral simulation and analysis in EPR, J. Magn. Reson 178, 42–55. [DOI] [PubMed] [Google Scholar]
- [40].Stoll S, and Britt RD (2009) General and efficient simulation of pulse EPR spectra, Phys. Chem. Chem. Phys 11, 6614–6625. [DOI] [PubMed] [Google Scholar]
- [41].Rupp H, Rao KK, Hall DO, and Cammack R (1978) Electron spin relaxation of iron-sulphur proteins studied by microwave power saturation, Biochim. Biophys. Acta-Protein Structure 537, 255–269. [DOI] [PubMed] [Google Scholar]
- [42].Dinis P, Suess DLM, Fox SJ, Harmer JE, Driesener RC, De La Paz L, Swartz JR, Essex JW, Britt RD, and Roach PL (2015) X-ray crystallographic and EPR spectroscopic analysis of HydG, a maturase in [FeFe]-hydrogenase H-cluster assembly, Proc. Natl. Acad. Sci. USA 112, 1362. [DOI] [PMC free article] [PubMed] [Google Scholar]
- [43].O’Dowd B, Williams S, Wang H, No JH, Rao G, Wang W, McCammon JA, Cramer SP, and Oldfield E (2017) Spectroscopic and computational investigations of ligand binding to IspH: discovery of non-diphosphate inhibitors, ChemBioChem 18, 914–920. [DOI] [PMC free article] [PubMed] [Google Scholar]
- [44].Telser J, Smith ET, Adams MWW, Conover RC, Johnson MK, and Hoffman BM (1995) Cyanide binding to the novel 4Fe ferredoxin from pyrococcus furiosus: investigation by EPR and ENDOR spectroscopy, J. Am. Chem. Soc 117 7, 5133–5140. [Google Scholar]
- [45].Nicolet Y, Rohac R, Martin L, and Fontecilla-Camps JC (2013) X-ray snapshots of possible intermediates in the time course of synthesis and degradation of protein-bound Fe–S clusters, Proc. Natl. Acad. Sci. USA 110, 7188. [DOI] [PMC free article] [PubMed] [Google Scholar]
- [46].Brereton PS, Duderstadt RE, Staples CR, Johnson MK, and Adams MWW (1999) Effect of serinate ligation at each of the iron sites of the [Fe4S4] cluster of pyrococcus furiosus ferredoxin on the redox, spectroscopic, and biological properties, Biochemistry 38, 10594–10605. [DOI] [PubMed] [Google Scholar]
- [47].Morton JR, and Preston KF (1978) Atomic parameters for paramagnetic resonance data, J. Magn. Reson 30, 577–582. [Google Scholar]
- [48].Rettberg LA, Wilcoxen J, Lee CC, Stiebritz MT, Tanifuji K, Britt RD, and Hu Y (2018) Probing the coordination and function of Fe4S4 modules in nitrogenase assembly protein NifB, Nat. Commun 9, 2824. [DOI] [PMC free article] [PubMed] [Google Scholar]
- [49].Taylor AM, Stoll S, Britt RD, and Jarrett JT (2011) Reduction of the [2Fe–2S] cluster accompanies formation of the intermediate 9-mercaptodethiobiotin in Escherichia coli biotin synthase, Biochemistry 50, 7953–7963. [DOI] [PMC free article] [PubMed] [Google Scholar]
- [50].Tao L, Stich TA, Fugate CJ, Jarrett JT, and Britt RD (2018) EPR-derived structure of a paramagnetic intermediate generated by biotin synthase BioB, J. Am. Chem. Soc 140, 12947–12963. [DOI] [PMC free article] [PubMed] [Google Scholar]
- [51].Dicus MM, Conlan A, Nechushtai R, Jennings PA, Paddock ML, Britt RD, and Stoll S (2010) Binding of histidine in the (Cys)3(His)1-coordinated [2Fe–2S] cluster of human mitoNEET, J. Am. Chem. Soc 132, 2037–2049. [DOI] [PMC free article] [PubMed] [Google Scholar]
- [52].Shergill JK, Joannou CL, Mason JR, and Cammack R (1995) Coordination of the Rieske-type [2Fe–2S] cluster of the terminal iron-sulfur protein of Pseudomonas putida benzene 1,2-dioxygenase, studied by one- and two-dimensional electron spin-echo envelope modulation spectroscopy, Biochemistry 34, 16533–16542. [DOI] [PubMed] [Google Scholar]
- [53].Gurbiel RJ, Batie CJ, Sivaraja M, True AE, Fee JA, Hoffman BM, and Ballou DP (1989) Electron-nuclear double resonance spectroscopy of nitrogen-15-enriched phthalate dioxygenase from Pseudomonas cepacia proves that two histidines are coordinated to the [2Fe–2S] Rieske-type clusters, Biochemistry 28, 4861–4871. [DOI] [PubMed] [Google Scholar]
- [54].Lees NS, Hänzelmann P, Hernandez HL, Subramanian S, Schindelin H, Johnson MK, and Hoffman BM (2009) ENDOR spectroscopy shows that guanine N1 binds to [4Fe–4S] cluster II of the S-adenosylmethionine-dependent enzyme MoaA: mechanistic implications, J. Am. Chem. Soc 131, 9184–9185. [DOI] [PMC free article] [PubMed] [Google Scholar]
- [55].Scholes CP, Lapidot A, Mascarenhas R, Inubushi T, Isaacson RA, and Feher G (1982) Electron nuclear double resonance (ENDOR) from heme and histidine nitrogens in single crystals of aquometmyoglobin, J. Am. Chem. Soc 104, 2724–2735. [Google Scholar]
- [56].Guo M, Sulc F, Ribbe MW, Farmer PJ, and Burgess BK (2002) Direct assessment of the reduction potential of the [4Fe–4S]1+/0 couple of the Fe protein from Azotobacter vinelandii, J. Am. Chem. Soc 124, 12100–12101. [DOI] [PubMed] [Google Scholar]
- [57].Roessler MM, King MS, Robinson AJ, Armstrong FA, Harmer J, and Hirst J (2010) Direct assignment of EPR spectra to structurally defined iron-sulfur clusters in complex I by double electron-electron resonance, Proc. Natl. Acad. Sci. USA 107, 1930–1935. [DOI] [PMC free article] [PubMed] [Google Scholar]
- [58].Caldeira J, Belle V, Asso M, Guigliarelli B, Moura I, Moura JJG, and Bertrand P (2000) Analysis of the electron paramagnetic resonance properties of the [2Fe–2S]1+ centers in molybdenum enzymes of the xanthine oxidase family: sssignment of signals I and II, Biochemistry 39, 2700–2707. [DOI] [PubMed] [Google Scholar]
- [59].Bank S, and Juckett DA (1976) Reactions of aromatic radical anions. 12. Kinetic studies of the reaction of radical anions of varying reduction potential with n-hexyl bromides, iodides, and chlorides, J. Am. Chem. Soc 98, 7742–7746. [Google Scholar]
Associated Data
This section collects any data citations, data availability statements, or supplementary materials included in this article.


