Abstract
The profile of the action potential (AP) of cardiomyocytes contributes to the modality of ventricular repolarization of the heart. Experimentally, the examination of the AP in isolated cardiomyocytes provides information on their electrical properties, adaptations to physiological and pathological conditions, and putative ionic mechanisms involved in the process. Currently, there are no available platforms for automated assessment of AP properties and standard methodologies restrict the examination of the AP repolarization to discrete, user-defined ranges, neglecting significant intervals of the electrical recovery. This study proposes two automatic methods to assess AP profile throughout the entire repolarization phase. One method is based on AP data inversion and direct extraction of patterns describing beat-to-beat dynamics. The second method is based on evolutive singular value decomposition (ESVD), which identifies common patterns in a series of consecutive APs. The two methodologies were employed to analyze electrical signals collected from cardiomyocites obtained from healthy mice and animals with diabetes, a condition associated with alterations of AP properties in cardiac cells. Our methodologies revealed that the duration of the early repolarization phase of the AP tended to become progressively longer during a stimulation train, whereas the late repolarization progressively shortened. Although this behavior was comparable in the two groups of cells, alterations in AP dynamics occurred at distinct repolarization levels, a feature highlighted by the ESVD approach. In conclusion, the proposed methodologies allow detailed, automatic analysis of the AP repolarization and identification of critical alterations occurring in the electrical behavior of myocytes under pathological conditions.
Keywords: Diabetes, murine model, singular value decomposition, action potential, cardiac repolarization
1. Introduction
The action potential (AP) of cardiomyocytes underlies the electrical and contractile behavior of the entire heart, with important implications on the stability of cardiac rhythm and mechanical function. The analysis of the AP of myocytes provides information on the electrical behavior of cardiac cells obtained from the normal or diseased heart, and modalities of adaptation of the electrical activity to experimental interventions. Thus, the examination of the AP of myocytes under various circumstances allows the identification of alterations contributing to the origin of electrical and mechanical disturbances, on the one hand, and provides information on putative ionic currents underlying changes of electrical properties of cardiac cells, on the other.
Phase-plane analysis of cardiac AP has been previously proposed [1] to graphically compute depolarization rate constants and equilibrium potentials, and to obtain information on ionic currents responsible for the profile of the AP. However, the analysis of phase-plane plots is merely visual, and the quantification of properties of AP duration and morphology is geometrically and computationally complex, limiting the applicability of this analysis when evaluating APs obtained from different myocytes or from the same cell under various conditions.
Currently, APs are analyzed using semiautomatic programs allowing the computation of the duration of the AP (APD) at discrete, user-defined repolarization levels, while neglecting information present in other ranges of the electrical recovery. This aspect reduces the level of accuracy of the assessment and questions the suitability of currently available approaches to capture temporal adaptations and beat-to-beat variations of the repolarization phase of the AP.
To address these limitations, we have implemented a novel method for the assessment of repolarization properties of the AP and alterations occurring during a train of stimulations. Initially, the inverse function of the electrical signal of the AP was computed in order to express duration of the AP as a function of the repolarization level. Subsequently, alterations occurring in the repolarization phase were analyzed using two distinct approaches. With the first approach, beat-to-beat alterations of the AP repolarization were either computed directly on the raw data or determined through linear or higher order polynomial regressions of APD values. With the second approach, a modified evolutive singular value decomposition (ESVD) method was applied to APs, and information related to their temporal dynamics (i.e., changes occurring in consecutive APs) was obtained for the entire repolarization range.
To test the functionality of our methodologies, AP repolarization properties were assessed in myocytes and perfused hearts from healthy and diabetic mice. This selection was based on previous finding documenting that hyperglycemia is associated with prolongation of the AP and enhanced dispersion of cardiac electrical repolarization [2, 3], possibly interfering with temporal adaptations of the AP profile. We report that the modality of adaptation of the AP repolarization to a train of stimulations differs in control and diabetic myocytes. Thus, our novel approaches represent valuable platforms for the detailed and comprehensive assessment of AP properties of cardiomyocytes.
2. Materials and Methods
2.1. Experimental animals, patch-clamp and ex-vivo studies
Female C57Bl/6 mice at 3 to 11 months of age were studied in accordance with the Guide for Care and Use of Laboratory Animals; experiments were approved by the local animal care committee. Diabetes was induced by streptozotocin (STZ, Sigma-Aldrich, St. Louis, MO) injection, as previously reported [2, 3]. Animals with blood glucose level higher than 300 mg/dL were included in the study. Data were obtained from cardiomyocytes collected from hearts of naïve mice (control, CTRL, n = 41 cells from 14 animals) and STZ-treated hyperglycemic mice (STZ, n = 76 cells from 10 animals) [4]. Details related to the enzymatic digestion of left ventricular myocytes from murine hearts and current-clamp experimental setup are provided elsewhere [2, 5, 6]. Monophasic action potentials (MAPs) were recorded at a 4 kHz sampling rate using a micro MAP-Tip electrode (Harvard Apparatus) positioned on the left ventricular free wall of Langendorff perfused hearts from 7 CTRL and 5 STZ mice. Hearts were stimulated via a mini-coaxial electrode at 125-ms basic cycle length. Details related to the experimental setup are provided elsewhere [2, 5].
2.2. Formatting of electrical recordings
For our analysis, a series of 70 consecutive APs obtained from CTRL and STZ myocytes stimulated at 2 Hz pacing rate was employed. Electrical signals were initially processed using Clampfit 10 software (Molecular Devices) for calculation of the duration of the AP at 10% (APD10), 30% (APD30), 50% (APD50), 70% (APD70), and 90% (APD90) of the repolarization phase. In brief, APDR was computed as the time between the positive peak of the AP and the level when the AP dropped (repolarized) by R% of its height. Electrical signals were converted into text files for processing in MATLAB (MathWorks). APs were segmented and aligned with respect to the depolarization time and arranged into a I × N matrix X. I = 70 signifies the number of APs examined in a recording and N = 5000 reflects the number of samples in each stimulation cycle, corresponding to 500 ms:
| (1) |
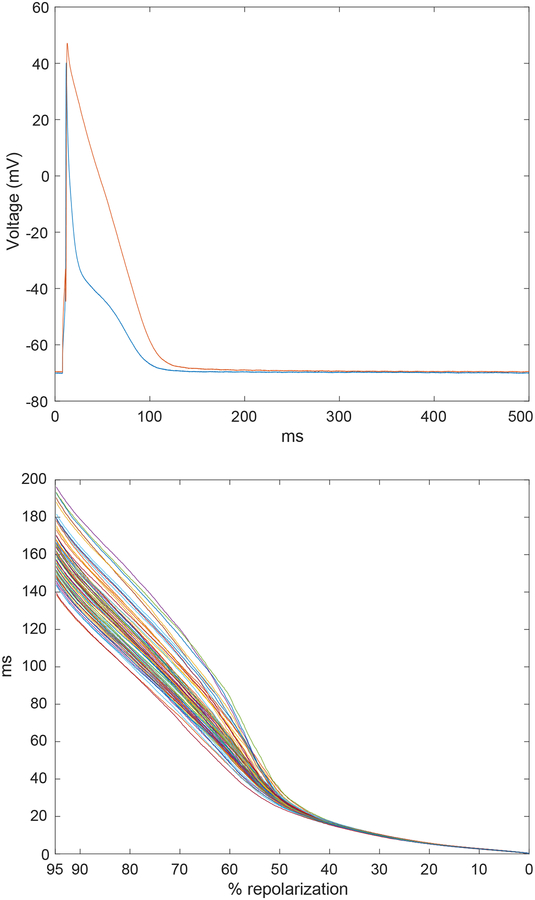
with each vector xi, i = 1,…,I representing a single AP. Representative APs obtained from a CTRL and STZ myocytes are reported in Fig. 1 (upper panel). Data were acquired at a sampling rate of 10 kHz and, subsequently, electrical recordings were downsampled by a factor of 10, producing N* = N/10 samples. This step was performed to reduce the computational load without loss of relevant information.
Fig. 1:
Upper panel: Representative APs recorded in cardiomyocytes isolated from CTRL (blue traces) and STZ (red traces) mice. Lower panel: Representation of superimposed inverted AP signals following computation of the inverse function for a train of APs obtained from a STZ myocyte. AP duration (y axis) is presented as a function of membrane voltage, expressed in percentage of repolarization (x axis).
2.3. Analysis of temporal alterations of the repolarization phase of the AP
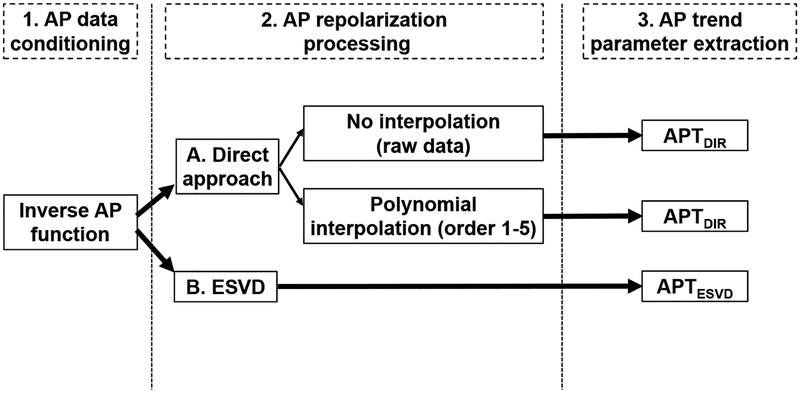
To quantify alterations in the repolarization phase of the AP occurring during a train of stimulations and to compare the behavior observed in CTRL and STZ myocytes, the following steps were applied (Fig. 2).
Fig. 2:
Flowchart of the processing algorithms employed for the assessment of the temporal alterations of AP repolarization.
Computation of the inverse function for AP signals, to represent AP duration as a function of the repolarization level;
Processing of the signal of the repolarization phase by i) a direct approach involving raw data, linear regression, or polynomial interpolation, or ii) a modified evolutive singular value decomposition method (ESVD);
Quantification of alterations (temporal trends) of the repolarization phase of the AP occurring during the stimulation train by computing the first derivative of processed signals;
Comparison of temporal trends of the repolarization phase for CTRL and STZ myocytes.
2.4. Computation of the inverse function of AP signals
To present duration of the AP as function of repolarization, AP signal matrix was processed as reported previously [2, 4, 7] (see Fig. 1, lower panel). AP amplitude was normalized in the repolarization range [0%–95%] between 1 and 0. The terminal portion of the AP, [95%–100%], was not processed to limit spurious artifacts due to boundary conditions. After this transformation, the late repolarization appeared on the left portion of the horizontal axis, whereas the early phase of repolarization appeared on the right side (see Fig. 1, lower panel). After this signal conditioning, the notation X was maintained for the observations’ matrix. Computing the inverse of xi required the function to be strictly monotonic, a condition which is met by the rodent AP.
Each AP observation xi, i = 1,…,I was modeled as a function of its duration n, n = 1,…,N*, as:
| (2) |
where fi(n; βi) is a parametric function with parameters’ vector βi, and the term ei(n) accounted for noise. As previously done [7, 8], fi(n; βi) was expressed as a linear combination of a collection of functions wl(n):
| (3) |
where the number of functions L was assumed as the maximum integer not greater than (N*+1)/2 (see Supplementary Material in [2] for graphical explanation). As previously reported [7, 8], functions wl(n) were chosen as piecewise linear with a triangle shape. It was demonstrated that imposing fi(n; βi) to be strictly monotonically decreasing implied that the same constraint could be extended to βi as well:
| (4) |
By using this condition, βi could be determined by least squares estimation under inequality constraints, with conversion to a least distance programming (LDP) problem [9]:
| (5) |
Subsequently, AP observations xi were replaced by the new estimated function fi, which was strictly decreasing, and it appeared smoothed, because the noise ei had been filtered out. By this process, the inverse function n describing the profile of the AP was uniquely interpolated as:
| (6) |
In this study, M = 500 repolarization level values z were uniformly selected in the interval [0,1], providing suffcient accuracy for subsequent processing. These inverted APs were then analyzed by the two newly developed approaches.
2.5. Mathematical models of AP repolarization profile
Following computation of the inverse function for electrical signals, raw AP duration data were employed to evaluated temporal alterations occurring during the stimulation train.
Subsequently, we investigated whether it was possible to determine a more general mathematical function which could accurately model the duration of AP (APD) computed in Eq. (6) over the entire repolarization range and across the course of the stimulation. We first explored the suitability of a linear law to quantify the relation APD vs stimulation index, for each repolarization level. Then, we investigated whether the inclusion of additional, non-linear terms could improve the descriptive power of the model and capture more complex phenomena in the cardiac electrical recovery. For this purpose, we tested several polynomial functions with increasing regression orders.
The use of linear and higher order polynomial functions to describe the duration of AP over the repolarization range was selected because of the possibility to quantify APD changes in response to the stimulation in terms of their derivative, which can be easily computed and expressed in terms of the polynomials’ coeffcients. More precisely, these coeffcients can provide information on the direction of APD temporal variations, i.e., on the overall shortening/lengthening of repolarization along the stimulation, allowing a more straightforward and clear interpretation of the data.
The strategies presented so far aim to determine APD changes over the progression of the stimulation by considering each repolarization level separately. As an alternative approach, we determined a common behavior of the repolarization phase of the AP over the stimulation train and then quantified the deviation from this common pattern, for each repolarization level r. To this end, we investigated the applicability of ESVD, which allows the extraction of the most meaningful signal components, providing a compressed representation of input data and easing their interpretation. With regard to the analysis of AP electrical recovery, by ESVD we extracted an AP template summarizing the main trend of repolarization (i.e., overall APD increasing/decreasing), and then used the obtained template as a reference for a more detailed analysis of changes of the AP pattern during the stimulation, at specific repolarization levels. Compared to standard SVD, ESVD can provide insights into subtle temporal variations of AP observations, which can be easily quantified in terms of function derivatives. In the next subsections, more mathematical details about these AP models are provided.
2.6. Assessment of temporal trends of AP repolarization by direct data processing
To evaluate alterations of the AP occurring during the stimulation train, durations of AP (APDs), computed with Eq. (6) at the r-th fixed level of repolarization r, were either directly processed or interpolated via linear or higher order polynomial regression. At each repolarization level r = 1,…,M, a set of I = 70 APD values (one per beat) was measured, and each sequence was denoted as a vector r, with r = 1,…,M.
Values of the AP duration over the course of the stimulation for a given repolarization level were fitted with linear regression or polynomial functions up to the fifth order. Trends in the duration of the AP were quantified by the mean of the first derivative of raw data or relations obtained by linear or higher order polynomial function. The mean of derivative values was then normalized by the mean of the APD for that repolarization level and labelled as APTDIR ·APTDIR was employed as an index of directionality and rate of APD change.
2.7. Assessment of temporal trends of AP repolarization by ESVD
As previously reported [4], we introduced the first order model for r = 1,…,M repolarization levels:
| (7) |
where i = 1,…,I and er(i) accounts for the acquisition and noise modeling. The problem presented here is an order-one approximation of the more complex decomposition:
| (8) |
which, in turns, is an extension of the standard SVD:
| (9) |
This approach is based on the functional data analysis theory [10], assuming that measurements originate from continuous phenomena. The function pr(i) is related to the r-th repolarization percentage, whereas the term v(i) contains information common to all levels r = 1,…,M. Functions pr(i) were decomposed over a set of K basis functions bk(i) such that:
| (10) |
In the sequel, a set of K=3 polynomial functions bk(i) was introduced in order to obtain smooth variations of the AP profile when varying i over the repolarization interval. In vector format with samples arranged column-wise, Eq. (7) can be expressed as:
| (11) |
where the coeffcients bk(i) are stored column-wise in B, θr contains the θr,k values, and Mv = B ∘ (v1IT). Symbol ‘∘’ refers to the Hadamard element-wise product and 1I is a vector with all elements equal to 1. As formulated in Eq. (7), the problem allows the estimation of pr and v by alternated least squares minimization of the criterion function , under the constraint . This condition guarantees uniqueness of the solution and scaling-invariance. Based on these points, AP observations can be indicated as , where is the polynomial pr normalized by its mean value , and , such that (see Appendix). The normalization of pr by its mean value prevents the algorithm from converging to −pr and −v while obtaining the same result for the Hadamard product. Additional details related to the ESVD solution computation are provided in the Appendix.
As previously performed [4], polynomials are modeled as 3rd-order function considered and consider multiplicative factors of vector , thus dimensionless. To assess AP profile variations for each repolarization level r in the range [0% – 95%], the mean of the first derivative of over the course of the stimulation train was determined, together with the sign of the mean of the first derivative of . The first term refers to AP dynamics specific to a fixed level of repolarization r, whereas the second term describes an average behavior which is common to all phases of repolarization. The product of the two, denoted APTESVD, exhibits the following property: if APTESVD>0 then reinforces the trend of , i.e., the extent of the AP profile to shorten/prolong along the stimulation. By contrast, if APTESVD<0 the term weakens the trend of .
2.8. Assessment cardiac repolarization at the tissue level through automatic MAP processing
To determine whether the analysis of the electrical recovery at the single cell level through the two new algorithms could be extended to the intact myocardium, MAPs were recorded in Langendorff perfused hearts obtained from n=7 CTRL and n=5 STZ mice. A set of 40 consecutive beats from these electrical signals was processed. The average MAP profiles were determined for both groups. Furthermore, APT was assessed by both methodologies, i.e., the direct approach (with and without polynomial interpolation) and the ESVD approach.
2.9. Statistical analysis
Data were initially tested for normality with Agostino-Pearson test for assignment to parametric or non-parametric analysis. Accordingly, significant deviations from zero were verified through t-test or Wilcoxon signed rank test. Similarly, temporal changes in the AP indices throughout the stimulation train were assessed via paired t-test or Wilcoxon matched-pairs signed rank. For each method, i.e., standard APD analysis, direct processing (with or without polynomial approximations), and ESVD processing, intergroup differences were evaluated via rank-sum test. A similar approach was applied to repolarization indices computed from MAP recordings. Statistical tests were considered significant for p<0.05.
3. Results
3.1. Temporal alterations of the AP repolarization during a train of stimulations
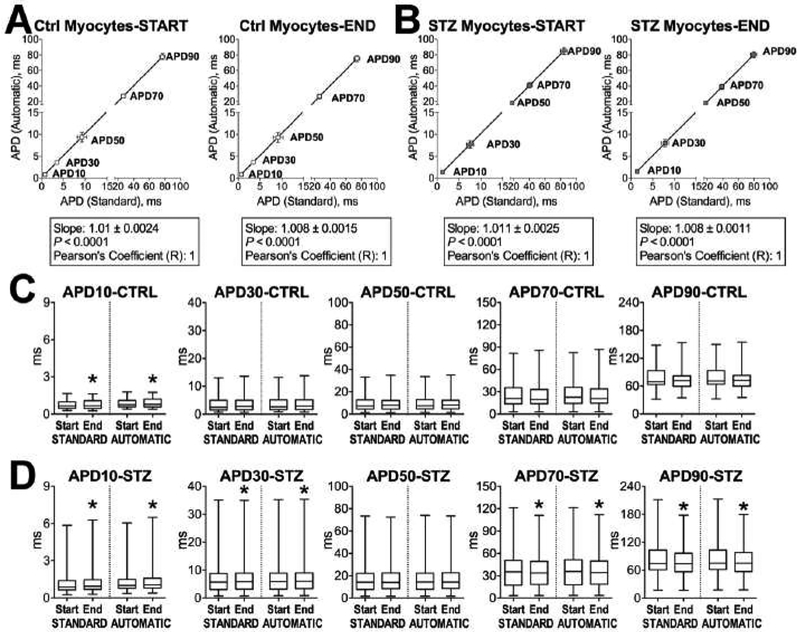
To test the ability of our algorithms to define temporal alterations occurring in the repolarization phase of the AP and identify putative differences in the behavior of cardiomyocytes from normal and diseased hearts, 70 sequential APs elicited during a train of stimulations applied to CTRL and diabetic cells were studied. Specifically, the sequence of APs was obtained in 41 CTRL and 76 STZ myocytes. Initially, we evaluated whether changes in AP properties occurred during the sequence of stimuli. Therefore, duration of the AP at 10% (APD10), 30% (APD30), 50% (APD50), 70% (APD70), and 90% (APD90) of the repolarization phase was computed for the first and last AP of the stimulation sequence. Analysis was computed for each cell of the CTRL and STZ groups using standard methodology (Clampfit software) and computation of the inverse AP function, as previously done [2] (Fig. 3). The two methodologies yielded to similar results, as documented by linear regression and Pearson correlation analysis for the two datasets (Fig. 3A and Fig. 3B). With data obtained with the two approaches, durations of the AP at different repolarization levels for the first and last beats were then compared. Quantitatively, for CTRL myocytes, APD10 was significantly prolonged at the end of the stimulation train, with respect to the initial beat (Fig. 3C). Similarly, for diabetic cells, APD10 and APD30 were prolonged at the end of the stimulation train, but shortening of the AP occurred at 70% and 90% of the repolarization phase (Fig. 3D). Thus, based on observed temporal changes in AP properties for CTRL and STZ myocytes, electrical signals were processed using our newly developed analytical approaches to determine whether these methodologies offered additional information.
Fig. 3:
A and B. Bivariate plot of AP duration at discrete repolarization levels computed with conventional (Standard) and newly developed (Automatic, i.e. computation of the inverse function for AP signals) approaches. Parameters for the initial (START) and last AP (END) of the series for CTRL (A, n=41) and STZ (B, (n=76) myocytes are reported as mean±SEM and are fitted with linear regression. C and D. Comparison of APD properties of the initial and final AP computed with conventional (Standard) and newly developed (Automatic) approaches, for CTRL and STZ cells reported in A and B. Data is shown as median and interquartile ranges. *, p<0.05.
3.2. Evaluation of AP repolarization properties by direct processing of electrical signals
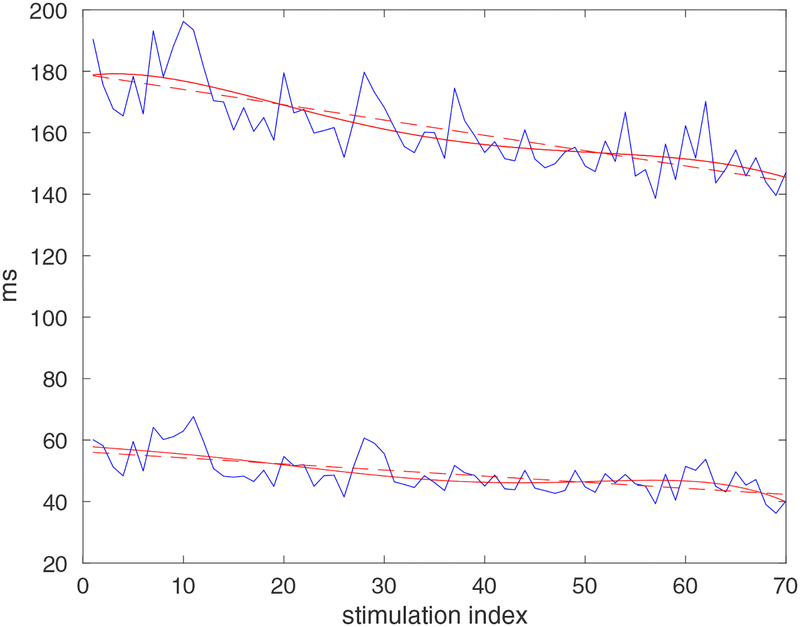
To establish the ability of our algorithms to define temporal alterations occurring in the repolarization phase of the AP and identify putative differences in the behavior of CTRL and diabetic cardiomyocytes, APs elicited by the train of stimulations in the two groups of cells were processed. Initially, we compared outcomes of the processing stage involving linear regression or higher order polynomial interpolation of APD over the course of the stimulation train, with respect to the raw input data. A representative example of different approximations for the duration of the AP at 55% and 95% of the repolarization for a STZ myocyte over the course of a train of 70 stimuli is reported in Fig. 4. For these two repolarization levels, the AP tended to become shorter with progression of the stimulation train (stimulation index). Linear regression and or higher order polynomial interpolation of APD input raw data successfully attenuated beat-to-beat variability caused by data structure and acquisition noise. Importantly, temporal trends of AP repolarization at 55% and 95% were preserved and properly characterized by the two regression approaches. With respect to the linear interpolation, increasing the regression order up to 5 did not bring any substantial change to the characterization of APD behavior. The similarity between the raw profiles and the regression curves for APD at the two repolarization levels corroborates the effectiveness of the proposed approach to describe alterations occurring in the AP over the course of a stimulation train.
Fig. 4:
Examples of approximations of the AP profile from a STZ mouse cardiomyocyte estimated through the direct approach at fixed levels of repolarization (upper traces: 95% of repolarization; lower traces: 55% of repolarization). Blue lines, dashed red lines and solid red lines correspond to the raw data, linear regression and 5th-order polynomial approximation, respectively.
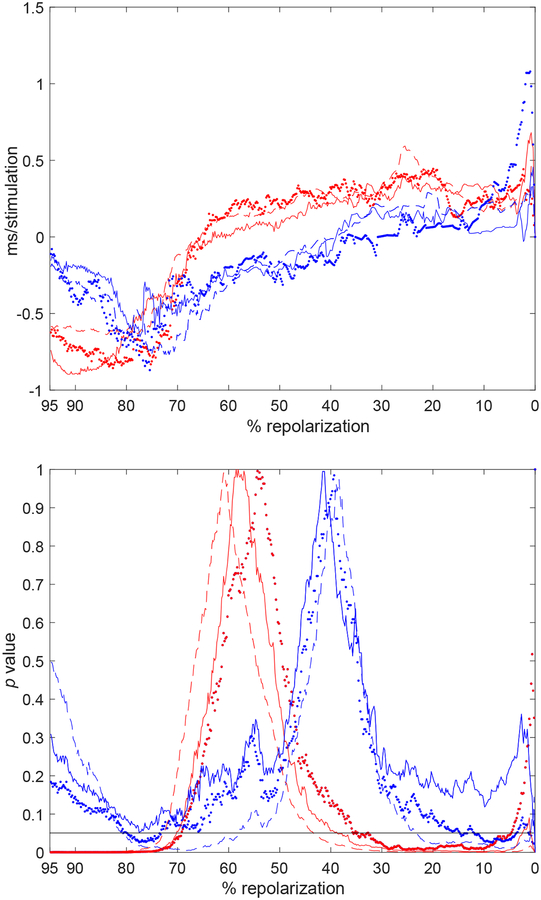
Subsequently, we evaluated whether the direct processing stage allowed a quantification of the response of CTRL and STZ cells to the train of stimulation (temporal trends). For this purpose, the first derivative for regression curves of APD was obtained for the entire repolarization phase; their mean was calculated and normalized by the mean duration of the APD (APTDIR). This processing stage allowed us to define direction and magnitude of AP changes over time. Overall, for both CTRL and STZ myocytes, APTDIR differed from zero, indicating that the repolarization phase was altered (i.e., became longer or shorter) during the stimulation train (Fig. 5, upper panel). Then, signed rank test median statistic of APTDIR was employed to establish whether detected temporal trends for the repolarization profile of CTRL and STZ myocytes were statistically significant (Fig. 5, lower panel).
Fig. 5:
Upper panel: Median value of the signed rank test for the APTDIR index computed throughout the entire repolarization using raw data (dotted lines), linear regression (dashed lines), and 5th-order polynomial approximation (solid lines) for APs obtained in CTRL (blue traces) and STZ (red traces) myocytes. Lower panel: p value of the corresponding signed rank test applied to each parameter. Black horizontal line is in correspondence of p=0.05.
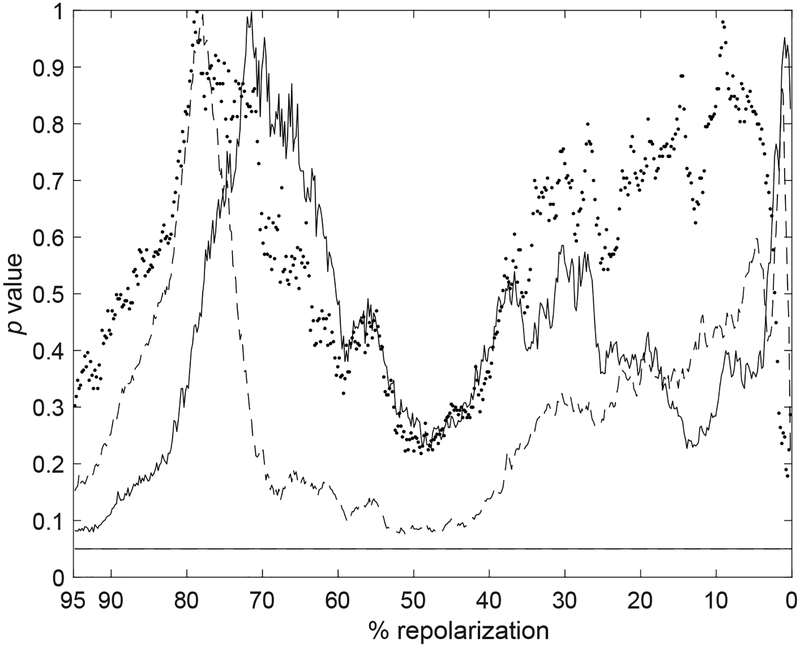
For both group of cells, APTDIR was positive in the early repolarization phase, consistent with a progressive prolongation of this portion of the AP. In contrast, APTDIR was negative in the late repolarization, reflecting a progressive shortening of this phase of the AP for CTRL and STZ myocytes. Importantly, the transition of APTDIR from positive to negative values occurred at ~ 40% and ~ 60% of the repolarization phase for the AP of CTRL and STZ cells, respectively, indicating that adaptations of the AP profile to a stimulation train tended to be different in the two groups of cells. However, statistical analysis by unpaired Wilcoxon rank-sum test of APTDIR plots computed from raw data, linear regression, or 5th-order polynomial interpolation revealed that differences in the temporal adaptation of the AP of CTRL and STZ myocytes did not reach statistical significance (Fig. 6). Overall, our methodology involving direct processing of electrical signals allow a comprehensive quantification of alterations occurring in the profile of the AP during a train of stimulation.
Fig. 6:
Statistical comparison of APTDIR obtained for CTRL and STZ groups throughout the entire repolarization range. p value of the unpaired Wilcoxon rank-sum test for APTDIR parameters computed using raw data (dotted lines), linear regression (dashed lines), and 5th-order polynomial approximation (solid lines) for the entire repolarization are reported. Black horizontal line is in correspondence of p=0.05.
3.3. Evaluation of AP repolarization properties by ESVD of electrical signals
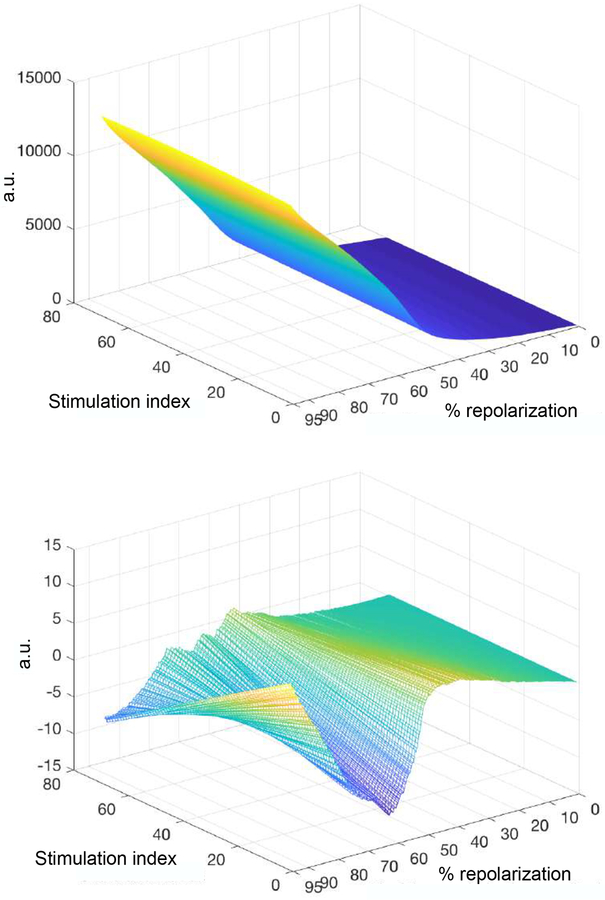
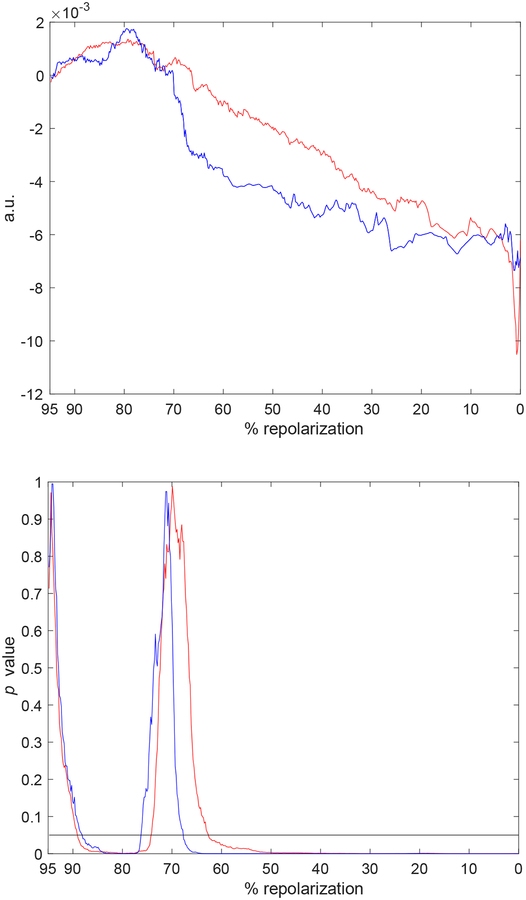
The use of matrices for the computation of the AP profile over the course of stimulation allowed us to implement matrix decomposition approaches to quantify changes of the AP. Thus, a signal processing involving evolutive singular value decomposition (ESVD) method was employed to establish the ability of this approach to capture temporal adaptations occurring in CTRL and STZ myocytes. In Fig. 7, a representative example of processed polynomials referring to a sequence of APs over the course of a stimulation train (stimulation index) is reported (upper panel), together with derivatives of polynomial function with respect to the stimulation train (lower panel). To quantify temporal trends of the repolarization profile, the signed rank test median value of APTESVD was computed for the entire repolarization for CTRL and STZ myocytes (Fig. 8, upper panel). Signed rank test was then employed to establish whether detected temporal trends for the repolarization profile were significantly different from zero (Fig. 8, lower panel). In order to allow an interpretation of these results it should be noted that the model underlying the ESVD is for each repolarization level r. This implies that polynomials capture the deviations from the common behavior (i.e., common trend) represented by . Since and are positive in practice, a positive value for the mean derivative of multiplied by the sign of the mean derivative of , i.e., APTESVD, indicates a reinforcement of the trend. In contrast, negative values for APTESVD indicate that alterations of AP duration at given repolarization levels are attenuated with respect to the common trend.
Fig. 7:
Upper panel: Representative example of approximation of the AP profile for a STZ myocyte during the course of stimulation (stimulation index) through dimensionless multiplicative polynomials calculated by ESVD method. a.u.: arbitrary units. Lower panel: Plot illustrating first-order derivatives.
Fig. 8:
Upper panel: Median value returned by the signed rank test for APTESVD computed through ESVD on each dataset; a.u.: arbitrary units. Lower panel: p value of the corresponding signed rank test applied to the ESVD-derived parameters. Blue and red lines correspond to the CTRL and the STZ groups, respectively. Black horizontal line is in correspondence of p=0.05.
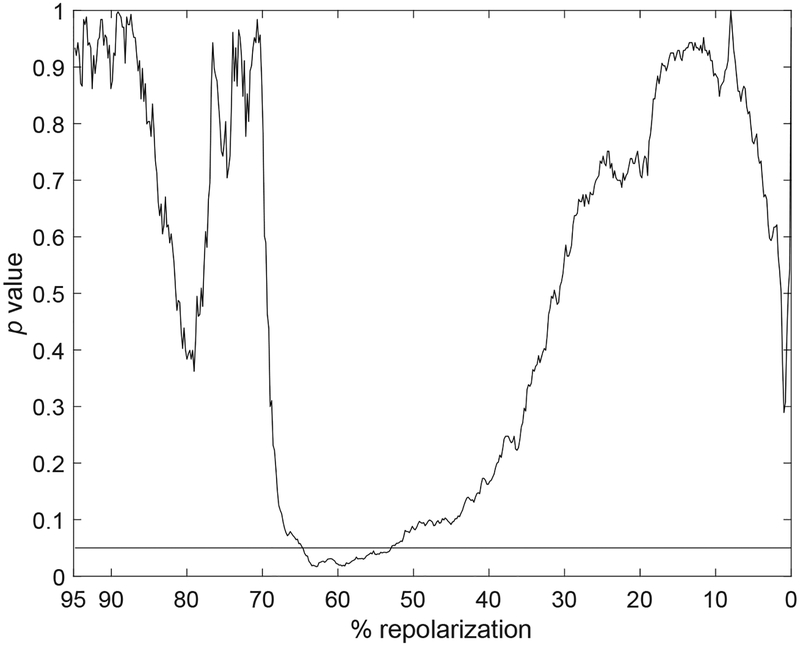
By this analysis, APs from STZ myocytes tended to reinforce the common trend in the late repolarization, whereas the behavior was less pronounced in the early phase. A similar behavior was observed for APs of CTRL cells. The change in APD dynamics (transition from reinforcement to attenuation) occurred approximately at ~70% of the electrical recovery, for the STZ and CTRL cells. By rank-sum test of APTESVD performed on the entire repolarization, it was found that, by ESDV processing, the temporal adaptation of the AP of CTRL and STZ myocytes, was significantly different only in the interval ~50 – 65% of the repolarization phase (Fig. 9). Thus, ESDV analysis provides complementary information with respect to direct processing of electrical signals.
Fig. 9:
Statistical comparison of APTESVD obtained for CTRL and STZ groups throughout the entire repolarization range: p value using the unpaired Wilcoxon rank-sum test applied to parameters extracted through ESVD. Black horizontal line is in correspondence of p=0.05.
3.4. Repolarization algorithms and electrical signals collected in the intact myocardium
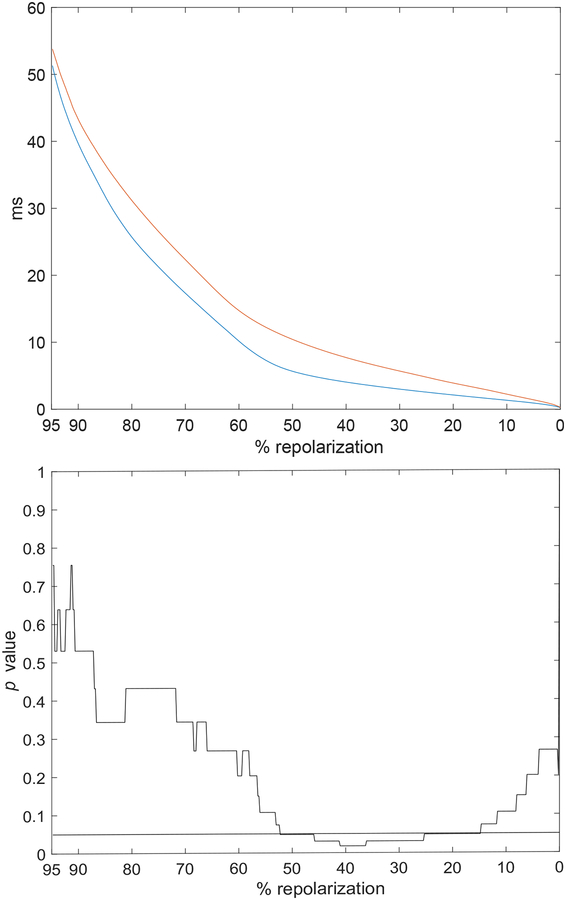
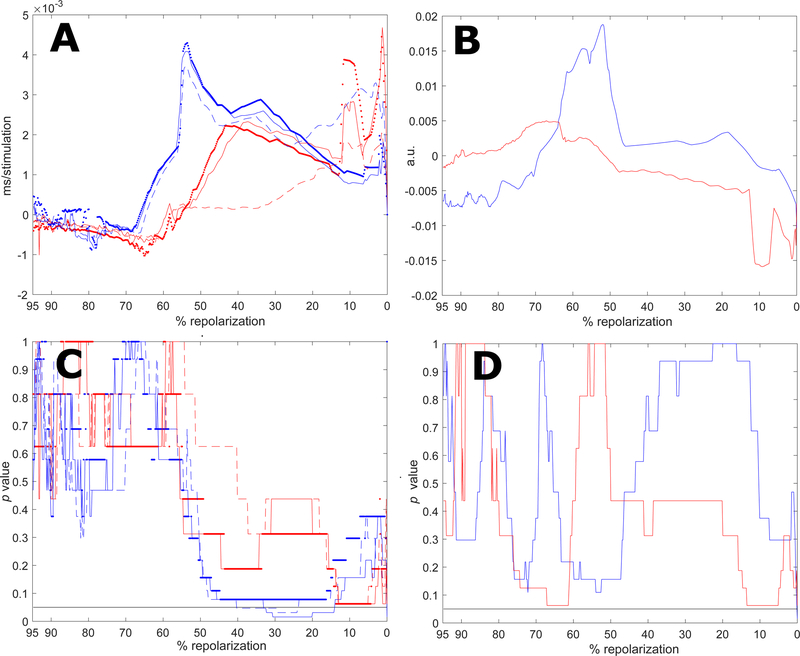
To establish whether processing of electrical signals by direct approach and ESVD methodologies were applicable to extracellular recordings obtained in the intact myocardium, a sequence of monophasic action potentials (MAPs) recorded in Langendorff perfused hearts from CTRL and STZ mice were analyzed. The mean profile of the MAP repolarization was prolonged in STZ hearts (n=5), with respect to CTRL (n=7) (Fig. 10, upper panel). Consistent with previous observation [2], the difference was statistically significant in the range of 15%–55% of the repolarization phase (Fig. 10, lower panel). Temporal alterations for the repolarization phase of MAPs were then assessed in 40 consecutive beats for hearts stimulated at 8Hz, by direct and ESVD approaches. For each heart, we elected to restrict our analysis to 40 MAPs to avoid inclusion of electrical signals contaminated by motion artifacts and/or probe displacement occurring during the acquisition. The direct approach revealed a tendency for a prolongation of the early phase of the MAP in CTRL and STZ hearts, whereas the late repolarization remained stable, or slightly shortened (Fig. 11, A). The prolongation of MAPs for CTRL hearts reached statistical significance in a small portion of the early repolarization phase (Fig. 11, C). Overall, no statistical differences were observed between CTRL and STZ hearts for alterations occurring in MAP profile during the course of stimulation (data not shown). In a comparable manner, ESVD approach revealed alterations in the early and late repolarization phases of MAPs for CTRL and STZ heart (Fig. 11, B), but these changes were not significant (Fig. 11, D). Importantly, statistical comparison indicated that temporal behavior of MAPs for CTRL and STZ hearts differed, collectively, for ~ 10% of the repolarization phase. These findings reflect, at least in part, observations at the cellular levels.
Fig. 10:
Upper panel: Mean profile of MAPs obtained from CTRL (n=7, blue line) and STZ hearts (n=5, red line). Lower panel: Statistical comparison of MAP profile for CTRL and STZ hearts. Black horizontal line is in correspondence of p=0.05.
Fig. 11:
A: Median value of the signed rank test for APTDIR index computed throughout the entire repolarization using raw data (dotted lines), linear regression (dashed lines), and 5th-order polynomial approximation (solid lines) for MAPs obtained in CTRL (blue traces) and STZ (red traces) hearts. B: Median value of the signed rank test for APTESVD computed throughout the entire repolarization for CTRL (blue traces) and STZ (red traces) hearts. C: p value of signed rank test for APTDIR index computed using raw data (dotted lines), linear regression (dashed lines), and 5th-order polynomial approximation (solid lines) for CTRL (blue traces) and STZ (red traces) hearts. D: p value of signed rank for APTESVD for CTRL (blue trace) and the STZ (red trace) groups. Black horizontal line is in correspondence of p=0.05.
Thus, new developed methodologies are appropriate to process electrical signals collected in isolated cardiomyocytes and intact tissue.
4. Discussion and conclusions
4.1. Benefits from high-resolution assessment of cardiac repolarization
In this study we have developed methodologies to automatically assess the temporal adaptations of the AP of cardiomyocytes. To assess trends in the properties of APs elicited by a stimulation train, we have implemented two distinct approaches, sharing the same preprocessing stage (i.e., involving the inversion of the relation between membrane potential and time), in contrast to what is commonly performed for AP analysis. Standard methods in the time domain present transmembrane potential (expressed in mV or as percentage of repolarization of the AP) as a function of time. With our methodologies, we graphically displayed repolarization levels on the horizontal axis, and determined the corresponding duration on the vertical axis. The entire range of AP repolarization was analyzed with high resolution, and was not restricted to a limited set of user-defined, discrete levels, as commonly done. Moreover, the inversion preprocessing stage enabled the identification of patterns related to the duration of the repolarization phase and beat-to-beat variations. This is in contrast with time-domain approaches presenting transmembrane potential as a function of time, an aspect that renders these methodologies ideal for the analysis of amplitude and rates of depolarization/repolarization [11] rather than direct APD quantification.
Previously, we demonstrated that mean duration and variability of AP could be effectively determined through the preprocessing stage involving the inversion of the relation between transmembrane potential and time [2]. Specifically, our algorithm yielded results comparable to those obtained via standard approaches when evaluating APD at discrete levels of the repolarization phase. Results obtained here further corroborate the ability of our method to properly report AP repolarization characteristics and their modifications over time. The level of detail and resolution of our approach cannot be achieved with standard methodologies. With respect to the assessment of temporal alteration of repolarization, our direct and ESVD approaches accurately described alteration in AP profile and characterized the impact of a pathological condition on AP repolarization. Specifically, the direct approach identified that in control and diabetic cells APD tended to increase in the early phase of repolarization, whereas it progressively decreased in the late phase. However, the transition from progressive lengthening to progressive shortening of the duration of the AP was identified at different levels of the electrical recovery for CTRL and STZ myocytes. These results are consistent, at least in part, with physiological findings presented by Nobe and colleagues [12]. They reported that transition in APD dynamics occurred between 50% and 75% of the repolarization in rat cardiomyocytes, in the presence of the inhibition of calcium release from the sarcoplasmic reticulum. However, due to the limited resolution of the analysis, a precise evaluation of the transition level was not possible. In contrast, our high-resolution method captured changes in APD variation trend at 60% and 40% of repolarization for cells from STZ and healthy animals, respectively. Additionally, ESVD analysis revealed that, at the cellular level and in the intact myocardium, temporal behavior of the intermediate/late repolarization phase was different in CTRL and STZ groups. This feature would have not been identified when considering discrete, user-defined repolarization levels. Overall, our proposed methodologies offer higher detail in the assessment of AP repolarization properties with respect to commonly used, standard approaches.
4.2. Study limitations and future implementations
With this investigation we have documented the ability of our methodologies to detect temporal alterations occurring in the repolarization phase of the AP of isolated cardiomyocytes. Also, we have provided initial results on the suitability of our repolarization algorithm to characterize the profile of MAP and to monitor putative temporal alterations of the electrical activity of the intact myocardium. Thus, our results, which are merely methodological in nature, highlight the possibility to employ this computational platform for the analysis of electrical recordings collected in single cells, multicellular preparations, and myocardium.
Isolated cells lack the influence of cell-to-cell interactions and electrical coupling present in the myocardium. Thus, whether reported temporal alterations of AP profile observed in isolated cells are present and occur with a comparable magnitude in vivo and in the intact myocardium remains to be properly addressed. We found minor temporal alterations for MAPs recorded in the entire heart. However, differences in pacing paradigms for our studies at the cellular and organ levels preclude a direct comparison of these two datasets. The effects of cell coupling on beat-to-beat variability may have important implication on the electrical stability of the heart under pathological conditions characterized by altered distribution and function of gap-junctions, as previously reported for diabetes [13]. Thus, altered behavior at the cellular level may have profound consequences on the entire myocardium under conditions affecting cell-to-cell coupling.
Methods presented here were applied to APs with a strictly decreasing repolarization phase, a typical feature of the electrical recovery of rodent cardiomyocytes. However, cells obtained from large mammals have APs with a prominent plateau phase [14–16] with repolarization not strictly decreasing. It is conceivable that segmentation of the AP repolarization represents a valid strategy for the application of our algorithms. To test this possibility, further studies are granted.
For similar reasons, methods presented here cannot be applied to AP presenting early afterdepolarizations. In a previous report [17], aberrant episodes were compared to normal APs by phase-plane plots, which exhibited oscillatory behavior in correspondence to their onset. However, the visual approach cannot be employed to quantitatively compute AP properties and does not allow the analysis of APD dynamics and statistical comparison between cell populations. We previously documented that increasing the rate of stimulation from 2 to 6 Hz progressively exacerbated differences between the AP of control and STZ myocytes [2]. In the current investigation, however, focus was placed on methodological aspects of our algorithms and, therefore, the analysis of AP properties in healthy and diabetic myocytes was restricted to a single frequency of stimulation. Based on presented results, our novel methodologies represent the ideal tools to evaluate the effects of stimulation rate on the temporal evolution of the AP in normal and diseased cells, aspects that will be addressed in future investigations.
The application of our analytical approach to electrical signal obtained by optical mapping [18, 19] or multielectrode array methodologies [20–22] has the potential to allow the combination of information on repolarization properties and pattern of electrical propagation and conduction velocity. Thus, the processing of field potentials and signals obtained from voltage-sensitive molecules may lead to new modalities of analysis for ex vivo and in vitro data.
In conclusion, we have implanted methodologies allowing detailed, automatic analysis of the AP repolarization and identification of critical alterations occurring in behavior of myocytes under pathological conditions.
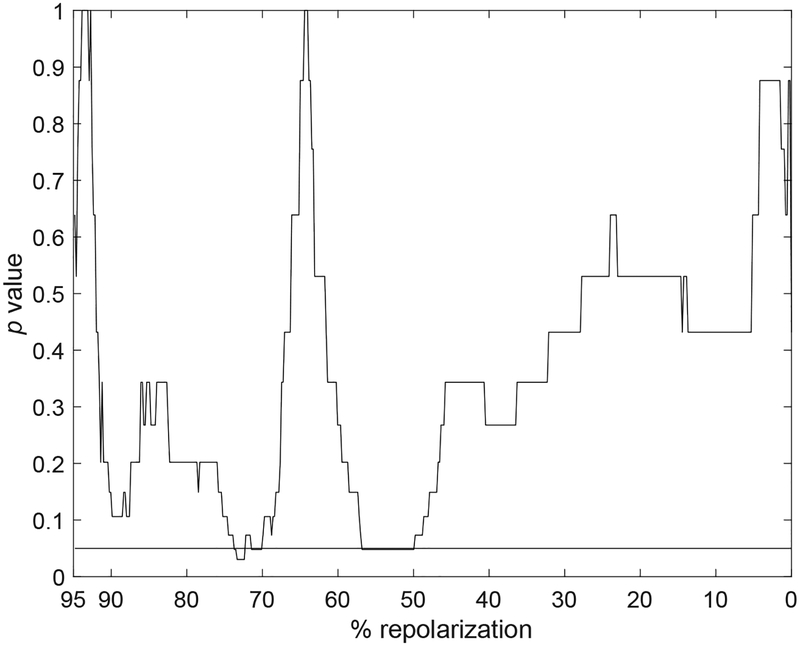
Fig. 12:
Statistical comparison of APTESVD obtained for CTRL and STZ MAPs groups throughout the entire repolarization range: p value using the unpaired Wilcoxon rank-sum test applied to parameters extracted through ESVD. Black horizontal line is in correspondence of p=0.05.
Acknowledgments
The authors have no disclosure to declare.
Grants
This work was supported in part by the National Institute of Health grant R01-AG-055407 and intramural resources at New York Medical College (NYMC) including funds from the NYMC Translation Science Institute. Dr Meo is funded by a Lefoulon-Delalande Foundation fellowship administered by the Institute of France.
Appendix: Computation of the ESVD solution
This section illustrates the main steps of the ESVD optimization algorithm to solve the problem:
| (A.1) |
| (A.2) |
It is worth noticing that in standard SVD functions pr are replaced by scalar values ar. That would imply that if vectors yr were shifted in time, vectors v would be shifted accordingly, but SVD coeffcients ar would be unaffected. In contrast, in Eq. (A.1) functions pr and v can both capture AP temporal structure, thus allowing for a simpler data interpretation than the one obtained by conventional SVD with higher decomposition order.
Assuming that the noise samples follow a normal centered law and are un-correlated, then the criterion to be minimized for the estimation of the vectors v and the θr can be written as:
| (A.3) |
Accordingly, the solutions v and θr for this problem can be determined as:
| (A.4) |
This can be demonstrated by examining all the partial derivatives :
| (A.5) |
By imposing the stationarity conditions, i.e., , we can compute for all r:
| (A.6) |
The functional J can be rewritten as:
| (A.7) |
and can be simplified to:
| (A.8) |
where diag(.) stands for the diagonal matrix. Assuming stationary conditions with respect to v, i.e., , gives:
| (A.9) |
The vector v fulfilling this condition can be estimated as:
| (A.10) |
By using in sequence Eq. (A.2), Eq. (A.6) and Eq. (A.10), an alternated least square algorithm can be applied to determine the model unknowns. The initialization could be performed by choosing initial v in Eq. (A.6) as the standard mean of all the observations yr. Nevertheless, according to this formulation, the solution obtained is not unique, as multiplying v by a scalar is equivalent to multiplying pr by its inverse, yielding the same yr. This issue can be fixed by imposing the unit norm constraint over v. Since the optimization process is iterative, this normalization is directly included in the computation of Eq. (A.10). Therefore, after convergence of the algorithm we obtain the approximation:
| (A.11) |
In order to obtain a global overview of data structure, we can compute polynomials’ barycenter as the center of gravity of the input observations. To this end, the expression in Eq. (A.11) can be rewritten as:
| (A.12) |
Accordingly, we obtain the necessary equality . The mean value of the observations can be computed by averaging both sides of the expression in Eq. (A.12) and using the aforementioned equality:
| (A.13) |
It turns out that can be computed as:
| (A.14) |
The unit norm constraint applied to enables the computation of the α value:
| (A.15) |
The computation of the modified polynomials used as descriptive features of the AP profile is finally given by the solution of the equation:
| (A.16) |
which is:
| (A.17) |
Footnotes
Publisher's Disclaimer: This is a PDF file of an unedited manuscript that has been accepted for publication. As a service to our customers we are providing this early version of the manuscript. The manuscript will undergo copyediting, typesetting, and review of the resulting proof before it is published in its final citable form. Please note that during the production process errors may be discovered which could affect the content, and all legal disclaimers that apply to the journal pertain.
References
- [1].Sperelakis N, Shumaker HK, Phase-plane analysis of cardiac action potentials, Journal of Electrocardiology 1 (1) (1968) 31–41. doi: 10.1016/S0022-0736(68)80006-8. [DOI] [PubMed] [Google Scholar]
- [2].Meo M, Meste O, Signore S, et al. , Reduction in Kv current enhances the temporal dispersion of the action potential in diabetic myocytes: insights from a novel repolarization algorithm., Journal of the American Heart Association 5 (2) (2016) e003078. doi: 10.1161/JAHA.115.003078. [DOI] [PMC free article] [PubMed] [Google Scholar]
- [3].Sorrentino A, Borghetti G, Zhou Y, et al. , Hyperglycemia induces defective Ca2+ homeostasis in cardiomyocytes, American Journal of Physiology-Heart and Circulatory Physiology 312 (2017) H150–H161. doi: 10.1152/ajpheart.00737.2016. [DOI] [PMC free article] [PubMed] [Google Scholar]
- [4].Meste O, Meo M, Signore S, Rota M, A new tool for the action potential repolarization dynamic analysis: application to the discrimination of diabetic and control cells, in: Computing in Cardiology Conference (CinC), 2016, IEEE, 2016, pp. 261–264. doi: 10.23919/CIC.2016.7868729. [DOI] [Google Scholar]
- [5].Signore S, Sorrentino A, Borghetti G, et al. , Late Na(+) current and protracted electrical recovery are critical determinants of the aging myopathy, Nature Communications 6 (2015) 8803. doi: 10.1038/ncomms9803. [DOI] [PMC free article] [PubMed] [Google Scholar]
- [6].Borghetti G, Eisenberg CA, Signore S, et al. , Notch signaling modulates the electrical behavior of cardiomyocytes, American Journal of Physiology-Heart and Circulatory Physiology 314 (2018) H68–H81. doi: 10.1152/ajpheart.00587.2016. [DOI] [PMC free article] [PubMed] [Google Scholar]
- [7].Meste O, Meo M, Signore S, Rota M, Diabetes affects the temporal dynamics of the repolarization properties of cardiomyocytes, in: Computing in Cardiology Conference (CinC), 2015, IEEE, 2015, pp. 153–156. doi: 10.1109/CIC.2015.7408609. [DOI] [Google Scholar]
- [8].Cabasson A, Meste O, Blain G, Bermon S, Quantifying the PR interval pattern during dynamic exercise and recovery, IEEE Transactions on Biomedical Engineering 56 (11) (2009) 2675–2683. doi: 10.1109/TBME.2009.2028694. [DOI] [PubMed] [Google Scholar]
- [9].Lawson CL, Hanson RJ, Solving least squares problems, Vol. 15, Siam, 1995. doi: 10.1137/1.9781611971217. [DOI] [Google Scholar]
- [10].Madrigal P, Krajewski P, Uncovering correlated variability in epigenomic datasets using the Karhunen-Loeve transform, BioData Mining 8 (1) (2015) 20. doi: 10.1186/s13040-015-0051-7. [DOI] [PMC free article] [PubMed] [Google Scholar]
- [11].Hodgkin AL, Katz B, The effect of temperature on the electrical activity of the giant axon of the squid, The Journal of Physiology 109 (1–2) (1949) 240–249. [DOI] [PMC free article] [PubMed] [Google Scholar]
- [12].Nobe S, Aomine M, Arita M, et al. , Chronic diabetes mellitus prolongs action potential duration of rat ventricular muscles: circumstantial evidence for impaired Ca2+ channel, Cardiovascular Research 24 (5) (1990) 381–389. doi: 10.1093/cvr/24.5.381. [DOI] [PubMed] [Google Scholar]
- [13].Nygren A, Olson ML, Chen KY, et al. , Propagation of the cardiac impulse in the diabetic rat heart: reduced conduction reserve., The Journal of Physiology 580 (2007) 543–560. doi: 10.1113/jphysiol.2006.123729. [DOI] [PMC free article] [PubMed] [Google Scholar]
- [14].Rota M, Vassalle M, Patch-clamp analysis in canine cardiac Purkinje cells of a novel sodium component in the pacemaker range, Journal of Physiology 548 (1) (2003) 147–165. doi: 10.1113/jphysiol.2003.039263. [DOI] [PMC free article] [PubMed] [Google Scholar]
- [15].Signore S, Sorrentino A, Ferreira-Martins J, et al. , Inositol 1,4,5-trisphosphate receptors and human left ventricular myocytes, Circulation. (2013) 1286–1297 doi: 10.1161/CIRCULATIONAHA.113.002764. [DOI] [PMC free article] [PubMed] [Google Scholar]
- [16].Sorrentino A, Signore S, Qanud K, et al. , Myocyte repolarization modulates myocardial function in aging dogs, American Journal of Physiology-Heart and Circulatory Physiology 310 (7) (2016) H873–H890. doi: 10.1152/ajpheart.00682.2015. [DOI] [PMC free article] [PubMed] [Google Scholar]
- [17].Boutjdir M, Restivo M, Wei Y, et al. , Early afterdepolarization formation in cardiac myocyte, Journal of Cardiovascular Electrophysiology 5 (7) (1994) 609–620. doi: 10.1111/j.1540-8167.1994.tb01302.x. [DOI] [PubMed] [Google Scholar]
- [18].Beauchamp P, Desplantez T, McCain ML, et al. , Electrical coupling and propagation in engineered ventricular myocardium with heterogeneous expression of connexin43., Circulation Research 110 (2012) 1445–1453. doi: 10.1161/CIRCRESAHA.111.259705. [DOI] [PMC free article] [PubMed] [Google Scholar]
- [19].Herron TJ, Lee P, Jalife J, Optical imaging of voltage and calcium in cardiac cells & tissues., Circulation Research 110 (2012) 609–623. doi: 10.1161/CIRCRESAHA.111.247494. [DOI] [PMC free article] [PubMed] [Google Scholar]
- [20].Rossi S, Baruff S, Bertuzzi A, et al. , Ventricular activation is impaired in aged rat hearts, American Journal of Physiology-Heart and Circulatory Physiology 295 (2008) H2336–H2347. doi: 10.1152/ajpheart.00517.2008. [DOI] [PubMed] [Google Scholar]
- [21].Camelliti P, Al-Saud SA, Smolenski RT, et al. , Adult human heart slices are a multicellular system suitable for electrophysiological and pharmacological studies., Journal of Molecular and Cellular Cardiology 51 (2011) 390–398. doi: 10.1016/j.yjmcc.2011.06.018. [DOI] [PubMed] [Google Scholar]
- [22].Kienast R, Stöger M, Handler M, et al. , Alterations of field potentials in isotropic cardiomyocyte cell layers induced by multiple endogenous pacemakers under normal and hypothermal conditions., American Journal of Physiology-Heart and Circulatory Physiology 307 (7) (2014) H1013–H1023. doi: 10.1152/ajpheart.00097.2014. [DOI] [PubMed] [Google Scholar]


