Abstract
Kidney handling of electrolytes varies in different stages of chronic kidney disease (CKD). Diabetes mellitus (DM) plays an important role in CKD. Fractional excretion (FE) is an important means in clinical practice. The relationship between FE of electrolytes in patients at different stages of CKD is worth further investigating.
We designed a cross-sectional study in 1 teaching hospital, consecutive CKD patients were enrolled between February 2016 and January 2017. Including clinical demographic features, laboratory examination including spot urine electrolytes, blood biochemistries, and relevant medications were determined.
A total of 762 CKD patients completed the study. Of these, 218 (28.6%) had DM. Participants were grouped according to estimated glomerular filtration rate into 7 categories: hyperfiltration (HF), CKD1, CKD2, CKD3a, CKD3b, CKD4, and CKD5. Groups HF, CKD1, 2, 3a, 3b, 4 and 5 contained 83, 143, 192, 94, 82, 82, and 86 patients, respectively. FE of electrolytes tended to increase along with the decline of renal function (CKD1–CKD5) (P < .001). The relationship was similar between the DM and non-DM groups. Diabetic patients demonstrated higher FE of magnesium compared with non-DM subjects at CKD2 and CKD5 (P < .05).
CKD patients showed a progressive increase in the FE of electrolytes; FE of magnesium seemed to increase more among diabetic patients with CKD, and could be a potential predictor of CKD progression.
Keywords: chronic kidney disease, fractional excretion, urine biochemistry, urine electrolytes
1. Introduction
The kidney plays a crucial role in the regulation of electrolytes and acid–base homeostasis.[1] To investigate the relationship between blood and urine biochemical changes in patients with kidney disease and electrolytes disorders, it is preferable to perform fraction excretion rate of electrolytes (FEX). The assessment of urine electrolytes excretion rate with either a 24-hour or spot urine collection is a recognized first step.[2–5] Spot urine sample measurement of the urine electrolytes concentration is simple to perform and has been explored as a reliable alternative method compared with a 24-hour urine sample collection in clinical practice.[2–7] The FEX, or the fraction excretion rate of electrolytes (FEX (%) = [Urine X (mmol/L, or mg/dL) × serum creatinine (mg/dL)/serum X (mmol/L, or mg/dL) × urine creatinine (mg/dL)] × 100%, where X stands for electrolyte), is traditionally used in the diagnosis of electrolyte imbalances and in the differentiation of kidney diseases.[8–11] FEX values denote electrolytes excretion ability corresponding to urinary creatinine excretion. It is known that urine potassium excretion decreases along with the reduction of renal function.[12] However, the application of FEX in different stages of chronic kidney disease (CKD) is still limited and rarely mentioned. Diabetes mellitus (DM) plays an important role in CKD and remains the most common cause of dialysis among all kidney diseases.[13] The aim of this study was to inspect the differences in the relationship between urine electrolytes and FEX associated with different stages of CKD.
2. Materials and methods
2.1. Study population and data collection
The cross-sectional study protocol was approved by the Ethics Committee on Human Studies at Tri-Service General Hospital, Taipei, Taiwan. All patients were consecutively enrolled from February 2016 to January 2018, with a diagnosis of CKD according to the criteria outlined in Kidney Disease: Improving Global Outcomes.[14] In this study, all CKD patients received their regular medications such as cardiovascular drugs and antidiabetic drugs. Estimated glomerular filtration rate (eGFR) was calculated using the abbreviated Modification of Diet in Renal Disease Study Group equation in this study: eGFR = 186 × Creatinine−1.154 × Age−0.203 (× 1 if male, × 0.742 if female).[15] Albuminuria, especially urine albumin-to-creatinine ratio [ACR] >30 mg/g, is also considered to be a marker of CKD despite being within the normal eGFR range.[16] Each CKD patient in our study had been classified into 1 of 7 groups according to eGFR and [ACR]; these groups were hyperfiltration (HF) (eGFR >125 mL/min per 1.73 m2, and [ACR] >30 mg/g), CKD1 (eGFR 90–125 mL/min per 1.73 m2), CKD2 (eGFR 60–89 mL/min per 1.73 m2), CKD3a (eGFR 45–59 mL/min per 1.73 m2), CKD3b (eGFR 30–44 mL/min per 1.73 m2), CKD4 (eGFR 15–29 mL/min per 1.73 m2), and CKD5 (eGFR <15 mL/min per 1.73 m2 or treatment by dialysis). Demographic features, biochemical data including available blood and spot urine sample results (uric acid, sodium, potassium, chloride, calcium, phosphate, and magnesium), and relevant medications were investigated. Including nephrologists, dietitians, and nurses were involved in this study. Only CKD patients on the educational program for CKD with a fixed diet regimen were included. Patients with definite diagnosis of history of periodic paralysis, Bartter syndrome, Gitelman syndrome, and renal tubular acidosis were not involved in this study. These comorbidity factors may have stronger effects on electrolytes excretion than CKD. To avoid other potential confounders and focus on the target population of stable CKD patients, we excluded patients with acute kidney injury, massive hematuria, renal transplant, dialysis treatment, bladder irrigation, prior creation of a neobladder, pregnancy, obstructive uropathy, and age younger than 18. Medical records including patient characteristics, clinical presentations, laboratory values, and use of diuretic drugs were reviewed.
2.2. Data processing and analysis
The following clinical data were analyzed: gender, age, body mass index (BMI), clinical biochemistry, medications including diuretics, and agents for treating hyperuricemia. Particular attention was given to comparing the laboratory data including serum creatinine (SCr), blood urea nitrogen, hemoglobin, electrolytes [sodium (Na+), potassium (K+), chloride (Cl-), calcium (Ca2+), phosphorus (P), magnesium (Mg2+)], biochemistry [uric acid (UA), albumin, total bilirubin], urine biochemistry [urine creatinine (UCr), urine Na+ (UNa), urine K+ (UK), urine Cl-, urine Ca2+ (UCa), urine phosphorus, urine Mg2+, and urine uric acid]. Samples of blood and spot urine were simultaneously collected for measurement. Blood and urine biochemistries were determined by automated methods (AU 5800 chemistry analyzer; Olympus, Tokyo, Japan). We used the formula for fraction excretion rate of electrolytes as FEX (%) = [Urine X (mmol/L, or mg/dL) × serum creatinine (mg/dL)/serum X (mmol/L, or mg/dL) × urine creatinine (mg/dL)] × 100 (%), where X stands for the electrolyte. Thus, the recorded measures included FEUA, FENa, FEK, FECl, and FEP. FEMg = [Urine Mg (mg/dL) × serum creatinine (mg/dL)/serum Mg2+ (mg/dL) × urine creatinine (mg/dL) × 0.7] × 100 (%) due to the fact that 30% of serum Mg2+ is bound to albumin and is therefore inactive. FECa= [Urine Ca2+ (mg/dL) × serum creatinine (mg/dL)/serum Ca2+ (mg/dL) × urine creatinine (mg/dL) × 0.5] × 100% due to the fact that 50% of serum Ca2+ is bound to albumin and is therefore inactive.[17–19]
2.3. Statistical analysis
Descriptive statistical of categorical variables were reported as numbers and percentage, while continuous variable were expressed as mean ± standard deviation. Patients’ spot urine data were examined with ANOVA in the trend of CKD stage. Furthermore, we divided each CKD stage groups into DM and non-DM, and examined with independent t test. All P values were 2-sided and P < .05 was considered statistically significant. All statistical analyses were performed with IBM SPSS statistical software version 22 for Windows (IBM Corp, Armonk, NY).
3. Results
3.1. Patients’ characteristics
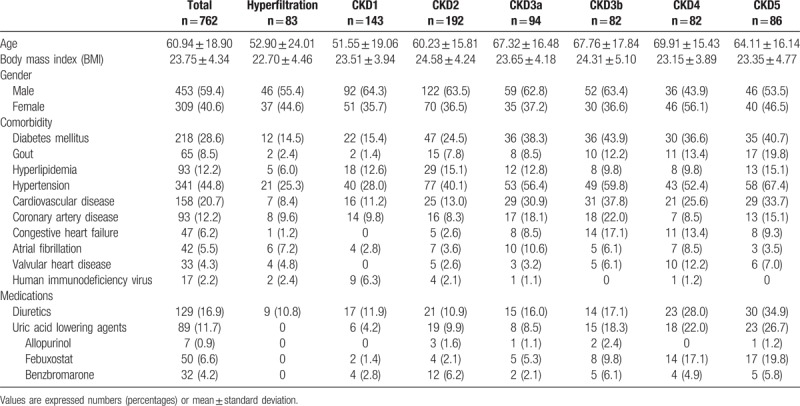
A total of 772 CKD patients were initially included in this study. We then excluded 4 and 6 patients due to missing data on SCr and UCr in this study. Thus a total of 762 patients met the eligibility criteria (Fig. 1). The mean age was 60.94 ± 18.90 years, and 453 patients were male (59.4%). The clinical characteristics of these 762 patients were as follows: 218 patients (28.6%) with DM, 65 (8.5%) with gout, 93 (12.2%) with hyperlipidemia, 341 (44.8%) with hypertension, 158 (20.7%) with cardiovascular disease, 47 (6.2%) with congestive heart failure. There were 129 patients (16.9%) using diuretics. There were 89 patients (11.7%) receiving UA lowering agents, 7 patients (0.9%) taking allopurinol, 50 patients (6.6%) on febuxostat, and 32 patients (4.2%) taking benzbromarone (Table 1).
Figure 1.
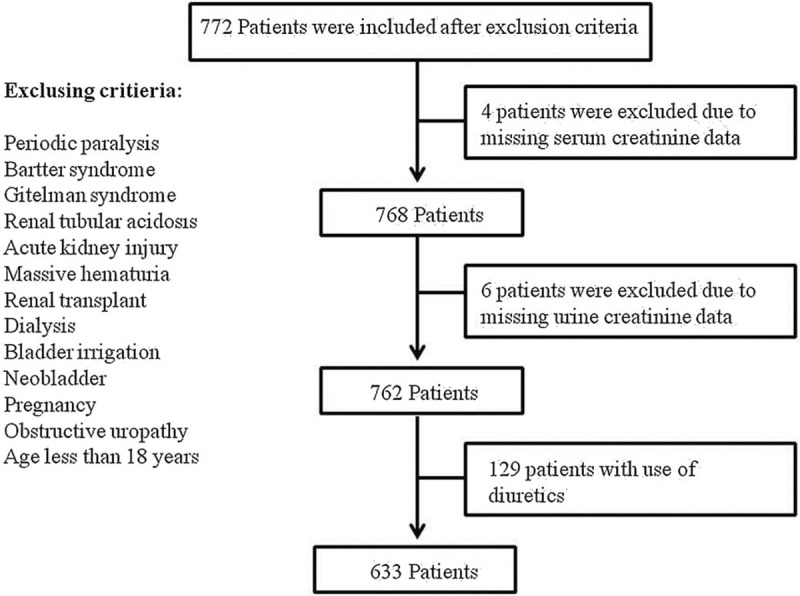
Cross-sectional study design.
Table 1.
Demographic characteristics in patients at different stages of CKD.
3.2. Blood and urine biochemistry
Table 2 presents the distribution of clinical laboratory data. These 762 patients had a mean SCr of 1.85 ± 2.18 mg/dL, mean eGFR of 70.11 ± 48.07 ml/min/1.73 m2, mean UA of 6.51 ± 2.82 mg/dL, mean Na+ of 136.60 mmol/L, mean K+ of 3.90 ± 0.81 mmol/L, mean Cl- of 102.37 ± 9.71 mmol/L, mean Ca+2 of 8.97 ± 0.94 mg/dL, mean P of 3.57 ± 1.32 mg/dL, and mean Mg+2 of 2.07 ± 0.42 mg/dL. Urine biochemistry revealed a mean UCr of 94.16 ± 80.48 mg/dL, mean urine uric acid of 36.53 ± 26.08 mg/dL, mean UNa of 71.01 ± 40.52 mmol/L, mean UK of 31.11 ± 22.05 mmol/L, mean urine Cl- of 74.82 ± 44.09, mean urine Ca2+ of 6.91 ± 6.95 mg/dL, mean UP of 38.46 ± 33.05 mg/dL, and mean urine Mg2+ of 5.07 ± 3.71 mg/dL. FEX analysis revealed a mean FEUA of 11.3%, mean FENa of 2.07%, mean FEK of 20.59%, mean FECl of 2.71%, mean FECa of 1.71%, mean FEP of 23.54%, and mean FEMg of 6.6%. FEUA and FECa, which reached its nadir in CKD2, but FEX results tended to increase from CKD1 to CKD5 and had statistical significant (P < .001) (Table 2). To eliminate the effects of diuretics, we further excluded the 129 patients (16.9%) who were using diuretics. Our analysis of the remaining 633 patients not using diuretics revealed similar trends in FEX results (Fig. 2).
Table 2.
Biochemical blood and urine data in patients at different stages of CKD.
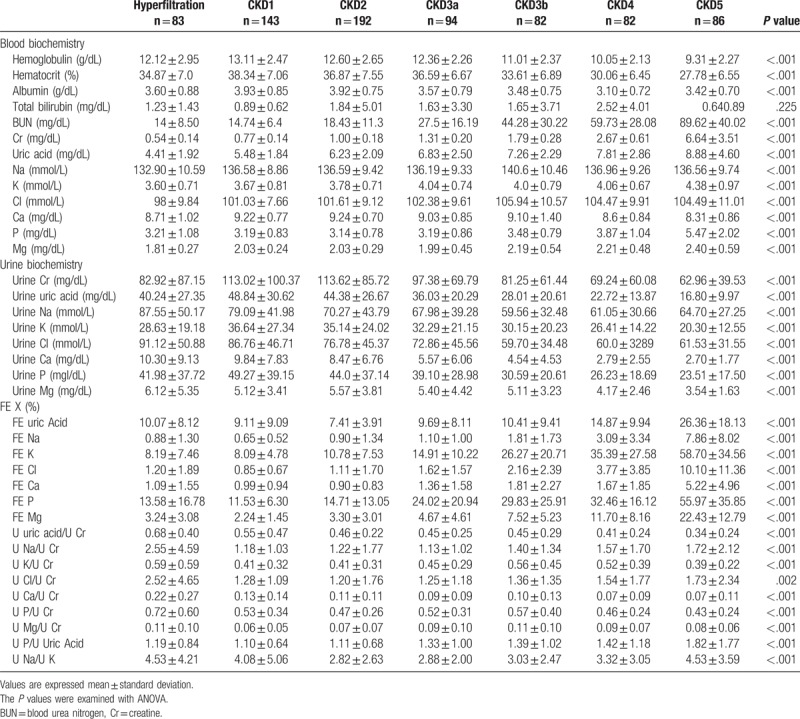
Figure 2.
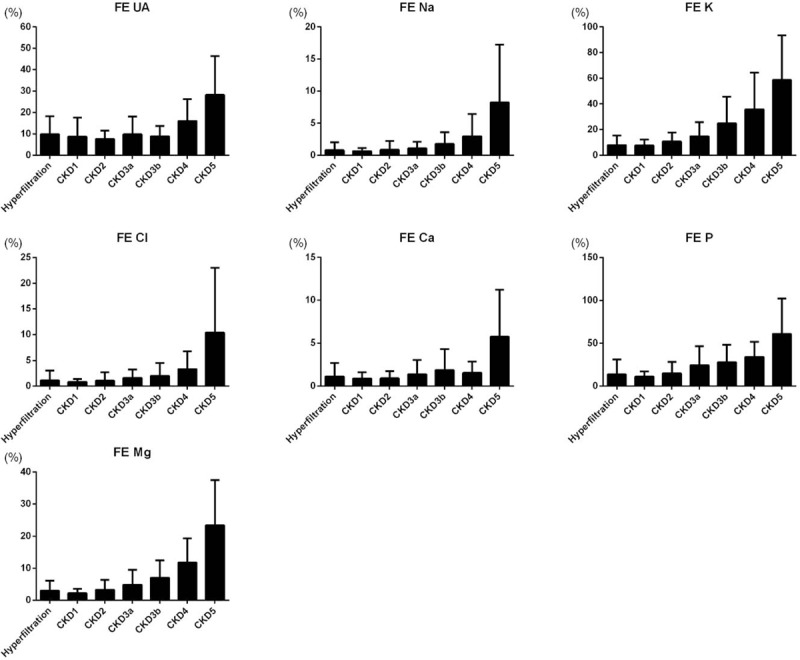
The fractional excretion (FE) of electrolytes among different stages of CKD patients (n = 633). CKD = chronic kidney disease.
3.3. Differences in FEX among CKD patients with and without diabetes mellitus (DM)
We further analyzed the remaining 633 patients for any differences in FEX between diabetic (n = 161) and nondiabetic (n = 472) patients. No obvious differences in FEX between the 2 groups were noted, but FEMg had a relatively higher value in diabetic patients. And this difference reached significance in CKD2 and CKD5 (P < .05) (Fig. 3).
Figure 3.
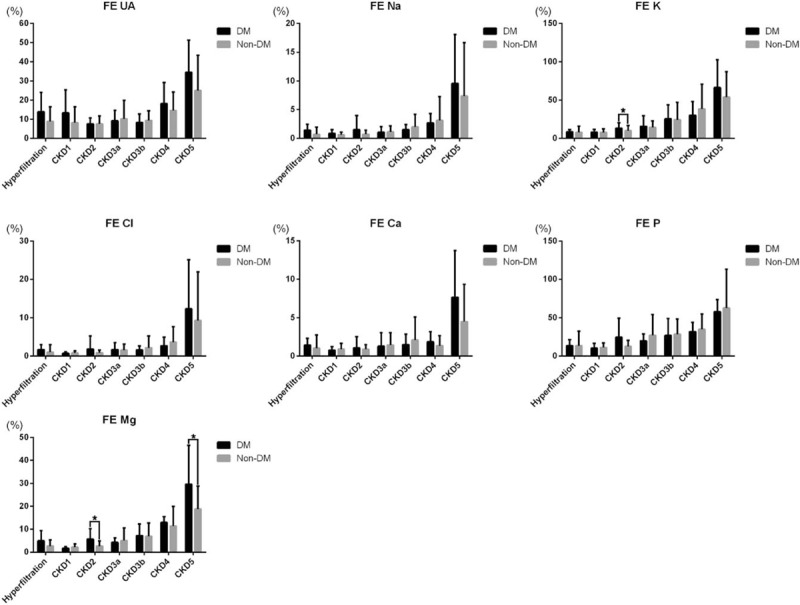
Comparison of fractional excretion (FE) of electrolytes among CKD patients with (n = 161) and without (n = 472) diabetes mellitus (DM). Differences were compared using the independent t test, and ∗presented P < .05. CKD = chronic kidney disease.
4. Discussion
In this cross-sectional, we investigated the correlations of renal excretion of different electrolytes in patients at different stages of CKD. The major significant findings of this study were as follows: The existence of certain differences in FEX results associated with different stages of CKD was established. Values of FEX for most electrolytes tended to increase during progression through the CKD stages (i.e., values were lowest in CKD1 and highest in CKD5); DM and non-DM patients had some differences in the FEX results associated with the different stages of CKD. The overall trends in FEX during CKD progression were the same in DM and non-DM patients. In the following subsections, our findings regarding each electrolyte and the major 2 findings in the study will be reviewed and discussed.
4.1. Uric acid (UA) handling in CKD
In this study, we observed that uricosuria was higher in stages HF and CKD1 than in CKD2, which may be attributed to glomerular hyperfiltration. The cause of the drop in FEUA in CKD2 and CKD3b still needs to be determined; we speculated, however, that possible causes may include impaired tubular secretion, increased tubular resorption, or a combination of these. Kannangara et al[20] have suggested that measuring FEUA through spot urine sampling could overcome some of the uncertainties related to the inconvenience and frequent unreliability of 24-hour urine collection.
FEUA is approximately independent of glomerular kidney function for subjects with reasonable renal function. The kidney plays an important role in the regulation of UA by reabsorbing around 90% of filtration and is also responsible for 60% to 70% of total body UA excretion. In adult humans, FEUA is around 10% (range 7% to 12%); this figure is usually higher in women than in men. FEUA is higher in children, averaging 35% in newborns, 13% to 26% in children less than 1 year old, and then decreasing progressively to adult levels in spite of increasing UA filtered load.[21–23] Renal UA handling involves a complex interplay of absorptive and secretory transport pathways, primarily in the renal proximal tubule; this process is mediated by incompletely understood molecular mechanisms. It is possible that impairment of the absorptive pathways in CKD3b results in the observed increase of FEUA. FEUA has been shown to remain quite stable, increasing only marginally even when GFR is down to 30 mL/min.[21]
4.2. Sodium (Na+), chloride (Cl-), and potassium (K+) handling in CKD
In our study, we observed a relatively high FENa in the HF group compared with the CKD1 group. Salt wasting in renal disease results from the inability of the distal nephron either to increase its sodium absorptive capacity proportionate to an increase in sodium delivery out of the proximal nephron or to generate maximal concentration gradients between tubular fluid and blood.[24–26] The relatively high urine Na+ in HF associated with CKD has been proposed to be due to increased osmotic load per nephron. CKD patients typically maintain serum Na+ balance until late stages of the disease.[27,28] The mechanisms suggested to be involved in further urine Na+ loss in CKD include osmotic diuresis, tubular injury, and inability to acutely shut off natriuretic forces. Urine Na+ excretion is typically coupled with urine Cl-. However, urine Na+ and Cl- excretion are usually both high and coupled in CKD patients.[27–29]
We found in the present study that FEK tends to increase during progression through stages CKD1 to 5. Serum K+ level reached a peak at CKD5. Previous studies have revealed that urine K+ excretion ability is diminished due to decreased renal mass, administration of renin–angiotensin–aldosterone system inhibitors, and the presence of DM.[12,30,31] Urine K+ excretion depends on aldosterone action, which results from adequate sodium delivery to the distal tubule and the cortical collecting duct. Urine flow in residual nephrons is adaptively enhanced due to a decrease in tubular Na+ reabsorption; this adaptive mechanism can further contribute to the preservation of urine K+ excretion at CKD3b, even with a significant decrease in the urine K+ concentration.[31,32]
4.3. Calcium (Ca+2) and phosphate (P) handling in CKD
It is well known that, in addition to parathyroid hormone (PTH), the early presentation of fibroblast growth factor 23 (FGF-23) promotes urine P excretion. The presence of secondary hyperparathyroidism in the early stages of CKD may cause the decrease in fractional excretion of filtered Ca+2 acting through increased reabsorption in CKD1 to 2.[33–35] Chronic metabolic acidosis can also cause an increase in urine Ca+2 excretion, independent of PTH changes.[36] In our study, the cause of the drop in FECa in CKD4 is hard to explain with reference to PTH effects alone, and we presume that other unknown mechanisms may be at work. The avidity of the skeleton for calcium may play a role in regulating urine Ca+2 excretion. Depletion of bone calcium can also enhance the tubular reabsorption of urine Ca+2 independent of PTH.[34–36]
In the early stages of CKD, serum P remains in the normal range due to an increase in urine P excretion by FGF-23.[37,38] In addition, hyperparathyroidism secondary to CKD leads to inhibition of urine P reabsorption and consequently to an increase in FEP.[35] Evenepoel et al[39] have demonstrated higher FEP in patients with both high serum FGF-23 and high PTH level. Together, PTH and FGF-23 could promote urine P wasting through internalization of sodium phosphate cotransporters IIa and IIc from the proximal tubular apical membrane, which may explain the observed increase in FEP.[40] Metabolic acidosis per se can stimulate phosphaturia, which helps remove acid from the blood.[35] Overt phosphaturia, however, can contribute to renal tubular damage and renal fibrosis through the formation of calcium phosphate crystals via oxidative stress. Urine P excretion per creatinine clearance could be a useful indicator that early intervention for phosphate restriction is needed in CKD patients.[41]
4.4. Magnesium (Mg+2) handling in CKD
In our study we observed a tendency toward decreased urine Mg2+ concentration and increased FEMg along with CKD progression. FEMg is higher in HF than in CKD1. The increased filtrated load of Mg2+per nephron via a paracellular pathway is aided by a chemical gradient generated by sodium gradient-driven water transport that increases intraluminal magnesium as well as lumen positivity.[35] PTH could affect the renal handling of magnesium at the distal convoluted tubule in a fashion similar to its effect on calcium, so it is possible that the increase in filtered Mg2+ per nephron has a greater effect on FEMg and overshadows the effect of PTH.[42] Futrakul et al investigated patients with nephrotic syndrome in search of the most sensitive markers of tubular dysfunction. FEMg is considered a sensitive index for the detection of early abnormality of tubular structure and function. The improvement of renal perfusion and function after recovery from renal injury is associated with increased GFR and decreased FEMg.[43–45]
Different segments of the nephron have different propensities to ischemia. The straight proximal tubule and the thick ascending loop of Henle (TAL) are the 2 segments that are most sensitive to ischemia. Urine Mg2+ reabsorption in the TAL and that in the distal tubule are load-dependent. The major portion of urine Mg2+ reabsorption occurs in TAL, FEMg is considered a marker of intact tubulointerstitial structure in patients with glomerular disease. FEMg could be useful as an index to diagnose early-stage tubular dysfunction or as an indicator of residual tubular damage. FEMg can potentially reflect not only the presence or absence of tubulointerstitial fibrosis but also the severity of CKD.[43–46] Diabetic glomerulopathy is common in the early stages of diabetic nephropathy; however, tubulointerstitial fibrosis may be prominent in advanced diseases.[47] In our study, FEMg increased more markedly among diabetic patients, suggestion that diabetic patients might have more tubulointerstitial disorder.
To the best of our knowledge, this is the first report of large populations to investigate the correlations of renal excretion of different electrolytes in patients at different stages of CKD. However, there are some limitations of this study. First, we did not collect the 24-hour urine samples to assess FEX. Nevertheless, 24-hour urine collection is frequently limited by patients’ adherence and may have some potential mistakes in clinical practice. Second, the values of FEX may have been influenced by medications such as antihypertensive drugs, bicarbonates and polystiren sulfonate, acid-base, volume status, blood biochemistry, and several physiologic factors including age, gender, nutrition, exercise, timing of specimen collection, diet, and various diseases. This may be another limitation in this study.
In conclusion, we investigated the relationship between urine electrolytes and FEX at different stages of CKD. FEX tended to increase along with the reduction of GFR, and the trends observed over the course of CKD progression were similar in DM and non-DM patients. DM patients might have higher FEMg compared with non-DM subjects. FEMg could be a potential predictor of CKD progression.
Acknowledgments
The authors thank all the patients consenting to publish the clinical information.
Author contributions
Conceptualization: Po-Jen Hsiao, Chen-Yi Liao, Jin-Shuen Chen.
Data curation: Po-Jen Hsiao, Chen-Yi Liao, Chih-Pin Chuu, Jin-Shuen Chen.
Formal analysis: Po-Jen Hsiao, Chen-Yi Liao, Yung-Hsi Kao.
Funding acquisition: Po-Jen Hsiao.
Investigation: Po-Jen Hsiao, Chen-Yi Liao, Yung-Hsi Kao, Jenq-Shyong Chan, Yuh-Feng Lin, Jin-Shuen Chen.
Methodology: Chen-Yi Liao, Chih-Pin Chuu, Jin-Shuen Chen.
Project administration: PO-JEN HSIAO, Yuh-Feng Lin.
Resources: Po-Jen Hsiao, Yung-Hsi Kao, Jenq-Shyong Chan, Chih-Pin Chuu.
Software: Jenq-Shyong Chan, Yuh-Feng Lin.
Supervision: Po-Jen Hsiao, Yung-Hsi Kao, Jin-Shuen Chen.
Validation: Po-Jen Hsiao, Yuh-Feng Lin, Chih-Pin Chuu, Jin-Shuen Chen.
Visualization: Jenq-Shyong Chan.
Writing – original draft: Po-Jen Hsiao, Chen-Yi Liao, Jin-Shuen Chen.
Writing – review & editing: Po-Jen Hsiao, Chih-Pin Chuu, Jin-Shuen Chen.
Po-Jen Hsiao orcid: 0000-0003-4965-0285.
Footnotes
Abbreviations: ACR = albumin-to-creatinine ratio, BMI = body mass index, CKD = chronic kidney disease, DM = diabetes mellitus, eGFR = estimated glomerular filtration rate, FE = fractional excretion, FEX = fractional excretion of electrolytes, FGF-23 = fibroblast growth factor 23, HF = hyperfiltration, PTH = parathyroid hormone, SCr = serum creatinine, TAL = thick ascending loop of Henle, U = urine, UA = uric acid.
How to cite this article: Hsiao PJ, Liao CY, Kao YH, Chan JS, Lin YF, Chuu CP, Chen JS. Comparison of fractional excretion of electrolytes in patients at different stages of chronic kidney disease: A cross-sectional study. Medicine. 2020;99:2(e18709).
This study was supported by grants from the Research Fund of the Taoyuan Armed Forces General Hospital (AFTYGH-109009). Informed written consent was obtained from the patients for publication.
Informed written consent was obtained from the patients for publication.
The authors have no conflicts of interest to disclose.
References
- [1].Dhondup T, Qian Q. Electrolyte and acid–base disorders in chronic kidney disease and end-stage kidney failure. Blood Purif 2017;43:179–88. [DOI] [PubMed] [Google Scholar]
- [2].Tanaka T, Okamura T, Miura K, et al. A simple method to estimate population 24-h urinary salt potassium excretion using a casual urine specimen. J Hum Hypertens 2002;16:97–103. [DOI] [PubMed] [Google Scholar]
- [3].Brown IJ, Dyer AR, Chan Q, et al. Group, Estimating 24-hour urinary sodium excretion from casual urinary sodium concentrations in Western populations: the INTERSALT study. Am J Epidemiol 2013;177:1180–92. [DOI] [PMC free article] [PubMed] [Google Scholar]
- [4].Zhang T, Chang X, Liu W, et al. Comparison of sodium, potassium, calcium, magnesium, zinc, copper and iron concentrations of elements in 24-h urine and spot urine in hypertensive patients with healthy renal function. J Trace Elem Med Biol 2017;44:104–8. [DOI] [PubMed] [Google Scholar]
- [5].Mill JG, Rodrigues SL, Baldo MP, et al. Validation study of the Tanaka and Kawasaki equations to estimate the daily sodium excretion by a spot urine sample. Rev Bras Epidemiol 2015;18: suppl 2: 224–37. [DOI] [PubMed] [Google Scholar]
- [6].Ilich JZ, Blanusa M, Orlić ZC, et al. Comparison of calcium, magnesium, sodium, potassium, zinc, and creatinine concentration in 24-h and spot urine samples in women. Clin Chem Lab Med 2009;47:216–21. [DOI] [PubMed] [Google Scholar]
- [7].Wu KL, Cheng CJ, Sung CC, et al. Identification of the causes for chronic hypokalemia for chronic hypokalemia: importance of urinary sodium and chloride excretion. Am J Med 2017;130:846–55. [DOI] [PubMed] [Google Scholar]
- [8].Li F, Guo H, Zou J, et al. The association of urinary sodium and potassium with renal uric acid excretion in patients with chronic kidney disease. Kidney Blood Press Res 2018;43:1310–21. [DOI] [PubMed] [Google Scholar]
- [9].Walsh PR, Tse Y, Ashton E, et al. Clinical and diagnostic features of Bartter and Gitelman syndromes. Clin Kidney J 2018;11:302–9. [DOI] [PMC free article] [PubMed] [Google Scholar]
- [10].Xu H, Hashem A, Witasp A, et al. Fibroblast growth factor 23 is associated with fractional excretion of sodium in patients with chronic kidney disease. Nephrol Dial Transplant 2019;34:2051–7. [DOI] [PubMed] [Google Scholar]
- [11].Jiménez Villodres M, García Gutiérrez G, García Frías P, et al. Fractional excretion of phosphorus and vascular calcification in stage 3 chronic kidney disease. J Investig Med 2019;67:674–80. [DOI] [PubMed] [Google Scholar]
- [12].Ueda Y, Ookawara S, Ito K, et al. Changes in urinary potassium excretion in patients with chronic kidney disease. Kidney Res Clin Pract 2016;35:78–83. [DOI] [PMC free article] [PubMed] [Google Scholar]
- [13].Haneda M, Utsunomiya K, Koya D, et al. A new Classification of Diabetic Nephropathy 2014: a report from Joint Committee on Diabetic Nephropathy. J Diabetes Invest 2015;6:242–6. [DOI] [PMC free article] [PubMed] [Google Scholar]
- [14].Isakova T, Nickolas TL, Denburg M, et al. KDOQI US Commentary on the 2017 KDIGO Clinical Practice Guideline Update for the Diagnosis, Evaluation, Prevention, and Treatment of Chronic Kidney Disease–Mineral and Bone Disorder (CKD-MBD). Am J Kidney Dis 2017;70:737–51. [DOI] [PubMed] [Google Scholar]
- [15].Levey AS, Coresh J, Balk E, et al. National Kidney Foundation practice guidelines for chronic kidney disease: evaluation, classification, and stratification. Ann Intern Med 2003;139:137–47. [DOI] [PubMed] [Google Scholar]
- [16].Vassalotti JA, Centor R, Turner BJ, et al. Practical approach to detection and management of chronic kidney disease for the primary care clinician. Am J Med 2016;126:153–62. [DOI] [PubMed] [Google Scholar]
- [17].Phelps KR, Lieberman RL. Fractional excretion and reabsorption in chronic kidney disease. Clin Nephrol 2012;77:484–90. [DOI] [PubMed] [Google Scholar]
- [18].Kroll MH, Elin RJ. Relationships between magnesium and protein concentrations in serum. Clin Chem 1985;31:244–6. [PubMed] [Google Scholar]
- [19].Mateu-de Antonio J. New predictive equations for serum ionized calcium in hospitalized patients. Med Princ Pract 2016;25:219–26. [DOI] [PMC free article] [PubMed] [Google Scholar]
- [20].Kannangara DR, Ramasamy SN, Indraratna PL, et al. Fractional clearance of urate: validation of measurement in spot-urine samples in healthy subjects and gouty patients. Arthritis Res Ther 2012;14:2–8. [DOI] [PMC free article] [PubMed] [Google Scholar]
- [21].Bobulescu IA, Moe OW. Renal transport of uric acid: evolving concepts and uncertainties. Adv Chronic Kidney Dis 2012;19:358–71. [DOI] [PMC free article] [PubMed] [Google Scholar]
- [22].Maesaka JK, Fishbane S. Regulation of renal urate excretion: a critical review. Am J Kidney Dis 1998;32:917–33. [DOI] [PubMed] [Google Scholar]
- [23].Sorensen LB, Levinson DJ. Origin and extrarenal elimination of uric acid in man. Nephron 1975;14:7–20. [DOI] [PubMed] [Google Scholar]
- [24].Coleman AJ, Arias M, Carter NW, et al. The mechanism of salt wastage in chronic renal disease. J Clin Invest 1966;45:1116–25. [DOI] [PMC free article] [PubMed] [Google Scholar]
- [25].Choi JW, Park JS, Koo TY, et al. Fractional excretion of uric acid as a predictor for saline responsiveness in long-term kidney transplant patients. Kidney Blood Press Res 2012;35:627–33. [DOI] [PubMed] [Google Scholar]
- [26].Bitew S, Imbriano L, Miyawaki N, et al. More on renal salt wasting without cerebral disease: response to saline infusion. Clin J Am Soc Nephrol 2009;4:309–15. [DOI] [PMC free article] [PubMed] [Google Scholar]
- [27].Brosius FC, Lau K. Low fractional excretion of sodium in acute renal failure: role of timing of the test and ischemia. Am J Nephrol 1986;6:450–7. [DOI] [PubMed] [Google Scholar]
- [28].Zarich S, Fang LS, Diamond JR. Fractional excretion of sodium. Exceptions to its diagnostic value. Arch Intern Med 1985;145:108–12. [PubMed] [Google Scholar]
- [29].Combs S, Berl T. Dysnatremias in patients with kidney disease. Am J Kidney Dis 2014;63:294–303. [DOI] [PMC free article] [PubMed] [Google Scholar]
- [30].Weir MR, Rolfe M. Potassium homeostasis and renin-angiotensin-aldosterone system inhibitors. Clin J Am Soc Nephrol 2010;5:531–48. [DOI] [PubMed] [Google Scholar]
- [31].Liamis G, Liberopoulos E, Barkas F, et al. Diabetes mellitus and electrolyte disorders. World J Clin Cases 2014;2:488–96. [DOI] [PMC free article] [PubMed] [Google Scholar]
- [32].Kamel KS, Quaggin S, Scheich A, et al. Disorders of potassium homeostasis: an approach based on pathophysiology. Am J Kidney Dis 1994;24:597–613. [DOI] [PubMed] [Google Scholar]
- [33].Komaba H, Fukagawa M. FGF23–parathyroid interaction: implications in chronic kidney disease. Kidney Int 2010;77:292–8. [DOI] [PubMed] [Google Scholar]
- [34].Isakova T, Wahl P, Vargas GS, et al. Fibroblast growth factor 23 is elevated before parathyroid hormone and phosphate in chronic kidney disease. Kidney Int 2011;79:1370–8. [DOI] [PMC free article] [PubMed] [Google Scholar]
- [35].Blaine J, Chonchol M, Levi M. Renal control of calcium, phosphate, and magnesium homeostasis. Clin J Am Soc Nephrol 2015;10:1257–72. [DOI] [PMC free article] [PubMed] [Google Scholar]
- [36].Alexander RT, Cordat E, Chambrey R, et al. Acidosis and urinary calcium excretion: insights from genetic disorders. J Am Soc Nephrol 2016;27:3511–20. [DOI] [PMC free article] [PubMed] [Google Scholar]
- [37].Oliveira RB, Cancela AL, Graciolli FG, et al. Early control of PTH and FGF23 in normophosphatemic CKD patients: a new target in CKD-MBD therapy? Clin J Am Soc Nephrol 2010;5:286–91. [DOI] [PMC free article] [PubMed] [Google Scholar]
- [38].Kuro-O M. A phosphate-centric paradigm for pathophysiology and therapy of chronic kidney disease. Kideny Int Suppl 2013;3:420–6. [DOI] [PMC free article] [PubMed] [Google Scholar]
- [39].Evenepoel P, Meijers B, Viaene L, et al. Fibroblast growth factor-23 in early chronic kidney disease: additional support in favor of a phosphate-centric paradigm for the pathogenesis of secondary hyperparathyroidism. Clin J Am Soc Nephrol 2010;5:1268–76. [DOI] [PMC free article] [PubMed] [Google Scholar]
- [40].Nitta K, Nagano N, Tsuchiya K. Fibroblast growth factor 23/Klotho axis in chronic kidney disease. Nephron Clin Pract 2014;128:1–0. [DOI] [PubMed] [Google Scholar]
- [41].Kawasaki T, Maeda Y, Matsuki H, et al. Urinary phosphorus excretion per creatinine clearance as a prognostic marker for progression of chronic kidney disease: a retrospective cohort study. BMC Nephrol 2015;16:116. [DOI] [PMC free article] [PubMed] [Google Scholar]
- [42].Dai LJ, Ritchie G, Kerstan D, et al. Magnesium transport in the renal distal convoluted tubule. Physiol Rev 2001;8:51–84. [DOI] [PubMed] [Google Scholar]
- [43].Futrakul P, Yenrudi S, Futrakul N, et al. Tubular function and tubulointerstitial disease. Am J Kidney Dis 1999;33:86–91. [DOI] [PubMed] [Google Scholar]
- [44].Gheissari A, Andalib A, Labibzadeh N, et al. Fractional excretion of magnesium (FEMg), a marker for tubular dysfunction in children with clinically recovered ischemic acute tubular necrosis. Saudi J Kidney Dis Transpl 2011;22:476–81. [PubMed] [Google Scholar]
- [45].Gobé G, Willgoss D, Hogg N, et al. Cell survival or death in renal tubular epithelium after ischemia-reperfusion injury. Kidney Int 1999;56:1299–304. [DOI] [PubMed] [Google Scholar]
- [46].Noiri C, Shimizu T, Takayanagi K, et al. Clinical significance of fractional magnesium excretion (FEMg) as a predictor of interstitialnephropathy and its correlation with conventional parameters. Clin Exp Nephrol 2015;19:1071–8. [DOI] [PubMed] [Google Scholar]
- [47].Žeravica R, Ilinčić B, Čabarkapa V, et al. Fractional excretion of magnesium and kidney function parameters in nondiabetic chronic kidney disease. Magnes Res 2018;31:49–57. [DOI] [PubMed] [Google Scholar]


