Correction to: Scientific Reports 10.1038/s41598-019-52208-3, published online 29 October 2019
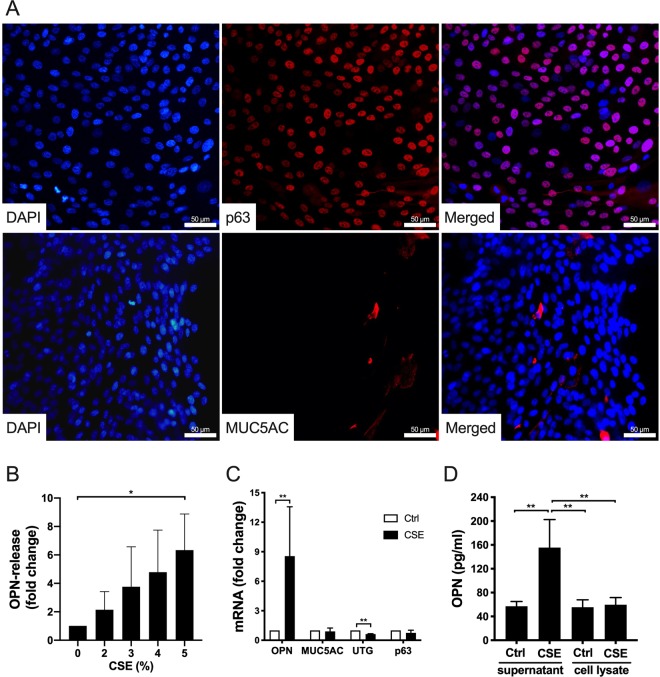
This Article contains errors in Figure 3, where the y-axis in Figure 3B has been incorrectly labelled. The correct Figure 3 appears below as Figure 1. As a result, the Figure legend,
Figure 1.
.
“Phenotypic characterization of submerged human bronchial epithelial cells (HBECs) and OPN production in response to cigarette smoke extract (CSE). (A) HBECs were grown to near confluence and stained to detect markers of basal cells (p63) and goblet cells (MUC5AC). 4′,6-Diamidino-2-phenylindole (DAPI) was used to stain the DNA of nuclei. Micrographs from one representative experiment out of three. Scale bars = 50 µm. (B) HBECs were incubated with CSE (0–5%) for 24 h. OPN levels in cell culture media were determined via enzyme-linked immunosorbent assay (ELISA). Results represent means and standard deviations (SD) of three independent experiments. Statistical analyses were performed using one-way ANOVA with Dunnett’s post-hoc test. (C) Submerged HBECs were cultured in the absence and presence of CSE (5%) for 24 h. The mRNA expression of OPN, MUC5AC, UTG, and p63 (fold-change compared to control cells cultured in medium alone) is depicted here. The results represent means and SD of three to five independent experiments. Statistical analyses were performed using a Mann-Whitney U test. (D) Intracellular OPN content and content in the media of cells cultured in the absence and presence of CSE (5%) for 24 h. The results represent means and SD of three independent experiments. Statistical analyses were performed using one-way ANOVA with Tukey’s post-hoc test. *P < 0.05, **P < 0.01.”
should read:
“Phenotypic characterization of submerged human bronchial epithelial cells (HBECs) and OPN production in response to cigarette smoke extract (CSE). (A) HBECs were grown to near confluence and stained to detect markers of basal cells (p63) and goblet cells (MUC5AC). 4′,6-Diamidino-2-phenylindole (DAPI) was used to stain the DNA of nuclei. Micrographs from one representative experiment out of three. Scale bars = 50 µm. (B) HBECs were incubated with CSE (0–5%) for 24 h. OPN levels in cell culture media were determined using ELISA. OPN-release from unstimulated cells (0% CSE) were set to 1, and the other conditions were calculated as fold change. Results represent means and standard deviations (SD) of three independent experiments. Statistical analyses were performed using one-way ANOVA with Dunnett’s post-hoc test. (C) Submerged HBECs were cultured in the absence and presence of CSE (5%) for 24 h. The mRNA expression of OPN, MUC5AC, UTG, and p63 (fold-change compared to control cells cultured in medium alone) is depicted here. The results represent means and SD of three to five independent experiments. Statistical analyses were performed using a Mann-Whitney U test. (D) Intracellular OPN content and content in the media of cells cultured in the absence and presence of CSE (5%) for 24 h. The results represent means and SD of three independent experiments. Statistical analyses were performed using one-way ANOVA with Tukey’s post-hoc test. *P < 0.05, **P < 0.01.”


