Abstract
Background
Conventional reference multi-contrast black-blood (BB) MRI can be used for measuring luminal stenosis severity and plaque components, and its performance has been validated by intra- and inter-reader reproducibility test and histology. Recently, a set of 3D multi-contrast BB sequences have been developed, but its accuracy and reliability have not been well investigated. In this study, we evaluated the performance of 3D multi-contrast MRI (3D-MERGE, T2-VISTA, and SNAP) by comparing it with reference multi-contrast vessel wall MRI and assessing the inter-reader reproducibility.
Methods
In total, 27 patients were recruited in this study. Twenty-six participants underwent reference and 3D multi-contrast imaging in a 3.0T MR scanner. One participant underwent carotid endarterectomy (CEA) after 3D MR imaging. Two trained reviewers interpreted reference and 3D datasets. Lumen area (LA), wall area (WA), normalized wall index (NWI), maximum wall thickness (MaxWT), and mean wall thickness (MWT) were measured, and the presence of lipid-rich necrotic core (LRNC), intra-plaque hemorrhage (IPH) and calcification (CA) were identified. Inter-reader reproducibility of 3D interpretation was assessed.
Results
3D imaging provided comparable measurements with reference imaging in LA (43.81±25.74 vs. 43.35±24.66 mm2) and MaxWT (1.65±1.33 vs. 1.62±1.10 mm), with a lower NWI (0.40±0.15 vs. 0.43±0.11), WA (29.40±21.92 vs. 30.64±16.17 mm2) and MWT (1.09±0.69 vs. 1.14±0.47), and showed good agreement for identification of LRNC (κ=0.66, 95% CI: 0.30–1.00) and CA (κ=0.69, 95% CI: 0.42–0.97), and excellent agreement for IPH (κ=1.00, 95% CI: 1.00–1.00). Inter-reader agreement of 3D analysis was good (LRNC, κ=0.87, 95% CI: 0.61–1.00; CA, κ=0.66, 95% CI: 0.36–0.96; IPH, κ=1.00, 95% CI: 1.00–1.00).
Conclusions
3D multi-contrast vessel wall imaging provides comparable performance in morphological measurements and identification of carotid plaque components as reference multi-contrast MRI, with good inter-reader reproducibility.
Keywords: 3D multi-contrast vessel wall imaging; comparison; carotid atherosclerosis, inter-reader reproducibility
Introduction
Approximately 18–25% of all strokes are associated with carotid atherosclerotic disease (1). Previous studies reported that carotid stenosis severity and specific elements of plaque composition were associated with increased risk of stroke in patients with carotid atherosclerotic disease (2-5). Magnetic resonance (MR) vessel wall imaging enables characterization of carotid stenosis and depiction of plaque components (6) and has thus gained popularity for investigating plaque vulnerability.
Previous publications have shown that multi-contrast black-blood (BB) MR sequences can be used in characterization and identification of carotid atherosclerotic plaques in the aspect of both vessel wall morphology and plaque compositions (7,8). The performance of multi-contrast BB MRI has been validated by intra- and inter-reader reproducibility test (9). More importantly, the ability to detect multiple carotid plaque compositions, such as lipid-rich necrotic core (LRNC, iso- to hyperintense on T1WI), calcification (CA, hypointense on TOF/T1WI/T2WI), and intraplaque hemorrhage (IPH, hyperintense on heavy T1WI such as MPRAGE), was confirmed by histology (10-12). To detect these plaque compositions and to evaluate carotid arterial morphology, a minimal set of non-contrast BB MRI sequences should include T1, T2, and heavy T1-weighted imaging referring to the white paper of the carotid artery wall imaging (13).
In recent years, several 3D BB MR sequences with high isotropic resolution, high signal-to-noise ratio (SNR), and large coverage have been developed (14-16). Researchers demonstrated that 3D motion-sensitized driven equilibrium (MSDE), prepared rapid gradient echo (3D-MERGE), T2-weighted volumetric isotropic turbo spin-echo acquisition (T2-VISTA), and simultaneous non-contrast angiography and intraplaque hemorrhage (SNAP) can together meet multi-contrast requirements and are optimal for the screening of atherosclerosis (17). Similar to previous histologically confirmed multi-contrast BB MRI, 3D multi-contrast MRI (3D-MERGE, T2-VISTA, and SNAP) can also provide T1, T2, and heavy T1-weighted images. However, the accuracy and reliability of 3D multi-contrast vessel wall imaging techniques, as described in Ref.17, has not been well investigated.
Therefore, the purpose of this study was to evaluate the performance of 3D multi-contrast MRI (3D-MERGE, T2-VISTA, and SNAP) in morphological measurements and carotid plaque components through comparison with reference multi-contrast vessel wall MRI on a group of patients with ultrasound-diagnosed carotid atherosclerotic plaque. Additionally, a histological specimen and inter-reader reproducibility were utilized to initially validate the detection of the plaque components for 3D multi-contrast MRI (3D-MERGE, T2-VISTA, and SNAP).
Methods
In vivo MR scan
A total of 27 patients (16 males and 11 females, age: 42–85 years) with recent (within 2 weeks) ischemic stroke or transient ischemic attack (TIA) were recruited. All patients were identified with a carotid atherosclerotic plaque by ultrasound. One subject also underwent carotid endarterectomy (CEA) operation after MR imaging. All participants provided informed consent according to the local institutional review board guidelines.
MR imaging was performed on a 3.0 T MR scanner (Philips Achieva TX, Best, The Netherlands) with a custom-designed 36-channel neurovascular coil (17). 3D-MERGE, T2-VISTA, and SNAP were utilized as a set of 3D multi-contrast MR protocol providing T1, T2, and heavy T1-weighted vessel wall images (17). Quadruple-inversion-recovery (QIR) T1-weighted turbo spin echo (T1-TSE), multislice double inversion-recovery (MDIR) T2-weighted TSE (T2-TSE), and three-dimensional magnetization-prepared rapid acquisition gradient-echo (3D-MPRAGE) were used to provide conventional multi-contrast vessel wall images as references. No acceleration techniques were used in this study to ensure adequate image quality. All imaging parameters for both reference and 3D protocols are summarized in Table 1.
Table 1. Imaging parameters for reference and 3D multi-contrast sequences.
| Parameters | Reference | 3D | |||||
|---|---|---|---|---|---|---|---|
| T1-TSE | T2-TSE | 3D-MPRAGE | 3D-MERGE | T2-VISTA | SNAP | ||
| FOV (mm3) | 140×140×32 | 160×160×48 | 250×160×40 | ||||
| Resolution (mm3) | 0.6×0.6×2 | 0.8×0.8×0.8 | |||||
| TE (ms) | 10 | 50 | 5.3 | 4.2 | 255/86† | 4.5 | |
| TR (ms) | 800 | 4,800 | 8.8/609‡ | 9 | 2,500 | 10/1,987§ | |
| TI (ms) | N/A | N/A | 304 | N/A | N/A | N/A | |
| Flip angle (deg) | 90 | 90 | 15 | 6 | Variable | 11/5¶ | |
| Turbo factor | 10 | 12 | 32 | 90 | 130 + 4# | 98 | |
| Signal acquisitions | 1 | 2 | 1 | 2 | |||
| Scan time | 6:11 | 3:50 | 2:28 | 3:10 | 4:32 | 6:47 | |
†, Effective echo time/Equivalent echo time. ‡, TR for one inversion cycle. §, SPGR repetition time/inversion recovery repetition time (IRTR). ¶, flip angle used in IR/reference acquisition. #, Number of echoes in each shot for acquisition start-up. T1-TSE, T1-weighted turbo spin echo; T2-TSE, T2-weighted turbo spin echo; 3D-MPRAGE, three-dimensional magnetization-prepared rapid acquisition gradient-echo; 3D-MERGE, 3D motion-sensitized driven equilibrium prepared rapid gradient echo; T2-VISTA, T2-weighted volumetric isotropic turbo spin echo acquisition; SNAP, simultaneous non-contrast angiography and intraplaque hemorrhage; FOV, field of view; TE, echo time; TR, repetition time; TI, inversion time.
Image analysis
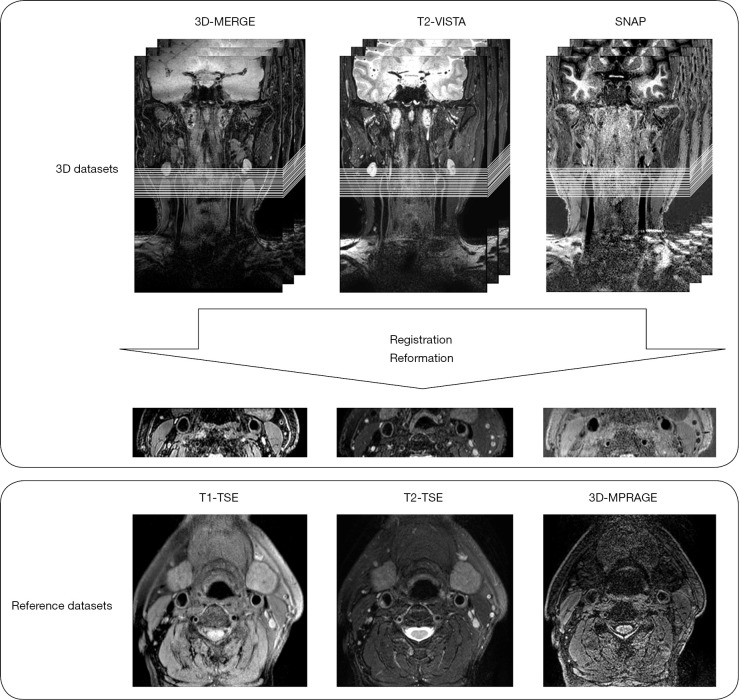
Scan geometries were centered at the bifurcation of the index side (the side with the larger degree of stenosis by ultrasound). All subsequent analysis was done on the index side artery. Image registration was conducted by a workstation (Extended MR Workspace 2.6.3.4, Philips Medical Systems) to match the 3D multi-contrast MRI dataset with reference datasets. First, all 3D volumes were rotated to similar imaging coordinates as the reference images. Next, the location of the common carotid bifurcation was used as an internal fiducial marker to match different scans along the long axis of the artery. Finally, all 3D images were reformatted to 2D datasets as reference images with an effective 2 mm slice thickness for comparison to the reference images, as shown in Figure 1.
Figure 1.
Illustration of data reformation. 3D datasets were reformatted as reference axial images with 2 mm slice thickness. 3D-MERGE, 3D motion-sensitized driven equilibrium prepared rapid gradient echo; T2-VISTA, T2-weighted volumetric isotropic turbo spin echo acquisition; SNAP, simultaneous non-contrast angiography and intraplaque hemorrhage; T1-TSE, T1-weighted turbo spin echo; T2-TSE, T2-weighted turbo spin echo; 3D-MPRAGE, three-dimensional magnetization-prepared rapid acquisition gradient-echo.
The reference dataset was interpreted by one trained reviewer (X.Z) while the 3D dataset was interpreted by another trained reviewer (G.C) individually. Both reviewers had more than 10-year experience in plaque imaging. To test the inter-reader variability of 3D interpretation, another trained reviewer (H.W), blinded to other reviewers’ interpretation, analyzed the carotid plaque components in 3D images (3Dr). Additionally, a qualitative comparison between the histological specimen and its corresponding 3D images at the same arterial location was utilized to initially validate the reliability of 3D interpretation on plaque component detection.
Image quality (IQ) was evaluated for all MR images by a 4-point scale with the following classifications: a score of 1, poor quality (arterial wall and lumen margins not identifiable); a score of 2, adequate quality (arterial wall was visible, but the compositional substructure was partially obscured); a score of 3, good quality (minimal motion or flow artifacts, vessel wall and lumen boundaries clearly defined); and a score of 4, excellent quality (no artifacts, wall architecture and plaque composition depicted in detail) (18). All images with an IQ =1 were excluded from the review. Computer-Aided System for Cardiovascular Disease Evaluation (CASCADE) (19) software was used to trace lumen and outer wall boundaries, along with plaque composition. Lumen area (LA) and wall area (WA) were measured for reference and 3D scans at a slice-based level, and maximum wall thickness (MaxWT) and mean wall thickness (MWT) were automatically calculated in CASCADE using lumen and vessel wall boundaries. Furthermore, to evaluate plaque burden, normalized wall index (NWI) was calculated with the following formula:
| NWI = WA / (LA + WA) | [1] |
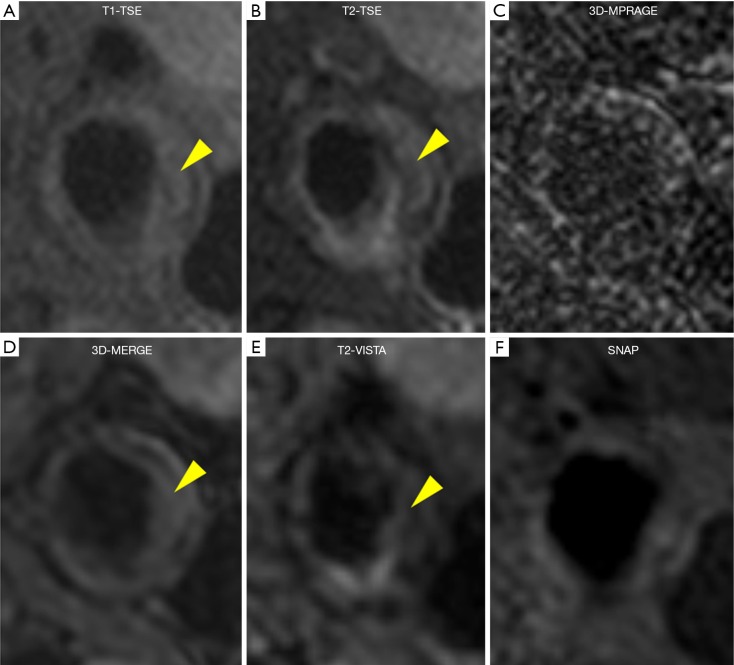
The presence of plaque components, including LRNC, IPH, and CA, were identified based on previously published criteria (8,9) at an artery-based level. IPH is identified as a hyperintense signal on 3D-MPRAGE and SNAP images. CA is characterized by areas with hypointense signal on both T1-TSE/3D-MERGE- and T2-TSE/T2-VISTA-weighted images. LRNC is generally located in the bulk of atherosclerotic plaque and shows up as isointense to hyperintense on T1-TSE/3D-MERGE images, while it has varied signal intensities on T2-TSE/T2-VISTA images (9).
Histology
For the one participant who underwent CEA, the carotid plaque was removed without disruption of the luminal surface. The specimen was fixed in 10% neutral buffered formalin, decalcified in 10% formic acid, and then embedded en bloc in paraffin. Sections were collected every 1.0 mm throughout the length of the plaque and stained with hematoxylin-eosin (H&E) and Mallory’s trichrome stains. Histology sections were matched to MR images using the bifurcation and lumen morphology as landmarks.
Statistical analysis
IQ comparison between reference and 3D vessel wall images was evaluated by Wilcoxon signed rank-sum test. Inter-reader reproducibility of morphological measurements with 3D vessel wall images was assessed by Bland-Altman plots. The agreement of reference and 3D morphological measurements was determined by two-way absolute agreement intra-class correlation coefficient (ICC) and correlations (R) at a 95% confidence interval (CI). An ICC or R>0.8 was considered a good agreement. In order to compare consistency of reference and 3D measurements, bias of 3D with respect to reference measurements was calculated, and Bland-Altman plots were used to test the agreement between reference and 3D measurements. Statistical significance was set at P<0.05. Presence or absence of plaque components was denoted as binary variables. Inter-reader agreement between compositional variables across all matched patients was assessed with Cohen’s kappa (κ). Furthermore, in order to evaluate the agreement between reference and 3D multi-contrast imaging in plaque components identification, a 2×2 truth table and Cohen’s kappa (κ) analysis were used. κ ≥0.8 and 0.6<κ<0.8 were considered as “excellent” and “good” agreement, respectively. All statistical analyses were performed with Medcalc 11.4.2.0 (Medcalc Software, Mariakerke, Belgium).
Results
Twenty-six participants, with all six sets of MR images obtained, were included in the comparative study between reference and 3D imaging. Only one histological specimen was used as the gold standard to initially validate the performance of 3D multi-contrast MRI (3D-MERGE, T2-VISTA, and SNAP).
T1-TSE, T2-TSE, 3D-MERGE, and T2-VISTA were utilized for morphological measurements, and 416 slices were acquired for 26 participants for each sequence mentioned above, of which 20 slices were excluded from analysis due to severe misregistration caused by motion.
For the remaining 396 slices, IQ of reference and 3D datasets are summarized in Table 2, and 37 slices were excluded due to poor IQ (IQ =1) of reference or 3D images. 3D datasets showed higher IQ than reference (2.768±0.584 vs. 2.694±0.629, P<0.0001). Furthermore, among the 37 excluded slices, there were five 3D reformatted slices having readable image quality, while the matched reference slices were uninterpretable. Therefore, 364 slices were available to test the inter-reader agreement of 3D analysis, and 359 slices were included in the comparison of reference and 3D measurements.
Table 2. Image quality (IQ) of reference and 3D slices.
| 3D | Reference | |||
|---|---|---|---|---|
| 1 | 2 | 3 | 4 | |
| 1 | 31 | 1 | 0 | 0 |
| 2 | 0 | 10 | 18 | 0 |
| 3 | 5 | 38 | 293 | 0 |
| 4 | 0 | 0 | 0 | 0 |
Morphological measurements
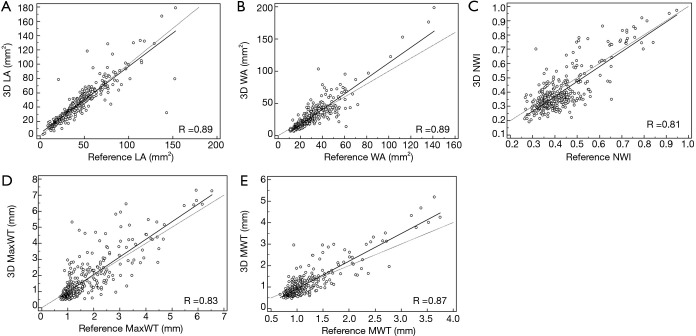
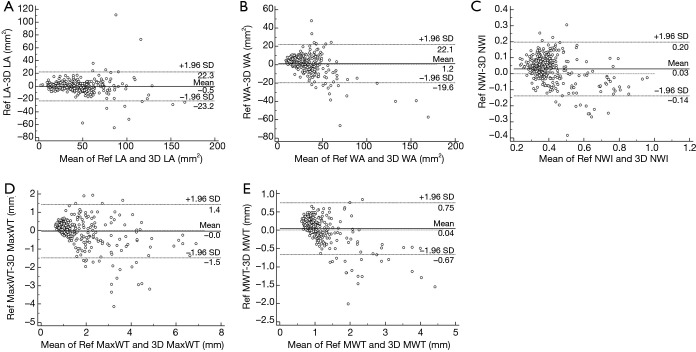
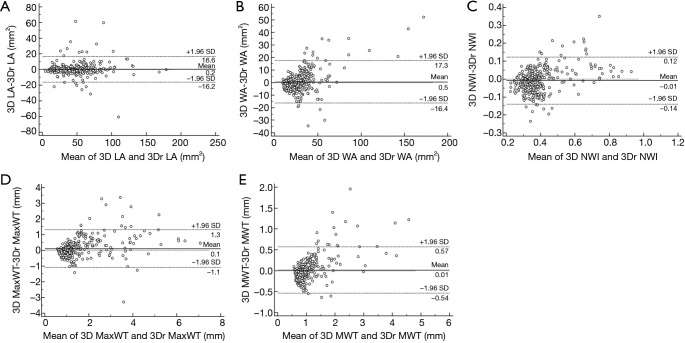
No significant bias was observed for any of the measurements. LA, WA, NWI, MaxWT, and MWT values are given in Table 3, and linear regression lines indicating a strong correlation between reference and 3D morphological measurements are shown in Figure 2. ICC and correlations showed good agreement for all morphological measurements. The agreement between 3D and reference morphological measurements are illustrated in Figure 3. No significant bias was observed for LA and MaxWT measurements. However, 3D imaging measurements showed slightly lower WA, NWI, and MWT than reference imaging (Figure 3). Inter-reader agreement of 3D analysis is shown by Bland-Altman plots in Figure 4.
Table 3. Comparison for morphological measurements between reference and 3D MR images.
| LA (mm2) | WA (mm2) | NWI | MaxWT (mm) | MWT (mm) | |
|---|---|---|---|---|---|
| Reference | 43.35±24.66 | 30.64±16.17 | 0.43±0.11 | 1.62±1.10 | 1.14±0.47 |
| 3D | 43.81±25.74 | 29.40±21.92 | 0.40±0.15 | 1.65±1.33 | 1.09±0.69 |
| Bias (Reference, 3D) | −0.46±11.61 | 1.24±10.65 | 0.03±0.09 | −0.03±0.74 | 0.04±0.36 |
| ICC (95% CI) | 0.89 (0.87, 0.91) | 0.85 (0.81, 0.87) | 0.76 (0.71, 0.80) | 0.80 (0.76, 0.84) | 0.81 (0.77, 0.84) |
LA, lumen area; WA, wall area; NWI, normalized wall index; MaxWT, maximum wall thickness; MWT, mean wall thickness; ICC, intra-class correlation coefficient; CI, confidence interval.
Figure 2.
Scatter plots of reference and 3D morphological measurements by two independent reviewers. LA, lumen area; WA, wall area; NWI, normalized wall index; MaxWT, maximum wall thickness; MWT, mean wall thickness.
Figure 3.
Bland-Altman plots of 3D and reference morphological measurements by two independent reviewers. LA, lumen area; WA, wall area; NWI, normalized wall index; MaxWT, maximum wall thickness; MWT, mean wall thickness.
Figure 4.
Bland-Altman plots of 3D and 3Dr morphological measurements by two independent reviewers. LA, lumen area; WA, wall area; NWI, normalized wall index; MaxWT, maximum wall thickness; MWT, mean wall thickness.
Plaque composition identification
3D multi-contrast imaging showed good agreement with reference to multi-contrast imaging for identification of LRNC (κ=0.66, 95% CI: 0.30–1.00) and CA (κ=0.69, 95% CI: 0.42–0.97), and excellent agreement for IPH (κ=1.00, 95% CI: 1.00–1.00; Table 4). Moreover, 3D multi-contrast imaging showed excellent inter-reader agreement for identification of LRNC (κ=0.87) and IPH (κ=1.00), and good agreement for CA (κ=0.66), as indicated in Table 5.
Table 4. Agreement between reference and 3D multi-contrast imaging in identifying plaque components.
| 3D | Reference | |||||||
|---|---|---|---|---|---|---|---|---|
| LRNC | CA | IPH | ||||||
| Presence | Absence | Presence | Absence | Presence | Absence | |||
| Presence† | 73.08 (19/26) | 7.70 (2/26) | 38.46 (10/26) | 3.85 (1/26) | 34.62 (9/26) | 0 (0/26) | ||
| Absence† | 3.85 (1/26) | 15.38 (4/26) | 11.54 (3/26) | 46.15 (12/26) | 0 (0/26) | 65.38 (17/26) | ||
| Cohen κ (95% CI) | 0.66 (0.30–1.00) | 0.69 (0.42–0.97) | 1.00 (1.00–1.00) | |||||
†Data are percentages, with numbers used to calculate the percentages in parentheses. LRNC, lipid-rich necrotic core; CA, calcification; IPH, intraplaque hemorrhage.
Table 5. Inter-reader agreement of 3D multi-contrast imaging in identifying plaque components.
| Feature | Reader 1† | Reader 2† | Cohen κ (95% CI) |
|---|---|---|---|
| LRNC | 80.77 (21/26) | 84.61 (22/26) | 0.87 (0.61–1.00) |
| CA | 38.46 (10/26) | 30.77 (8/26) | 0.66 (0.36–0.96) |
| IPH | 26.92 (7/26) | 26.92 (7/26) | 1.00 (1.00–1.00) |
†Data are percentages, with numbers used to calculate the percentages in parentheses. LRNC, lipid-rich necrotic core; CA, calcification; IPH, intraplaque hemorrhage; CI, confidence interval.
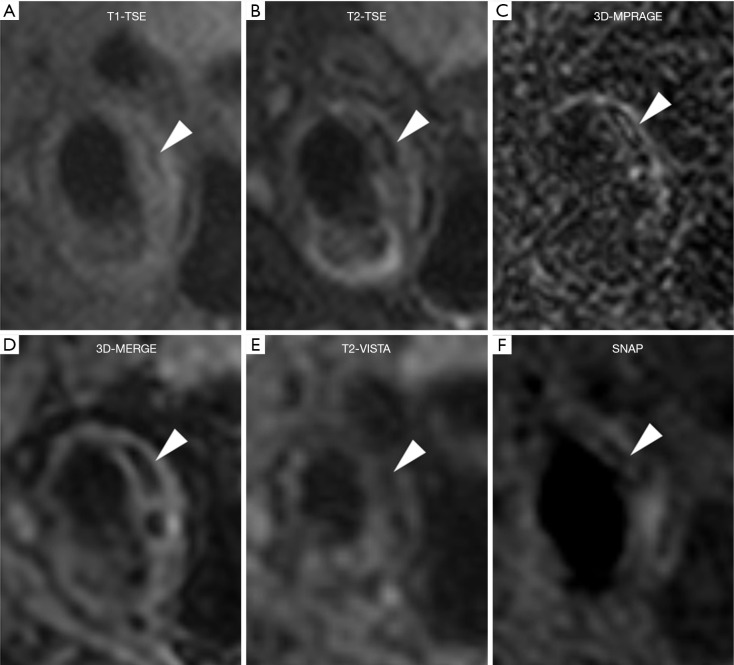
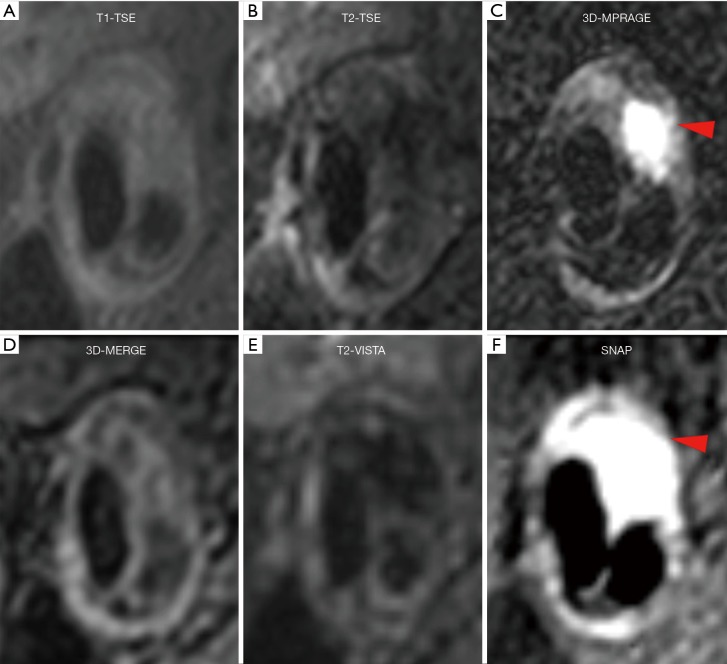
Figure 5 shows a patient with LRNC. LRNC signal was detected in both reference (T1-TSE, T2-TSE) and 3D (MERGE, T2-VISTA) images. Figure 6 shows the hypointense signal of CA in all reference and 3D images, in which 3D images can visualize CA clearer than reference images. Figure 7 shows that the hyperintense signal in 3D-MPRAGE and SNAP reflects the presence of IPH, with SNAP showing a larger IPH area than 3D-MPRAGE. Finally, Figure 8 shows the results of one patient who underwent CEA. The matched H&E histology initially verified the performance of 3D multi-contrast MRI (3D-MERGE, T2-VISTA, and SNAP). 3D MR images demonstrated clear visualization of luminal boundaries, along with components such as hypointense CA and hyperintense IPH.
Figure 5.
Reference (A,B,C) and 3D (D,E,F) multi-contrast vessel wall images from a male patient with LRNC (yellow arrow). T1-TSE, T1-weighted turbo spin echo; T2-TSE, T2-weighted turbo spin echo; 3D-MPRAGE, three-dimensional magnetization-prepared rapid acquisition gradient-echo; 3D-MERGE, 3D motion-sensitized driven equilibrium prepared rapid gradient echo; T2-VISTA, T2-weighted volumetric isotropic turbo spin echo acquisition; SNAP, simultaneous non-contrast angiography and intraplaque hemorrhage.
Figure 6.
Reference (A,B,C) and 3D (D,E,F) multi-contrast vessel wall images from a male patient with CA (white arrow). T1-TSE, T1-weighted turbo spin echo; T2-TSE, T2-weighted turbo spin echo; 3D-MPRAGE, three-dimensional magnetization-prepared rapid acquisition gradient-echo; 3D-MERGE, 3D motion-sensitized driven equilibrium prepared rapid gradient echo; T2-VISTA, T2-weighted volumetric isotropic turbo spin echo acquisition; SNAP, simultaneous non-contrast angiography and intraplaque hemorrhage.
Figure 7.
Reference (A,B,C) and 3D (D,E,F) multi-contrast vessel wall images from a male patient with IPH (red arrow). T1-TSE, T1-weighted turbo spin echo; T2-TSE, T2-weighted turbo spin echo; 3D-MPRAGE, three-dimensional magnetization-prepared rapid acquisition gradient-echo; 3D-MERGE, 3D motion sensitized driven equilibrium prepared rapid gradient echo; T2-VISTA, T2-weighted volumetric isotropic turbo spin echo acquisition; SNAP, simultaneous non-contrast angiography and intraplaque hemorrhage.
Figure 8.
Matching histology verifies the performance of 3D MR images. Hypointense CA is clearly visible on (A) 3D-MERGE and (B) T2-VISTA, and IPH is prominent on (C) SNAP. 3D-MERGE, 3D motion-sensitized driven equilibrium prepared rapid gradient echo; T2-VISTA, T2-weighted volumetric isotropic turbo spin echo acquisition; SNAP, simultaneous non-contrast angiography and intraplaque hemorrhage; CA, calcification; IPH, intraplaque hemorrhage; LU, lumen.
Discussion
In this study, we assessed and compared the performance of reference and 3D multi-contrast vessel wall MR imaging. Our findings show that 3D multi-contrast vessel wall imaging agreed well with reference imaging in both morphological measurements and plaque component identification. Although there were differences in identification of plaque components, our findings support the translation of the histologically validated reference carotid MR image interpretation criteria to 3D multi-contrast imaging, which has the potential to characterize carotid atherosclerosis with good inter-reader reproducibility.
In general, 3D multi-contrast vessel wall imaging can gain better image quality than reference imaging. Benefits of the 3D techniques include extended longitudinal coverage, improved SNR, 0.8 mm isotropic spatial resolution, and reduction in partial volume effects, therefore contributing to better delineation of the vessel wall and characterization of plaque components. 3D multi-contrast vessel wall imaging allows covering from carotid to intracranial arteries, thus has the potential to be used in clinical studies. However, the extra- and intracranial arteries have various background tissues (neck muscles, white matter, gray matter, etc.), introducing a trade-off between extra- and intracranial contrast-to-noise ratio (CNR) for SNAP (16,17). An optimal set of parameters will potentially improve image contrast and SNR. With the developments of parallel imaging and compressed sensing techniques, the scan time of proposed 3D multi-contrast vessel wall imaging can be further reduced (20), which potentially decreases the artifacts introduced by motion during the scan. Moreover, multi contrast images acquired in one sequence will thoroughly solve the registration problem among different contrasts and may help further reduce scan time; i.e., SNAP can provide multi-contrast images and MR angiography, which has the potential to evaluate the carotid plaque by components in addition to morphology. The physical characteristics of the vessel wall including its T2 values can be quantitatively acquired simultaneously with BB MRI by means of compressed sensing and parallel imaging (21), which has potential as a promising quantitative methodology to evaluate carotid atherosclerotic plaques.
In morphological measurements, 3D multi-contrast vessel wall imaging showed good inter-reader reproducibility and obtained good agreement with reference to imaging in LA, WA, MaxWT, and MWT measurements. This study also indicated that WA measured by 3D images is slightly smaller than by reference images, thus resulting in smaller MWT and NWI. This is probably because 3D techniques perform better in blood suppression than reference techniques. Previous studies have reported the reduction of WA and an increase of lumen area measured by MSDE images as compared to other techniques (22), further supporting this inference. In 3D-MERGE, improved MSDE (iMSDE) (23) was used as blood suppression preparation module. By dephasing the flow spins within each voxel, iMSDE can effectively eliminate slow and stagnant flow, especially in the region of the lumen-wall interface or carotid bifurcation. In the 3D review process, 3D-MERGE is mainly used for vessel wall boundary delineation. Thus, it is reasonable to interpret the difference of blood suppression efficiency between reference and 3D techniques as a cause of smaller WA.
In plaque components identification, 3D imaging showed excellent agreement with reference imaging for IPH detection. Compared with 3D-MPRAGE, SNAP provides higher IPH-wall contrast and is more sensitive to IPH (16), which is also illustrated in a representative case (Figure 7). Previous studies have reported that conventional multi-contrast MRI showed a systematic underestimation of IPH area using histology as the gold standard, and this underestimation increased with the size of IPH (9), indicating that SNAP may have the potential to detect plaques with small IPH lesions. Also, good agreement in CA detection was found in between reference and 3D imaging. To detect small details of lesion components such as calcification, 3D-MERGE reformatted to 2 mm slice thickness was reported to have better visualization than PD 2 mm (14). CA can be detected by a hypointense signal in all contrast weightings and can be delineated more clearly using 3D multi-contrast imaging, as indicated in Figure 6. Recent studies showed that SNAP imaging, with high reproducibility, agreed well with conventional reference multi-contrast imaging in identification of CA (24), which was also illustrated in another representative case (Figure 6). As for LRNC detection, T1 and T2 imaging were mainly used. LRNC appears isointense to hyperintense signal on T1-weighted images depending on the amount or age of IPH diffused into LRNC, and previous studies reported a variety of different signal appearances of LRNC from hypointense to hyperintense on T2-weighted images (9,25-27), which demonstrates the challenges of LRNC characterization. Even so, 3D imaging showed good agreement with reference imaging.
There are some limitations to this study. First, quite a large number of imaging slices were not available for image analysis due to either misregistration or poor image quality caused by severe motion. Moreover, in morphological measurement of common carotid bifurcation, both internal and external arteries may be delineated in one dataset, while in the other dataset only internal carotid artery was analyzed due to misregistration between two datasets. This misinterpretation might result in some outliers in Bland-Altman analysis. Furthermore, the field-of-views (FOVs) were different between reference and 3D scans, which might have possibly brought bias in IQ comparison, because 3D images may benefit from a large FOV. The sample size in this study was small, limiting the investigation of other plaque components, such as loose matrix. Since this study is a retrospective one, the 3D sequences used in this study might not have been optimal for carotid atherosclerosis characterization. For instance, the long echo train length of T2-VISTA sequence widened the point spread function and resulted in lower actual resolution, which might have influenced the agreement in LRNC and CA identification. Furthermore, the different in-plane spatial resolution between reference (0.6×0.6 mm2) and 3D (0.8×0.8 mm2) protocol might have reduced the accuracy of 3D delineation. Only one example of histology was compared with matched 3D multi-contrast MRI (3D-MERGE, T2-VISTA, and SNAP), which just provided an initial and rough proof for 3D protocols. More histological data are required to evaluate the reliability and stability of 3D multi-contrast MRI (3D-MERGE, T2-VISTA, and SNAP). It should be noted that this study is only supposed to be considered a preliminary validation of the previously proposed techniques in (17), and further comparison with conventional multi-contrast MRI when setting histology as gold standard is necessary for future work.
In conclusion, 3D multi-contrast vessel wall imaging, with 0.8 mm isotropic resolution and 15 min total scan time, provides comparable performance in morphological measurements and identification of carotid plaque components as reference multi-contrast MRI and has good inter-reader reproducibility.
Acknowledgments
The authors thank Dr. Aiqi Sun, Jifan Li, Yichen Zheng, Ziling Jiao, and Wenwen Chen for their helpful support and suggestions in this work.
Funding: This work was supported by the National Key R&D Program during the “13th Five-Year Plan” (2016YFC1301601 & 2017YFC0109002).
Ethical Statement: This study was approved by the Institutional Review Board at Tsinghua University and the University of Washington, and all the subjects gave written informed consent.
Footnotes
Conflicts of Interest: Dr. Hatsukami received research grants from Philips Healthcare unrelated to this work. The other authors have no conflicts of interest to declare.
References
- 1.Ooi YC, Gonzalez NR. Management of extracranial carotid artery disease. Cardiol Clin 2015;33:1-35. 10.1016/j.ccl.2014.09.001 [DOI] [PMC free article] [PubMed] [Google Scholar]
- 2.Gupta A, Baradaran H, Schweitzer AD, Kamel H, Pandya A, Delgado D, Dunning A, Mushlin AI, Sanelli PC. Carotid plaque MRI and stroke risk: A systematic review and meta-analysis. Stroke 2013;44:3071-7. 10.1161/STROKEAHA.113.002551 [DOI] [PubMed] [Google Scholar]
- 3.Halliday A, Harrison M, Hayter E, Kong X, Mansfield A, Marro J, Pan H, Peto R, Potter J, Rahimi K, Rau A, Robertson S, Streifler J, Thomas D, Asymptomatic Carotid Surgery Trial (ACST) Collaborative Group 10-year stroke prevention after successful carotid endarterectomy for asymptomatic stenosis (ACST-1): a multicentre randomised trial. Lancet 2010;376:1074-84. 10.1016/S0140-6736(10)61197-X [DOI] [PMC free article] [PubMed] [Google Scholar]
- 4.North American Symptomatic Carotid Endarterectomy Trial Collaborators , Barnett HJM, Taylor DW, Haynes RB, Sackett DL, Peerless SJ, Ferguson GG, Fox AJ, Rankin RN, Hachinski VC, Wiebers DO, Eliasziw M. Beneficial effect of carotid endarterectomy in symptomatic patients with high-grade carotid stenosis. North American Symptomatic Carotid Endarterectomy Trial Collaborators. N Engl J Med 1991;325:445-53. [DOI] [PubMed] [Google Scholar]
- 5.Stary HC, Chandler AB, Dinsmore RE, Fuster V, Glagov S, Insull W, Jr, Rosenfeld ME, Schwartz CJ, Wagner WD, Wissler RW. A definition of advanced types of atherosclerotic lesions and a histological classification of atherosclerosis. A report from the Committee on Vascular Lesions of the Council on Arteriosclerosis, American Heart Association. Circulation 1995;92:1355-74. 10.1161/01.CIR.92.5.1355 [DOI] [PubMed] [Google Scholar]
- 6.Kerwin WS, Hatsukami T, Yuan C, Zhao XQ. MRI of carotid atherosclerosis. AJR Am J Roentgenol 2013;200:W304-13. 10.2214/AJR.12.8665 [DOI] [PMC free article] [PubMed] [Google Scholar]
- 7.Yuan C, Mitsumori LM, Beach KW, Marvilla KR. Carotid atherosclerotic plaque: noninvasive MR characterization and identification of vulnerable lesions. Radiology. 2001;221:285-99. 10.1148/radiol.2212001612 [DOI] [PubMed] [Google Scholar]
- 8.Cai JM, Hatsukami TS, Ferguson MS, Small R, Polissar NL, Yuan C. Classification of human carotid atherosclerotic lesions with in vivo multi-contrast magnetic resonance imaging. Circulation 2002;106:1368-73. 10.1161/01.CIR.0000028591.44554.F9 [DOI] [PubMed] [Google Scholar]
- 9.Saam T, Ferguson MS, Yarnykh VL, Takaya N, Xu D, Polissar NL, Hatsukami TS, Yuan C. Quantitative evaluation of carotid plaque composition by in vivo MRI. Arterioscler Thromb Vasc Biol 2005;25:234-9. 10.1161/01.ATV.0000149867.61851.31 [DOI] [PubMed] [Google Scholar]
- 10.Zhao X, Underhill HR, Zhao Q, Cai J, Li F, Oikawa M, Dong L, Ota H, Hatsukami TS, Chu B, Yuan C. Discriminating carotid atherosclerotic lesion severity by luminal stenosis and plaque burden: a comparison utilizing high-resolution magnetic resonance imaging at 3.0 Tesla. Stroke 2011;42:347-53. 10.1161/STROKEAHA.110.597328 [DOI] [PMC free article] [PubMed] [Google Scholar]
- 11.Zhao X, Underhill HR, Zhao Q, Cai J, Li F, Oikawa M, Dong L, Ota H, Hatsukami TS, Chu B, Yuan C. Minimization of MR contrast weightings for the comprehensive evaluation of carotid atherosclerotic disease. Invest Radiol 2010;45:36-41. 10.1097/RLI.0b013e3181beada7 [DOI] [PMC free article] [PubMed] [Google Scholar]
- 12.Ota H, Yarnykh VL, Ferguson MS, Underhill HR, Demarco JK, Zhu DC, Oikawa M, Dong L, Zhao X, Collar A, Hatsukami TS, Yuan C. Carotid intraplaque hemorrhage imaging at 3.0T MR imaging: comparison of the diagnostic performance of three T1-weighted sequences. Radiology 2010;254:551-63. 10.1148/radiol.09090535 [DOI] [PMC free article] [PubMed] [Google Scholar]
- 13.Saba L, Yuan C, Hatsukami TS, Balu N, Qiao Y, DeMarco JK, Saam T, Moody AR, Li D, Matouk CC, Johnson MH, Jäger HR, Mossa-Basha M, Kooi ME, Fan Z, Saloner D, Wintermark M, Mikulis DJ, Wasserman BA, Vessel Wall Imaging Study Group of the American Society of Neuroradiology Vessel Wall Imaging Study Group of the American Society of Neuroradiology. Carotid Artery Wall Imaging: Perspective and Guidelines from the ASNR Vessel Wall Imaging Study Group and Expert Consensus Recommendations of the American Society of Neuroradiology. AJNR Am J Neuroradiol 2018;39:E9-31. 10.3174/ajnr.A5488 [DOI] [PMC free article] [PubMed] [Google Scholar]
- 14.Balu N, Yarnykh VL, Chu B, Wang J, Hatsukami T, Yuan C. Carotid plaque assessment using fast 3D isotropic resolution black-blood MRI. Magn Reson Med. 2011;65:627-37. 10.1002/mrm.22642 [DOI] [PMC free article] [PubMed] [Google Scholar]
- 15.Fan Z, Zhang Z, Chung YC, Weale P, Zuehlsdorff S, Carr J, Li D. Carotid arterial wall MRI at 3 T using 3D variable-flip-angle turbo spin-echo (TSE) with flow- sensitive dephasing (FSD). J Magn Reson Imaging 2010;31:645-54. 10.1002/jmri.22058 [DOI] [PMC free article] [PubMed] [Google Scholar]
- 16.Wang J, Börnert P, Zhao H, Hippe DS, Zhao X, Balu N, Ferguson MS, Hatsukami TS, Xu J, Yuan C, Kerwin WS. Simultaneous noncontrast angiography and intraplaque hemorrhage (SNAP) imaging for carotid atherosclerotic disease evaluation. Magn Reson Med 2013;69:337-45. 10.1002/mrm.24254 [DOI] [PMC free article] [PubMed] [Google Scholar]
- 17.Zhou Z, Li R, Zhao X, He L, Wang X, Wang J, Balu N, Yuan C. Evaluation of 3D multi-contrast joint intra- and extracranial vessel wall cardiovascular magnetic resonance. J Cardiovasc Magn Reson 2015;17:41. 10.1186/s12968-015-0143-z [DOI] [PMC free article] [PubMed] [Google Scholar]
- 18.Underhill HR, Yarnykh VL, Hatsukami TS, Wang J, Balu N, Hayes CE, Oikawa M, Yu W, Xu D, Chu B, Wyman BT, Polissar NL, Yuan C. Carotid plaque morphology and composition: initial comparison between 1.5- and 3.0-T magnetic field strengths. Radiology 2008;248:550-60. 10.1148/radiol.2482071114 [DOI] [PMC free article] [PubMed] [Google Scholar]
- 19.Kerwin W, Xu D, Liu F, Saam T, Underhill H, Takaya N, Chu B, Hatsukami T, Yuan C. Magnetic resonance imaging of carotid atherosclerosis: Plaque analysis. Top Magn Reson Imaging 2007;18:371-8. 10.1097/rmr.0b013e3181598d9d [DOI] [PubMed] [Google Scholar]
- 20.Okuchi S, Fushimi Y, Okada T, Yamamoto A, Okada T, Kikuchi T, Yoshida K, Susumu Miyamoto, Togashi K. Visualization of carotid vessel wall and atherosclerotic plaque: T1-SPACE vs. compressed sensing T1-SPACE. Eur Radiol. 2019;29:4114-22. 10.1007/s00330-018-5862-8 [DOI] [PubMed] [Google Scholar]
- 21.Yuan J, Usman A, Reid SA, King KF, Patterson AJ, Gillard JH, Graves MJ. Three-dimensional black-blood T2 mapping with compressed sensing and data-driven parallel imaging in the carotid artery. Magn Reson Imaging 2017;37:62-9. 10.1016/j.mri.2016.11.014 [DOI] [PubMed] [Google Scholar]
- 22.Wang J, Yarnykh VL, Hatsukami T, Chu B, Balu N, Yuan C. Improved suppression of plaque-mimicking artifacts in black- blood carotid atherosclerosis imaging using a multislice motion- sensitized driven equilibrium (MSDE) turbo spin-echo (TSE) sequence. Magn Reson Med 2007;58:973-81. 10.1002/mrm.21385 [DOI] [PubMed] [Google Scholar]
- 23.Wang J, Yarnykh VL, Yuan C. Enhanced image quality in black-blood MRI using the improved Motion-Sensitized Driven-Equilibrium (iMSDE) sequence. J Magn Reson Imaging 2010;31:1256-63. 10.1002/jmri.22149 [DOI] [PMC free article] [PubMed] [Google Scholar]
- 24.Chen S, Zhao H, Li J, Zhou Z, Li R, Balu N, Yuan C, Chen H, Zhao X. Evaluation of carotid atherosclerotic plaque surface characteristics utilizing simultaneous noncontrast angiography and intraplaque hemorrhage (SNAP) technique. J Magn Reson Imaging 2018:47:634-39. 10.1002/jmri.25815 [DOI] [PMC free article] [PubMed] [Google Scholar]
- 25.Toussaint JF, LaMuraglia GM, Southern JF, Fuster V, Kantor HL. Magnetic resonance images lipid, fibrous, calcified, hemorrhagic, and thrombotic components of human atherosclerosis in vivo. Circulation 1996;94:932-8. 10.1161/01.CIR.94.5.932 [DOI] [PubMed] [Google Scholar]
- 26.Yuan C, Mitsumori LM, Ferguson MS, Polissar NL, Echelard D, Ortiz G, Small R, Davies JW, Kerwin WS, Hatsukami TS. In vivo accuracy of multispectral magnetic resonance imaging for identifying lipid-rich necrotic cores and intraplaque hemorrhage in advanced human carotid plaques. Circulation 2001;104:2051-6. 10.1161/hc4201.097839 [DOI] [PubMed] [Google Scholar]
- 27.Shinnar M, Fallon JT, Wehrli S, Levin M, Dalmacy D, Fayad ZA, Badimon JJ, Harrington M, Harrington E, Fuster V. The diagnostic accuracy of ex vivo MRI for human atherosclerotic plaque characterization. Arterioscler Thromb Vasc Biol 1999;19:2756-61. 10.1161/01.ATV.19.11.2756 [DOI] [PubMed] [Google Scholar]


