Abstract
Purpose:
Task Group 204 introduced effective diameter (ED) as the patient size metric used to correlate size‐specific‐dose‐estimates. However, this size metric fails to account for patient attenuation properties and has been suggested to be replaced by an attenuation‐based size metric, water equivalent diameter (DW). The purpose of this study is to investigate different size metrics, effective diameter, and water equivalent diameter, in combination with regional descriptions of scanner output to establish the most appropriate size metric to be used as a predictor for organ dose in tube current modulated CT exams.
Methods:
101 thoracic and 82 abdomen/pelvis scans from clinically indicated CT exams were collected retrospectively from a multidetector row CT (Sensation 64, Siemens Healthcare) with Institutional Review Board approval to generate voxelized patient models. Fully irradiated organs (lung and breasts in thoracic scans and liver, kidneys, and spleen in abdominal scans) were segmented and used as tally regions in Monte Carlo simulations for reporting organ dose. Along with image data, raw projection data were collected to obtain tube current information for simulating tube current modulation scans using Monte Carlo methods. Additionally, previously described patient size metrics [ED, DW, and approximated water equivalent diameter (D Wa)] were calculated for each patient and reported in three different ways: a single value averaged over the entire scan, a single value averaged over the region of interest, and a single value from a location in the middle of the scan volume. Organ doses were normalized by an appropriate mAs weighted CTDIvol to reflect regional variation of tube current. Linear regression analysis was used to evaluate the correlations between normalized organ doses and each size metric.
Results:
For the abdominal organs, the correlations between normalized organ dose and size metric were overall slightly higher for all three differently (global, regional, and middle slice) reported DW and D Wa than they were for ED, but the differences were not statistically significant. However, for lung dose, computed correlations using water equivalent diameter calculated in the middle of the image data (D W,middle) and averaged over the low attenuating region of lung (D W,regional) were statistically significantly higher than correlations of normalized lung dose with ED.
Conclusions:
To conclude, effective diameter and water equivalent diameter are very similar in abdominal regions; however, their difference becomes noticeable in lungs. Water equivalent diameter, specifically reported as a regional average and middle of scan volume, was shown to be better predictors of lung dose. Therefore, an attenuation‐based size metric (water equivalent diameter) is recommended because it is more robust across different anatomic regions. Additionally, it was observed that the regional size metric reported as a single value averaged over a region of interest and the size metric calculated from a single slice/image chosen from the middle of the scan volume are highly correlated for these specific patient models and scan types.
Keywords: approximation theory, biological tissues, biomedical equipment, bio‐optics, computerised tomography, correlation methods, data acquisition, dosimetry, feature extraction, feature selection, image segmentation, kidney, liver, lung, medical image processing, Monte Carlo methods, physiological models, regression analysis, water, X‐ray tubes
Keywords: Computed tomography, Dosimetry/exposure assessment, Dose‐volume analysis, Algorithms, Segmentation
Keywords: Computerised tomographs; Biological material, e.g. blood, urine; Haemocytometers; Methods or arrangements for processing data by operating upon the order or content of the data handled; Digital computing or data processing equipment or methods, specially adapted for specific applications; Image data processing or generation, in general; X‐ray tubes; Devices sensitive to very short wavelength, e.g. x‐rays, gamma‐rays or corpuscular radiation; Transforming x‐rays; X‐ray technique; Scintigraphy
Keywords: CT, Monte Carlo, dosimetry, tube current modulation, water equivalent diameter
Keywords: Lungs, Computed tomography, Dosimetry, Monte Carlo methods, Image scanners, Kidneys, Tissues, Medical image segmentation
1. INTRODUCTION
Turner et al. 1 showed the value of using CTDIvol as a normalization factor, resulting in scanner‐independent organ dose coefficients that are size dependent. Using patient's perimeter as the size metric along with scanner‐reported CTDIvol and scanner‐independent organ dose coefficients, dose to abdominal organs from fixed tube current (FTC) CT exams could be estimated. Hence, a measure of patient size is essential in obtaining accurate estimates of organ dose from CT exams.
AAPM Task Group 204 (Ref. 2) extended this and used effective diameter (ED) as patient size descriptor to adjust scanner‐reported CTDIvol for size. Effective diameter is the diameter of a circle that has the same cross sectional area as the patient at a given z‐axis or longitudinal location. This was used to obtain the size‐specific dose estimates (SSDE). Effective diameter can be estimated using measured lateral and anterior–posterior distance of the patient using either the projectional radiograph used as a localizer or axial CT images. These measurements can be either performed on work stations using electronic measuring tools or physical devices such as calipers.
Effective diameter is a simple physical measure of the patient's outer diameter, and therefore, does not account for patient's composition and attenuation properties. Knowing that it is not solely the physical dimensions of the patient but also patient's attenuation properties that affect the amount of energy absorbed, it is reasonable to hypothesize an improved dose estimate if an attenuation‐based metric is utilized to describe the differences among patients instead of measures of physical dimensions such as effective diameter. As an example, the measured effective diameter of a patient taken in the thoracic area and abdominal region can be the same, but due to lung's lower density and different compositions as compared to abdomen, for the same amount of CT output, thorax would attenuate fewer photons and therefore have a higher absorbed dose than abdomen. Hence, results from TG 204 may underestimate actual dose to the thoracic region, i.e., lungs. Corrections factors generated by TG 204 resulted from measurements and simulations performed in phantoms with composition and density close to water; hence, the relationship between effective diameter and water equivalent diameter (DW) for all of the phantoms and models that were included in the TG 204 analysis is close to unity.
In addition to the need for a more appropriate patient size metric for accurate dose estimation, knowledge of regional tube current variation in tube current modulation (TCM) scans is also necessary, which was not considered in either of the previously cited efforts. The organ dose coefficients published by Turner et al. and TG 204 conversion factors were both based on fixed tube current simulations and measurements. As shown in earlier papers on TCM, 3 , 4 , 5 tube current variations along the scan length can be significant and result in lower and even sometimes higher organ doses as compared to fixed tube current exams. Therefore, accurate estimates of organ dose from TCM scans, which are used in the vast majority of scans performed clinically, require the knowledge of both, the TCM function, regional description of scanner output, as well as description of patient size. Additionally, since tube current variation in TCM is a direct result of patient's attenuation and composition, a regional description of both TCM and patient size may result in more accurate organ dose estimates.
Although, water equivalent diameter has been previously explored 6 , 7 , 8 , 9 , 10 , 11 as an alternative size metric and compared to different body size parameters, 12 its role in estimating organ dose and specifically, its correlation with patient‐specific organ dose, has not yet been investigated. Additionally, none of the previously published studies considered the effects of tube current modulation and how this will impact the correlation between patient size and organ dose.
Therefore, the purpose of this study is to investigate different size metrics in combination with regional descriptions of scanner output to establish the most appropriate size metric to be used as a predictor for organ dose in tube current modulated CT exams. To do this, three different size metrics, ED, DW, and approximated water equivalent diameter (D Wa), were investigated and specifically characterized in terms of their correlation with CTDIvol,regional normalized organ doses.
2. METHODS
To investigate the performance of different size metrics as organ dose predictors, the exponential form of the relationship between normalized organ dose and size as described by TG 204 was explored for each size metric [Eq. (1)]. However, to account for local variations in tube current and scanner output, a previously introduced regional descriptor of scanner output, 5 CTDIvol,regional, was used as the normalizing quantity in Eq. (1). As described below, the organ doses were determined from detailed Monte Carlo simulations. Then, the A and B coefficients for each size metric were determined based on relationship described by Eq. (1),
| (1) |
2.A. Voxelized models and Monte Carlo simulations
101 thoracic (51 females and 50 males) and 82 abdomen/pelvis (41 females and 41 males) scans were collected retrospectively from clinically indicated CT exams with Institutional Review Board (IRB) approval. All scans were acquired on Siemens Sensation 64 MDCT and were used to generate voxelized models for use in Monte Carlo simulations. All voxelized models were generated from images reconstructed at 500 mm DFOV to ensure coverage of the entire body. The data set consisted of a large range of sizes from pediatric to very large adult patients. Thoracic models included 30 pediatric patients and the abdomen/pelvis models included 20 pediatric patients. Liver, spleen, and kidneys were identified and segmented on the abdomen/pelvis CT images, while thoracic images were used to identify and segment lungs and glandular breast tissue, which was only segmented on female models. 3 , 4 , 13 , 14
2.B. Monte Carlo‐based organ dose simulations
A previously developed and validated Monte Carlo based CT dosimetry package was used to estimate organ doses from tube current modulated thoracic and abdomen/pelvis CT exams. 3 , 4 , 5 , 15 , 16 , 17 , 18 The default source code of mcnpx (Monte Carlo N‐Particle eXtended v2.6.0) 19 , 20 was modified to enable simulation of various protocols and scan modes such as helical scan. All simulations were performed in photon transport mode with a low‐energy cutoff of 1 keV.
For each simulated photon, mcnpx tally type *F4 was used to track energy fluence in organs of interest and multiplied by mass energy‐absorption coefficients (μ en/ρ) to convert to collision kerma. The resulting dose per simulated photon for each organ was converted to dose per tube current (mA) by multiplying the Monte Carlo output by a normalization factor, which is scanner, collimation, and kVp dependent and is used to take into account the fluence changes from varying the beam collimation. Absolute organ doses were obtained by multiplying dose per mAs (tube current times rotation time) by the product of maximum tube current value obtained from each patient's TCM data, the exam's number of rotations, and rotation time. 3 , 4 , 5
2.C. Regional‐specific CTDIvol
For each patient, calculated regional CTDIvol, using scanner‐reported CTDIvol, which in Siemens is calculated using the global averaged mAs along with regional averaged tube current values, was used as normalization factors for Monte Carlo simulated organ doses. As previously shown, 5 CTDIvol,regional values are better normalization quantities in tube current modulated CT scans compared to global CTDIvol. In this study, CTDIvol,regional was used to investigate the most appropriate size metric as an organ dose predictor. Table I summarizes the definition of regional CTDIvol values in abdomen/pelvis and chest CT exams.
Table I.
Tabular description and abbreviation of regional CTDIvol.
| Exam | Definition | Abbreviation |
|---|---|---|
| Abdomen/pelvis | Top of liver to the iliac crest | CTDIvol,abd |
| Chest | Inferior edge of the scapula and superior boundary of the liver | CTDIvol,Low Att |
2.D. Size metrics
A semiautomated segmentation tool based on a combination of Otsu thresholding and 3D region growing 21 was utilized to segment out the whole body from the surrounding air and the table for calculating effective diameter, as defined in TG 204, and DW, water equivalent diameter, on each axial image. DW is defined as 6 , 7 , 11 , 12
| (2) |
where ρ is the average attenuation of the patient defined as
| (3) |
With N being the number of voxels within the patient, and A Patient the area of the patient defined as
| (4) |
with A Pixel being the area of each pixel.
A second attenuation based size metric, the D Wa is defined similarly with the exception of the average attenuation being inside the radical, 11 , 12 as shown in Eq. (5). This simplifies the calculation of water equivalent diameter, in which no contouring is required and the entire image can be used to calculate A Patient, A Pixel, and ρ. However, this method is expected to be less accurate since it is using a square root of average attenuation instead of average attenuation to keep the overall water‐equivalent area (AW) unchanged
| (5) |
| (6) |
Although this method includes the surrounding air in the calculation, which can vary from one patient to another, it does not dramatically affect the value of AW. For instance, if less surrounding air is included in the calculation of D Wa, the mean CT number (ρ) increases but the area of the image, A image, decreases proportionally so that the product AW remains relatively unchanged. Hence, for calculating D Wa, the average density or mean CT number ρ is taken inside the radical to keep AW unchanged. This approach was explored by Wang et al. 7 and it was established that inclusion of table and hence the surrounding air results in overestimation of DW, especially for smaller patients.
The tool was applied on each set of patient images to segment out the body from the surrounding air and the table; the segmented region was used to calculate an ED and DW per image. Additionally, pixel values of entire axial image (including the surrounding air) within a series were used to calculate a D Wa, per image, reconstructed at 500 mm FOV.
For each patient, each size metric was reported in three different ways
-
1.
As a global average size metric, calculated over all images within each scan (either abdomen/pelvis scan or chest scan): EDglobal, D W,global, D Wa,global.
-
2.
As a regional average size metric, calculated using images within abdomen region for abdomen/pelvis models and low attenuating region for thoracic models (i.e., EDLow Att, D W,Low Att, D Wa,Low Att, EDabd, D W,abd, D Wa,abd).
-
3.
As a single value measured approximately in the middle of the scan (abdomen/pelvis and chest scan), e.g., EDmiddle, D W,middle, D Wa,middle.
The definition of “regional” in both, abdomen/pelvis and thorax, is given in Table I and corresponds to the same regions for which regional CTDIvol values were calculated.
2.E. Statistical analysis
Linear regressions were used to investigate the effect of different size metrics on normalized organ doses. The log‐transformation of normalized organ dose was used to fit a linear regression with the covariate of different metrics. The coefficient of determination (R 2) was reported to quantify the proportion of variation explained by different size metrics and to evaluate the benefit of using each size metric. A scatter diagram with a fitted exponential curve, as described by Eq. (1), is used to demonstrate the relationship between normalized organ dose and individual size metrics for each organ. Pearson correlation coefficients and 95% confidence intervals (CI) were reported from the log‐transformed linear regression. The 95% confidence intervals of different size metrics were compared to each other and a p‐value smaller than 0.05 was considered to be significant. All data were analyzed using Stata 12.0 (StataCorp; College Station, TX).
3. RESULTS
In the abdominal region, the various tissues can be approximated as water with a density close to 1 g/cm3. Therefore, in the abdominal region, the mean CT number ρ is close to unity and so DW is almost equal to ED. However, in the thoracic area, due to low attenuating lungs and density lower than water, the mean CT number is smaller than unity, and therefore, DW is smaller than ED. Figure 1 illustrates the difference between DW and ED in thoracic and abdomen/pelvis regions. The difference between ED and DW is not as profound in abdomen/pelvis as it is in thorax; in particular, the difference becomes significant in the low attenuating region of the thorax, which contains most of the lung and is defined as the region between the inferior edge of the scapula and superior boundary of the liver. As shown in Fig. 1, all abdomen/pelvic CT scans include a portion of the thoracic region, encompassing some section of the lungs. Hence, the difference between ED and DW increases in this specific region, represented here with a dashed ellipse in Fig. 1.
Figure 1.
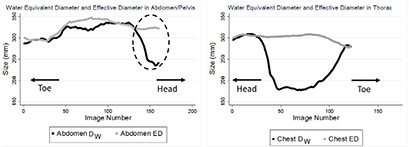
Left: The difference between ED and DW in an abdomen/pelvis scan, showing almost no difference except toward the end of the scan which includes some sections of the thorax, illustrated with an enclosed ellipse on the figure. Right: The difference between ED and DW in thorax, indicating a visible difference between these metrics in the thoracic area.
The difference between ED and DW was statistically not significant in the abdominal region, while in the low attenuating region of the thoracic area, the difference was observed to be statistically significant.
For D Wa, no statistically significant difference was observed compared to ED and DW. Figure 2 shows the difference between global and regional D Wa and DW in the thorax and abdomen. In abdomen, both regional and global D Wa slightly overestimate regional and global DW in a linear fashion. Additionally, no difference is observed between regional and global averaged of the size metric, i.e., in the abdominal scans, size can be reported either as a regional average or global. Meanwhile, the difference between DW and D Wa in thoracic scans is more noticeable. Furthermore, a distinct difference is seen between regional and global average of both DW and D Wa.
Figure 2.
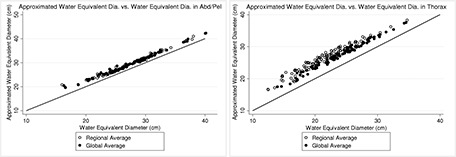
Left: The difference between regional and global D Wa and DW in abdomen/pelvis scans, showing small overestimation of DW by D Wa and almost no difference between regional and global average. Right: The difference between D Wa and DW in chest scans, indicating a visible difference between these metrics in the thoracic area, and also a noticeable difference between differently reporting them, i.e., as a regional versus global average.
The relationship between organ dose normalized by CTDIvol,regional and size was investigated and compared across all metrics. Tables II, III, IV, V, VI summarize these results for all five organs, while Fig. 3 shows the exponentially fitted data for normalized kidney and lung dose. For the abdominal/pelvic organs, Tables II, III, IV, report the R 2, Pearson correlation coefficients, and the 95% confidence interval of normalized abdominal organ doses for each combination of the size metrics. Although the R 2 value slightly increases for DW and D Wa compared to ED, this increase is not statistically significant. Furthermore, the different variations of measuring size (i.e., global average, regional average, and single value from approximately the middle of the scan volume) do not result in statistically significant differences.
Table II.
R 2, Pearson correlation, and 95% confidence interval of normalized liver dose by CTDIvol,regional and size metrics. a
| CTDIvol,abd | ||||||||
|---|---|---|---|---|---|---|---|---|
| Size metricglobal | Size metricregional | Size metricmiddle | ||||||
| Organ | Metric | n | r (95% CI) | R 2 | r (95% CI) | R 2 | r (95% CI) | R 2 |
| ED | 82 | −0.9181(−0.947, −0.876) | 0.84 | −0.9261(−0.952, −0.887) | 0.86 | −0.9085(−0.940, −0.861) | 0.83 | |
| Liver | DW | 82 | −0.9365(−0.959, −0.903) | 0.88 | −0.9452(−0.964, −0.916) | 0.89 | −0.9198(−0.948, −0.878) | 0.85 |
| D Wa | 82 | −0.9434(−0.963, −0.913) | 0.89 | −0.9507(−0.968, −0.924) | 0.90 | −0.9298(−0.954, −0.893) | 0.86 | |
Log transformation is applied for Pearson correlation and 95% confidence interval.
Table III.
R 2, Pearson correlation, and 95% confidence interval of normalized spleen dose by CTDIvol,regional and size metrics. a
| CTDIvol,abd | ||||||||
|---|---|---|---|---|---|---|---|---|
| Size metricglobal | Size metricregional | Size metricmiddle | ||||||
| Organ | Metric | n | r (95% CI) | R 2 | r (95% CI) | R 2 | r (95% CI) | R 2 |
| ED | 82 | −0.8686(−0.913, −0.803) | 0.75 | −0.8732(−0.917, −0.810) | 0.76 | −0.8543(−0.904, −0.782) | 0.73 | |
| Spleen | DW | 82 | −0.8658(−0.912, −0.799) | 0.75 | −0.8688(−0.914, −0.803) | 0.75 | −0.8433(−0.896, −0.767) | 0.71 |
| D Wa | 82 | −0.8713(−0.915, −0.807) | 0.76 | −0.8694(−0.914, −0.804) | 0.76 | −0.8507(−0.901, −0.777) | 0.72 | |
Log transformation is applied for Pearson correlation and 95% confidence interval.
Table IV.
R 2, Pearson correlation, and 95% confidence interval of normalized kidney dose by CTDIvol,regional and size metrics. a
| CTDIvol,abd | ||||||||
|---|---|---|---|---|---|---|---|---|
| Size metricglobal | Size metricregional | Size metricmiddle | ||||||
| Organ | Metric | n | r (95% CI) | R 2 | r (95% CI) | R 2 | r (95% CI) | R 2 |
| ED | 82 | −0.8560(−0.905, −0.785) | 0.73 | −0.8626(−0.909, −0.794) | 0.73 | −0.8512(−0.902, −0.778) | 0.72 | |
| Kidney | DW | 82 | −0.8557(−0.905, −0.784) | 0.73 | −0.8702(−0.915, −0.805) | 0.76 | −0.8618(−0.909, −0.793) | 0.74 |
| D Wa | 82 | −0.8678(−0.913, −0.802) | 0.75 | −0.8760(−0.918, −0.814) | 0.77 | −0.8678(−0.913, −0.802) | 0.75 | |
Log transformation is applied for Pearson correlation and 95% confidence interval.
Table V.
R 2, Pearson correlation, and 95% confidence interval of normalized lung dose by CTDIvol,regional and size metrics. a
| CTDIvol,Low Att | ||||||||
|---|---|---|---|---|---|---|---|---|
| Size metricglobal | Size metricregional | Size metricmiddle | ||||||
| Organ | Metric | n | r (95% CI) | R 2 | r (95% CI) | R 2 | r (95% CI) | R 2 |
| ED | 101 | −0.6498(−0.750, −0.520) | 0.42 | −0.6579(−0.756, −0.531) | 0.43 | −0.6647(−0.761, −0.539) | 0.44 | |
| Lung | DW | 101 | −0.7148(−0.799, −0.604) | 0.51 | −0.8311 b (−0.883, −0.759) | 0.70 | −0.8350 b (−0.886, −0.764) | 0.70 |
| D Wa | 101 | −0.6858(−0.777, −0.566) | 0.47 | −0.7751(−0.843, −0.683) | 0.60 | −0.7833(−0.849, −0.694) | 0.61 | |
Log transformation is applied for Pearson correlation and 95% confidence interval.
Statistically significant improvement (p‐value <0.05) compared to effective diameter by using log transformation.
Table VI.
R 2, Pearson correlation, and 95% confidence interval of normalized breast dose by CTDIvol,regional and size metrics. a
| CTDIvol,Low Att | ||||||||
|---|---|---|---|---|---|---|---|---|
| Size metricglobal | Size metricregional | Size metricmiddle | ||||||
| Organ | Metric | n | r (95% CI) | R 2 | r (95% CI) | R 2 | r (95% CI) | R 2 |
| ED | 51 | −0.8100(−0.887, −0.688) | 0.66 | −0.8385(−0.905, −0.732) | 0.70 | −0.8464(−0.910, −0.744) | 0.72 | |
| Breasts | DW | 51 | −0.7860(−0.873, −0.652) | 0.62 | −0.8302(−0.900, −0.719) | 0.69 | −0.8329(−0.902, −0.723) | 0.69 |
| D Wa | 51 | −0.7917(−0.876, −0.660) | 0.63 | −0.8341(−0.902, −0.725) | 0.70 | −0.8404(−0.906, −0.735) | 0.71 | |
Log transformation is applied for Pearson correlation and 95% confidence interval.
Figure 3.
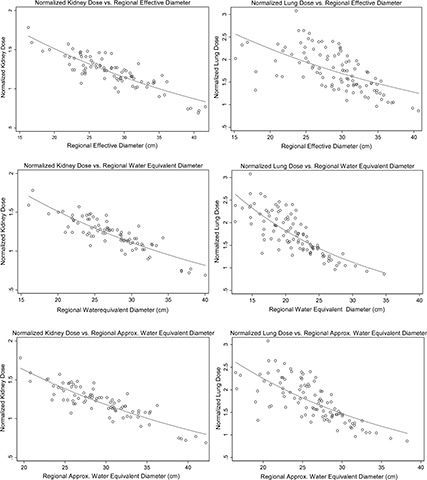
Illustration of normalized kidney and lung dose versus regional average ED, DW, and D Wa. The improvement of fitted normalized lung dose with DW is evident compared to ED.
Table V summarizes the statistical analysis for different size metrics investigated for the normalized lung dose, showing 70% of the variation of size being explained by DW, while only 42% is explained by ED. Similarly the R 2 increases for D Wa; however, it is not statistically significantly different from DW. The only statistically significant improvement of using DW over ED is observed in regional average (low attenuating region of thorax) D W,Low Att and D W,middle. Additionally, for lungs, there was no significant difference between D W,Low Att and D W,middle.
Similar to the abdominal organs, no significant improvement in correlation between normalized breast dose and size was observed when attenuation‐based metrics (DW and D Wa) were employed (Table VI) as compared to results obtained with effective diameter. Also, no significant difference was observed among differently reported size metrics, global, regional, and single value measured in the middle of the scan volume.
Figure 3 illustrates the exponential fit of normalized kidney and lung dose by CTDIvol,regional versus three different regional average size metrics.
Exponential regression equations, as described by Eq. (1), were obtained for all five organs. The coefficients (A and B), along with the correlation coefficient of the exponential regression analysis (R 2), are displayed in Table VII for DW and D Wa. Each model was used to estimate dose to each organ and compared to simulated organ doses. Table VII lists percent minimum, maximum, and average for this comparison.
Table VII.
Results of the exponential regression analysis describing normalized organ dose by regional CTDIvol as a function of DW and D Wa.
| Size metricregional | Size metricmiddle | ||||||||||||
|---|---|---|---|---|---|---|---|---|---|---|---|---|---|
| Organ | A | B | R 2 | %Max | %Min | %Ave | A | B | R 2 | %Max | %Min | %Ave | |
| Liver | DW | 3.60 | −0.040 | 0.89 | 21.7 | 0.2 | 5.4 | 3.04 | −0.034 | 0.85 | 27.0 | 0.06 | 6.5 |
| D Wa | 4.20 | −0.043 | 0.90 | 17.7 | 0.01 | 4.8 | 3.47 | −0.036 | 0.86 | 26.8 | 0.02 | 6.1 | |
| Spleen | DW | 2.70 | −0.030 | 0.75 | 36.9 | 0.2 | 6.2 | 2.39 | −0.025 | 0.71 | 39.8 | 0.2 | 6.8 |
| D Wa | 2.96 | −0.031 | 0.76 | 34.7 | 0.01 | 6.2 | 2.59 | −0.026 | 0.72 | 38.1 | 0.2 | 6.7 | |
| Kidneys | DW | 2.79 | −0.031 | 0.76 | 22.7 | 0.02 | 7.1 | 2.50 | −0.027 | 0.74 | 22.8 | 0.3 | 7.5 |
| D Wa | 3.09 | −0.032 | 0.77 | 27.2 | 0.09 | 7.1 | 2.72 | −0.028 | 0.75 | 24.8 | 0.2 | 7.5 | |
| Lungs | DW | 4.81 | −0.048 | 0.69 | 38.5 | 0.07 | 12.0 | 4.86 | −0.049 | 0.70 | 40.0 | 0.4 | 11.58 |
| D Wa | 5.27 | −0.042 | 0.60 | 44.5 | 0.1 | 14.3 | 5.37 | −0.043 | 0.61 | 39.7 | 0.01 | 13.6 | |
| Breasts | DW | 3.44 | −0.045 | 0.69 | 31.7 | 0.3 | 10.1 | 3.40 | −0.045 | 0.69 | 33.7 | 0.6 | 10.0 |
| D Wa | 4.80 | −0.049 | 0.70 | 31.8 | 0.04 | 9.9 | 4.80 | −0.049 | 0.71 | 34.4 | 0.6 | 9.8 | |
4. DISCUSSION
Simulated organ doses were normalized by CTDIvol,regional and their correlation with different size metrics was investigated. As expected for the abdominal organs, no significant improvement was observed when DW and D Wa were used as patient size metrics compared to previously recommended metric, ED. Furthermore, no statistically significant difference was observed between global, regional, and middle of the scan volume measures of a size metric.
For lungs and breasts, although the hypothesis was an improvement in the exponential relationship between normalized dose and size metric, the improvements were only statistically significant in lungs for D W,regional and D W,middle. This indicates that there is no difference between the different regions over which DW is calculated, i.e., either as an average over a specific region or from a single image chosen from the middle of the scan length.
For three out of five organs, the R 2 value increased with the use of an attenuation based metric; however, the increase in R 2 was only statistically significant for lung dose once D W,regional and D W,middle were employed. These results suggest that overall there is no statistically significant difference between investigated size metrics along the z‐axis of the patient except for lower attenuating regions of thorax.
A scatter plot with identity line demonstrating EDregional versus D W,regional was used to understand the relationship between these size metrics and the importance of the low attenuating region within thorax [Fig. 4(b)]. As illustrated, ED overestimates DW across all patients. However, there seem to be a varying degree of overestimation which is very patient dependent. In Fig. 4(b), the depicted obese patient has a larger ratio of soft tissue (fat and muscle) to lung tissue and ED overestimates D W,regional only by 5 cm. In addition to being obese, this specific patient has one arm in the scan field of view, which further increases the ratio of soft tissue (and bone) to lung tissue. For a more average looking patient, ED overestimates D W,regional by 13 cm. For the pediatric patient, the overestimation is only by 4.5 cm. This varying degree of difference between ED and DW is more extreme once the DW is averaged over the low attenuating region compared to the global average, which artificially decreases the difference between ED and DW [Fig. 5(b)]. Compared to abdominal regions, ED and DW are very similar in magnitude as shown in Fig. 5(a). And there is no difference between regional versus global average of the size metrics [Fig. 5(a)]. Figure 6(b) shows the difference between ED and DW for three different sizes, illustrating a large difference between ED and DW for average sized patient, while demonstrating a smaller difference for the pediatric and obese patient. It is also evident that a regionally measured DW will enhance the difference between ED and DW. Similarly, the difference is enhanced if a single image in the middle of a typical thoracic scan is chosen to represent patient's size. However, the performance of the chosen image, in terms of predicting dose, can depend on the scan length and if middle happens to be in the low attenuating region of the lungs. Similarly, there is almost no statistically significant difference observed between regional and global average of both ED and DW in the abdominal regions [Fig. 6(a)].
Figure 4.
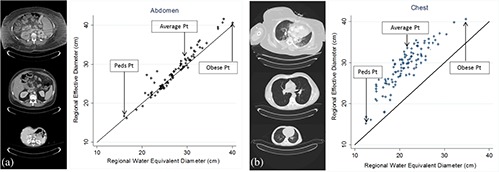
Scatter plot of EDregional versus D W,regional in abdomen (a) and chest (b) along with the identity line illustrating ED overestimating DW in chest, while the difference between ED and DW in abdomen is minor.
Figure 5.
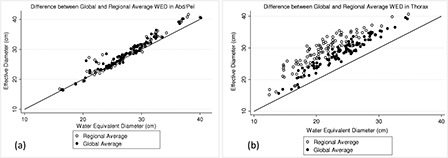
Scatter plot of ED versus DW for two differently averaged values (regional versus global) in abdomen (a) and chest (b) along with the identity. While there is almost no difference between regionally and globally averaged size metric in abdomen, in chest, the value of both ED and DW depends highly on how it was calculated, as a regional average or global.
Figure 6.
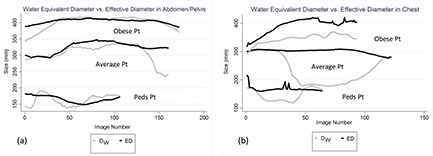
Difference between ED and DW shown for three different patient sizes in abdomen (a) and chest (b).
As shown, the value of DW and D Wa varies significantly along the patient's long axis. Hence, if an averaged value is used as a size descriptor, it needs to reflect the averaged value of the region of interest for which organ doses are estimated. Similarly, if a single image is chosen to calculate DW from, the selection of the image should be based on the organ of interest and not randomly such as the middle image within the series. A more educated selection will result in better organ dose estimation, especially in instances where the exam is not a typical thorax or abdomen/pelvis scan in terms of anatomical start and end location of the scan.
Before normalizing simulated organ doses by CTDIvol,regional, a not before seen trend was observed between organ dose and patient size. As it was previously observed, 3 , 5 in TCM, organ dose increases with patient size; however, for some of the larger patients, a rather decrease in organ dose was observed. This was also noticed for all the other size metrics across all studied organs (liver, spleen, and breasts). Figure 7 demonstrates the relationship between absolute organ dose and one of the size metrics (D W,global) for kidneys (from abd/pel scans) and lungs (from thoracic scans). To investigate this sudden decrease in dose for larger patients, they were identified and their TCM functions were studied.
Figure 7.
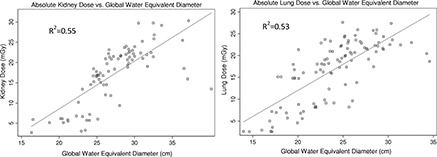
Illustration of kidney (left) and lung dose (right) versus D W,global, both showing an increase in magnitude with increased size, except for few larger patients.
Once the corresponding TCM function of each of these patients was studied, it was established that the studied TCM functions were maxed out due to reaching the generator's instantaneous power limit caused by larger patient size. Figure 8 demonstrates the TCM function of one of these patients. Comparing the illustrated TCM function with a typical abdomen/pelvis TCM function, it is apparent that the z‐axis modulation portion of the TCM is lost due to tube current reaching its maximum value. Once the tube current reaches a maximum, the expected relationship between dose and size in TCM mode no longer holds and patient dose starts decreasing with increasing size; acting as if the scan was performed using fixed tube current.
Figure 8.
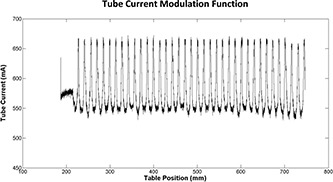
Illustration of a maxed out TCM function resulting in loss of z‐axis modulation and behaving as a fixed tube current examination.
To illustrate the transition from TCM to fixed tube current mode for large patients, for each patient, fixed tube current simulations were performed and results were plotted versus D W,global along with doses from TCM simulations (Fig. 9). As seen in this figure, results from fixed tube current simulations overlap with the TCM simulation results for these specific patients with maxed out tube current (showed in an enclosed ellipse).
Figure 9.
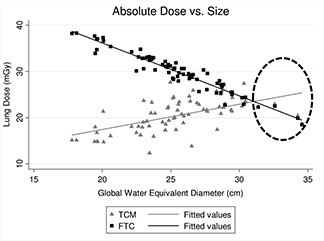
Lung doses resulting from FTC and TCM simulations versus D W,global. At larger patient sizes, the TCM is compromised due to generator's limit and patient dose starts decreasing with increasing size as if the scan was a fixed tube current scan.
There are possible solutions to prevent scans from reaching the limit of scanner's output. In Siemens scanners, when the peak exposure demand exceeds system's limit, the operator is given the option to still load and proceed with the exposure or change parameters such as kVp, rotation time, and pitch to avoid maxing out the tube current. For instance, increasing the rotation time (e.g., from 0.5 to 1 s/rotation) and decreasing the pitch (e.g., from 1.0 to 0.8) can result in lower instantaneous mA for the same effective mAs however, these have other clinical implications such as increasing the time length of the scan and so may not always be practical.
Another finding, unveiled by graphically representing absolute organ doses versus size, was a distinct separation between pediatric and adult patient models. As illustrated by Fig. 10, kidney doses from pediatric and adult patient models result in two distinctive linear fits. This could be due to two different Siemens scanner's reference sizes (child vs adult) utilized during TCM scans. Nevertheless, neither one of these findings seem to have been carried on once organ doses are normalized by CTDIvol,regional, as shown in Fig. 3.
Figure 10.
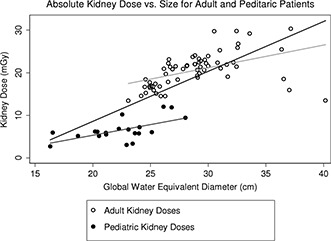
Graphically separated kidney dose for adult and pediatric patient models, demonstrating two distinct set of data with different linear fits.
Although the demonstrated results are promising and the developed models may be used to estimate organ dose from tube current modulated CT examinations, these models have some limitations in terms of their ability to estimate dose to all organs. These mathematical models are based on actual patient scans and images, which were used to generate the patient models. In this work, our focus was on estimating dose to fully irradiated organs; that is, organs fully contained within the image data. Because the patient scans did not contain all radiosensitive organs—that is, they were clinical scans that focused on either the abdominal/pelvic region or the thoracic region—this limited the ability to determine the location of organs that were only partially represented in the scan data or were not present at all (e.g., the thyroid or brain for an abdominal/pelvic scan). Therefore, dose to partially irradiated and nondirectly irradiated organs cannot be evaluated using these models. However, as long as the organs of interest are contained within the scan volume, then the developed estimation models can be used to estimate dose regardless of scan length, assuming the region used to calculate the size metric was appropriately selected.
It should also be noted that, for the same reasons as above, these models do not include any dose contributed from scatter from the rest of the body; for example, from the overscan region where there is radiation but not image data to model the patient's anatomy. For the fully irradiated organs, we assume this contribution to be negligible compared to the doses received from being fully irradiated in the scan. Another limitation of this study is the absent of a test set. The generated models need to be tested on a separate test set to accurately assess their performance.
5. CONCLUSION
Although the value of R 2 increased for most organs, once DW and D Wa were used compared to ED, no statistically significant difference was observed between ED and attenuation‐based size metric in the abdomen. The only statistically significant improvement was observed for normalized lung dose and D W,regional and D W,middle, compared to ED; 70% of the variation of size is explained by DW, while only 42% is explained by ED.
Overall, for abdominal organs, any of the size metrics discussed in this paper (ED, DW, and D Wa) can be used as a predictor of organ dose. However, DW showed improved statistically significant correlation with normalized lung dose compared to D Wa and ED. Hence, as a single size metric robust enough to be used in any anatomical region, i.e., chest, abdomen, and pelvis, DW is recommended; however, D Wa also resulted in improved correlations (higher R 2 values) as compared to ED, just not statistically significant. As compared to DW, for which segmentations are required, calculation of D Wa is much effortless and straightforward.
As seen in Fig. 10, there might be some categorical factors which might impact organ dose; in this case, the model might behave differently if the dose is estimate to a pediatric versus an adult patient. Future studies will incorporate categorical variables to generate a more population‐specific model in or der to improve dose estimates.
None of the studied metrics are capable of representing patient's shape, which may significantly affect the x − y modulation of the TCM function. Specifically, the x − y modulation for a patient with an extreme circular shape would be very different from one with an extreme elliptical shape. Further studies need to focus on how a shape component can be included into the attenuation of the patient to better describe patient size for the purpose of dose estimation.
ACKNOWLEDGMENT
The authors would like to acknowledge grant support from Siemens Healthcare through the Master Research Agreement with UCLA Radiological Sciences.
REFERENCES
- 1. Turner A. C., Zankl M., DeMarco J. J., Cagnon C. H., Zhang D., Angel E., Cody D. D., Stevens D. M., McCollough C. H., and McNitt‐Gray M. F., “The feasibility of a scanner‐independent technique to estimate organ dose from MDCT scans: Using CTDI [sub vol] to account for differences between scanners,” Med. Phys. 37, 1816–1825 (2010). 10.1118/1.3368596 [DOI] [PMC free article] [PubMed] [Google Scholar]
- 2. Boone J. M., Strauss K. J., Cody D. D., McCollough C., McNitt‐Gray M., and Toth T. L., “Size‐specific dose estimates (SSDE) in pediatric and adul body CT examinations,” AAPM Report No. 204 (2011). [Google Scholar]
- 3. Angel E., Yaghmai N., Jude C. M., DeMarco J. J., Cagnon C. H., Goldin J. G., Primak A. N., Stevens D. M., Cody D. D., McCollough C. H., and McNitt‐Gray M. F., “Monte Carlo simulations to assess the effects of tube current modulation on breast dose for multidetector CT,” Phys. Med. Biol. 54, 497–512 (2009). 10.1088/0031-9155/54/3/003 [DOI] [PMC free article] [PubMed] [Google Scholar]
- 4. Khatonabadi M., Zhang D., Mathieu K., Kim H. J., Lu P., Cody D., DeMarco J. J., Cagnon C. H., and McNitt‐Gray M. F., “A comparison of methods to estimate organ doses in CT when utilizing approximations to the tube current modulation function,” Med. Phys. 39, 5212–5228 (2012). 10.1118/1.4736807 [DOI] [PMC free article] [PubMed] [Google Scholar]
- 5. Khatonabadi M., Kim H. J., Lu P., McMillan K. L., Cagnon C. H., DeMarco J. J., and McNitt‐Gray M. F., “The feasibility of a regional CTDI [sub vol] to estimate organ dose from tube current modulated CT exams,” Med. Phys. 40, 051903 (11pp.) (2013). 10.1118/1.4798561 [DOI] [PMC free article] [PubMed] [Google Scholar]
- 6. Wang J., Duan X., Christner J. A., Leng S., Yu L., and McCollough C. H., “Attenuation‐based estimation of patient size for the purpose of size specific dose estimation in CT. Part I. Development and validation of methods using the CT image,” Med. Phys. 39, 6764–6771 (2012). 10.1118/1.4754303 [DOI] [PubMed] [Google Scholar]
- 7. Wang J., Christner J. A., Duan X., Leng S., Yu L., and McCollough C. H., “Attenuation‐based estimation of patient size for the purpose of size specific dose estimation in CT. Part II. Implementation on abdomen and thorax phantoms using cross sectional CT images and scanned projection radiograph images,” Med. Phys. 39, 6772–6778 (2012). 10.1118/1.4757586 [DOI] [PubMed] [Google Scholar]
- 8. Li B., Behrman R. H., and Norbash A. M., “Comparison of topogram‐based body size indices for CT dose consideration and scan protocol optimization,” Med. Phys. 39, 3456–3465 (2012). 10.1118/1.4718569 [DOI] [PubMed] [Google Scholar]
- 9. Huda W., Atherton J. V., Ware D. E., and Cumming W. A., “An approach for the estimation of effective radiation dose at CT in pediatric patients,” Radiology 203, 417–422 (1997). 10.1148/radiology.203.2.9114097 [DOI] [PubMed] [Google Scholar]
- 10. Huda W., Scalzetti E. M., and Roskopf M., “Effective doses to patients undergoing thoracic computed tomography examinations,” Med. Phys. 27, 838–844 (2000). 10.1118/1.598949 [DOI] [PubMed] [Google Scholar]
- 11. Toth T., Ge Z., and Daly M. P., “The influence of patient centering on CT dose and image noise,” Med. Phys. 34, 3093–3101 (2007). 10.1118/1.2748113 [DOI] [PubMed] [Google Scholar]
- 12. Menke J., “Comparison of different body size parameters for individual dose adaptation in body CT of adults,” Radiology 236, 565–571 (2005). 10.1148/radiol.2362041327 [DOI] [PubMed] [Google Scholar]
- 13. DeMarco J. J., Solberg T. D., and Smathers J. B., “A CT‐based Monte Carlo simulation tool for dosimetry planning and analysis,” Med. Phys. 25, 1–11 (1998). 10.1118/1.598167 [DOI] [PubMed] [Google Scholar]
- 14. Angel E., Wellnitz C. V., Goodsitt M. M., Yaghmai N., DeMarco J. J., Cagnon C. H., Sayre J. W., Cody D. D., Stevens D. M., Primak A. N., McCollough C. H., and McNitt‐Gray M. F., “Radiation dose to the fetus for pregnant patients undergoing multidetector CT imaging: Monte Carlo simulations estimating fetal dose for a range of gestational age and patient size,” Radiology 249, 220–227 (2008). 10.1148/radiol.2491071665 [DOI] [PMC free article] [PubMed] [Google Scholar]
- 15. Jarry G., DeMarco J. J., Beifuss U., Cagnon C. H., and McNitt‐Gray M. F., “A Monte Carlo‐based method to estimate radiation dose from spiral CT: From phantom testing to patient‐specific models,” Phys. Med. Biol. 48, 2645–2663 (2003). 10.1088/0031-9155/48/16/306 [DOI] [PubMed] [Google Scholar]
- 16. DeMarco J. J., Cagnon C. H., Cody D. D., Stevens D. M., McCollough C. H., O'Daniel J., and McNitt‐Gray M. F., “A Monte Carlo based method to estimate radiation dose from multidetector CT (MDCT): Cylindrical and anthropomorphic phantoms,” Phys. Med. Biol. 50, 3989–4004 (2005). 10.1088/0031-9155/50/17/005 [DOI] [PubMed] [Google Scholar]
- 17. DeMarco J. J., Cagnon C. H., Cody D. D., Stevens D. M., McCollough C. H., Zankl M., Angel E., and McNitt‐Gray M. F., “Estimating radiation doses from multidetector CT using Monte Carlo simulations: Effects of different size voxelized patient models on magnitudes of organ and effective dose,” Phys. Med. Biol. 52, 2583–2597 (2007). 10.1088/0031-9155/52/9/017 [DOI] [PubMed] [Google Scholar]
- 18. Turner A. C., Zhang D., Kim H. J., DeMarco J. J., Cagnon C. H., Angel E., Cody D. D., Stevens D. M., Primak A. N., McCollough C. H., and McNitt‐Gray M. F., “A method to generate equivalent energy spectra and filtration models based on measurement for multidetector CT Monte Carlo dosimetry simulations,” Med. Phys. 36, 2154–2164 (2009). 10.1118/1.3117683 [DOI] [PMC free article] [PubMed] [Google Scholar]
- 19. Waters E., mcnpx version 2.5.C, Los Alamos National Laboratory Report LA‐UR‐03‐2202 (2003). [Google Scholar]
- 20. Waters E., mcnpx user's manual, version 2.4.0, Los Alamos National Laboratory Report LA‐CP‐02‐408 (2002). [Google Scholar]
- 21. Brown M. S., Pais R., Qing P., Shah S., McNitt‐Gray M. F., Goldin J. G., Petkovska I., Tran L., and Aberle D. R., “An architecture for computer‐aided detection and radiologic measurement of lung nodules in clinical trials,” Cancer Inf. 4, 25–31 (2007). [PMC free article] [PubMed] [Google Scholar]


