

Abstract
Purpose: Hypofractionated prostate radiotherapy may benefit from both volumetric modulated arc therapy (VMAT) due to shortened treatment time and intrafraction real‐time monitoring provided by implanted radiofrequency(RF) transponders. The authors investigate dosimetrically driven action thresholds (whether treatment needs to be interrupted and patient repositioned) in VMAT treatment with electromagnetic (EM) tracking.Methods: VMAT plans for five patients are generated for prescription doses of 32.5 and 42.5 Gy in five fractions. Planning target volume (PTV) encloses the clinical target volume (CTV) with a 3 mm margin at the prostate‐rectal interface and 5 mm elsewhere. The VMAT delivery is modeled using 180 equi‐spaced static beams. Intrafraction prostate motion is simulated in the plan by displacing the beam isocenter at each beam assuming rigid organ motion according to a previously recorded trajectory of the transponder centroid. The cumulative dose delivered in each fraction is summed over all beams. Two sets of 57 prostate motion trajectories were randomly selected to form a learning and a testing dataset. Dosimetric end points including CTV D95%, rectum wall D1cc, bladder wall D1cc, and urethra Dmax, are analyzed against motion characteristics including the maximum amplitude of the anterior–posterior (AP), superior–inferior (SI), and left–right components. Action thresholds are triggered when intrafraction motion causes any violations of dose constraints to target and organs at risk (OAR), so that treatment is interrupted and patient is repositioned.Results: Intrafraction motion has a little effect on CTV D95%, indicating PTV margins are adequate. Tight posterior and inferior action thresholds around 1 mm need to be set in a patient specific manner to spare organs at risk, especially when the prescription dose is 42.5 Gy. Advantages of setting patient specific action thresholds are to reduce false positive alarms by 25% when prescription dose is low, and increase the sensitivity of detecting dose limits violations by 30% when prescription dose is high, compared to a generic 2 mm action box. The sensitivity and specificity calculated from the testing dataset are consistent to the learning set, which indicates that the patient specific approach is reliable and reproducible within the scope of the prostate database.Conclusions: This work introduces a formalism for ensuring a VMAT delivery meets the most clinically important dose requirements by using patient specific and dosimetric‐driven action thresholds to hold the beam and reposition the patient when necessary. Such methods can provide improved sensitivity and specificity compared to conventional methods, which assume directionally symmetric action thresholds.
Keywords: Dose‐volume analysis; Image analysis; Dosimetry/exposure assessment; Therapeutic applications, including brachytherapy
Keywords: biological organs, dosimetry, image motion analysis, medical image processing, radiation therapy, radio tracking
Keywords: volumetric modulated arc therapy, radiation treatment planning, radiofrequency tracking, intrafraction motion management, prostate radiotherapy
Keywords: Kinematics, Dosimetry, Radiation treatment, Testing procedures, Anatomy, Real time information delivery, Electromagnetic therapy, Drug delivery, Radiation therapy, Databases
I. INTRODUCTION
Hypofractionated radiation treatment of prostate cancer has been demonstrated to show therapeutic advantage compared to the conventional dose schedule. 1 Although hypofractionated treatment is convenient and efficient for patients because of its shortened treatment course, its longer delivery time per fraction due to the higher dose presents a challenge to maintain accurate dose delivery during radiation therapy. Several groups 2 , 3 , 4 , 5 , 6 , 7 , 8 , 9 , 10 , 11 , 12 , 13 , 14 have reported the use of implanted radiofrequency (RF) transponders (Calypso®, Seattle, WA) to monitor intrafraction prostate motion. When the changes of the transducer positions exceed a certain predefined action threshold, treatment is interrupted and the patient can be repositioned according to the transducer signal, a cone‐beam CT scan or an orthogonal film pair. However, each intervention lengthens the treatment time. As suggested by Ghilezan et al., 15 the longer the patient stays in the treatment position, the higher the probability that patient moves during treatment. Volumetric modulated arc therapy (VMAT) is an emerging treatment technique that offers excellent plan quality, but greatly reduced treatment delivery time in treating prostate cancers. 16 , 17 , 18 , 19 The combination of these two new technologies provides a promising approach to hypofractionated treatment.
Continuous, real‐time tracking with a high sampling rate is essential in prostate hypofractionated radiation therapy. 20 Given the motion trajectory of the prostate recorded from RF transponders during VMAT delivery, designing an intrafraction motion reaction strategy needs to be investigated to realize the full benefit of these new technologies. Setting an arbitrary action threshold across the entire patient population is attractive because of its simplicity. For example, the action thresholds can be set to be the value same as the margin between clinical target volume (CTV) and planning target volume (PTV). The choice of margin is based largely on the concern to cover the target with certain statistical confidence. What is often omitted is how the action threshold is linked to the dosimetric consequences of the surrounding organs at risks (OAR). A more desirable and practical strategy is to derive the action thresholds driven by dosimetric end points of both target coverage and OAR sparing. Another consideration is that the margin is designed on a patient population basis. 21 It therefore lacks relation to and perspective from the spatial and temporal patterns of each patient's treatment plan. Action thresholds tailored to each patient are better suited to minimize the number of false positive alarms or false negative negligence, especially in the era of patient specific medicine. In this paper, we propose a paradigm to retrospectively investigate dosimetrically driven action thresholds in VMAT treatment that integrates the motion trajectories provided with electromagnetic tracking systems.
II. METHOD AND MATERIALS
II.A. Electromagnetically tracked motion trajectories
The design of the intrafraction motion management utilizes the motion trajectory database collected by the electromagnetic (EM) tracking system during prostate radiation treatment. Each trajectory consists of positions of the centroid of the three implanted RF transponders over 6 min. Fifty seven prostate motion trajectories were randomly selected from 444 files of 12 patients to form a learning dataset that is used to determine the action thresholds. Another 57 motion trajectories excluding the learning dataset form a testing dataset to evaluate the method. Figure 1 plots the frequency histograms of the maximum deviations of the anterior–posterior (AP), superior–inferior (SI), and lateral (LAT) components of the motion trajectories from the learning (top) and testing (bottom) dataset, respectively. The maximum deviation from the planned position of the centroid within an individual trajectory ranges from −15.4 to 10.2 mm SI, −5.3 to 6.9 mm AP, and −2.3 to 2.9 mm LAT for the learning dataset, and −14.6 to 10.2 mm SI, −7.4 to 7.6 mm AP, and −5.3 to 7.1 mm LAT for the testing dataset, respectively.
Figure 1.
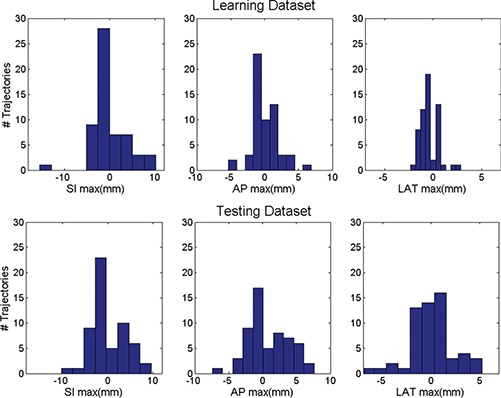
Frequency histograms of the maximum deviations of the AP, SI, and LAT components of the prostate intrafraction motion trajectories from the learning (top) and testing (bottom) dataset.
II.B. Retrospective motion‐inclusive dose calculation
To investigate the effect of intrafraction motion on the treatment plan, we retrospectively associate a motion trajectory to a VMAT delivery, and calculate delivered dose in a cumulative fashion similar to the method proposed by Ma et al. 22 to the region of interest (ROI) that contains CTV and OARs. VMAT delivery of a full 360 ° arc is typically modeled using a number (N b = 180) of equispaced static beams (also known as control points) as illustrated in Fig. 2(a). Each control point corresponds to a subarc length of 360°/Nb. In VMAT delivery, if dose cannot be delivered with the maximum dose rate within the specified subarc, gantry rotation speed is reduced to compensate. Therefore time spent at each subarc (Δt i), which can be linked to the corresponding time point in the motion trajectory, is determined by
| (1) |
where v 0 is the default speed of linac gantry rotation (60–65 s per 360°), MU i is monitor units delivered at the ith subarc, and DR 0 is the maximum designated dose rate (10 MU/s).
Figure 2.
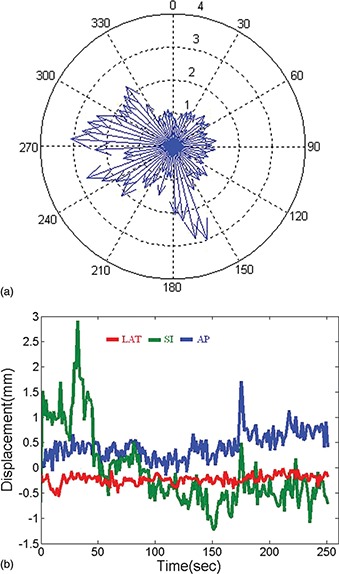
(a) Model VMAT delivery using 180 static beams. The length of the arrow indicates the weight (relative beam‐on time) of the beam. (b) An example motion trajectory recorded by the electromagnetic tracking system.
The prostate position during each subarc can then be determined by linking the time of each subarc to the intrafraction prostate motion trajectory recorded by the EM tracking system. The EM tracking system samples the position of the prostate markers with a frequency of ten frames per second [a typical trajectory is shown in Fig. 2(b)]. The current analysis assumes rigid organ motion, in which the motion effect is simulated in the plan by displacing the beam isocenter at each subarc according to a previously recorded trajectory of the transponder centroid. Dose is recalculated at each control point with the new isocenter setting. Therefore, for a point inside the ROI the motion inclusive accumulative delivered dose (D) is the summation of dose contributed by each control point
| (2) |
where p 0 is its static position used at treatment planning, Δp i is the displacement simulated at delivery, and MLCi is the aperture setup at the ith control point.
II.C. Treatment planning study
VMAT plans are generated following the Memorial Sloan–Kettering Cancer Center (MSKCC) hypofractionated prostate dose escalation protocol. In this protocol prescription dose varies from 32.5 to 42.5 Gy and delivered in five fractions. The PTV encloses the CTV with a 3 mm margin at the prostate‐rectal interface and 5 mm elsewhere. No margins were placed around OAR for planning or evaluation purposes. Further reduction of the margin is not included in the protocol because the 3 mm margin at the prostate‐rectal interface already approaches the range of other uncertainties such as contouring and microscopic disease. Plan optimization is performed using the MSKCC VMAT planning system. 17 , 23 Accumulative dose calculation accounting for motion trajectory is performed using a separate module integrated in our in‐house planning system. Table I lists the clinical limits for the dosimetric end points including CTV D95%, rectal wall and bladder wall maximum dose (Dmax), dose received by 1cc of the rectal wall and bladder wall (D1cc), and urethra Dmax.
Table I.
Clinical dose limits for hypofractionated prostate dose escalation protocol at Memorial Sloan–Kettering cancer center.
| Prescribed dose | 32.5 Gy | Prescribed dose | 42.5 Gy |
|---|---|---|---|
| PTV D95% | >29.3Gy | PTV D95% | >38.3Gy |
| Urethra Dmax | <34.1Gy | Urethra Dmax | <42.5Gy |
| Rectal wall Dmax | <33.5Gy | Rectal wall D1cc | <38.5Gy |
| Bladder Dmax | <34.1Gy | Bladder D1cc | <42.0Gy |
II.D. Derivation of plan specific action threshold
Motion inclusive dose is calculated for each of the five patients using the learning dataset comprised of 57 motion trajectories. Values of the dose end points are reassessed and plotted in a histogram to illustrate the blur effect caused by motion. Violations to any one of the dose constraints for target coverage and OAR sparing at each specific dose level are flagged. A scatter plot serves to visualize the relationship between dose limits violation vs motion trajectory characteristics such as the maximum amplitude of the AP, SI, and LAT components. Action thresholds along the three motion components are determined using the largest possible box that contains no dose limit violations. The resulting action thresholds reflect the requirements of the multicriteria scenario as listed in Table I. This management strategy is deliberately conservative with the consideration that we are at the early stage of implementing hypofractionated prostate treatment. It requires no violation in any fraction, and ignores any mitigating effect of summation across all fractions. The action threshold boxes are determined for all five patient cases in this study and are determined separately for prescribed doses of 32.5 and 42.5 Gy.
II.E. Effectiveness evaluation
Our detection strategy aims to identify as many violations of dose limits due to intrafraction motion as possible. In other words, the highest sensitivity (true positive fraction, TPF) is required. As a consequence any transient target motions outside of the action threshold box would trigger a beam hold off, even if no dose limits are violated for this short move. Specificity (true negative fraction, TNF) may be sacrificed as a compromise to ensure the highest sensitivity. The clinical consequences associated with low specificity are interruptions to treatment although no dose limit is violated, resulting in increased treatment time. We calculate specificity for each patient to evaluate the effectiveness of setting a patient specific action threshold box. We also calculate sensitivity and specificity for a generic action threshold box (2 mm in each direction and the same for all plans) as a control set for comparison.
Even if our algorithm could accurately identify the action thresholds specific to the learning dataset, questions remain to be answered about whether the determined action thresholds could be generalized to other trajectories. To address this concern, we tested the effectiveness of the proposed method using the testing dataset consisting of 57 trajectories from the patient database excluding the learning dataset. The sensitivity and specificity of our method are calculated using the action threshold box derived from the learning dataset, and the dosimetric end points incorporating the testing trajectories.
III. RESULTS
Typical frequency histograms (learning dataset, 57 incidences) of the dosimetric endpoints in the presence of motion from one patient are plotted in Fig. 3. For this example, prescription dose level is 42.5 Gy. One can see that intrafraction motion has little effect on CTV D95% (mean difference from planned value 0, maximum −1.3%), indicating PTV margins are adequate. Bladder wall D1cc and urethra Dmax in the static plan without motion are very close to the dose limits, therefore are also more likely to violate the dose limits in the presence of intrafraction motion. As a result, the dosimetric results for these two structures dominate the determination of the action thresholds. In the three‐Dimensional scatter plot of dose limit violation vs deviations in transponder centroid (Fig. 4), the patient specific action threshold box (blue) is determined where no dose violations (red points) occur within. The generic 2 mm action threshold box is plotted in magenta for comparison. Table II lists the boundaries of the action threshold boxes for all patients. As one may expect, action threshold boxes are tighter at dose level of 42.5 Gy than those of 32.5 Gy because dose limits are more stringent. In experiments exploring dose constraints other than those included in Table I, such as bladder wall and rectum wall D2cc and D5cc, action thresholds show little changes from what are listed in Table II. In prostate treatment planning, dose constraints at larger volume are generally easier to meet than those at smaller volume (such as listed in Table I). This may explain why dose constraints listed in Table I dominate the selection of the action thresholds.
Figure 3.
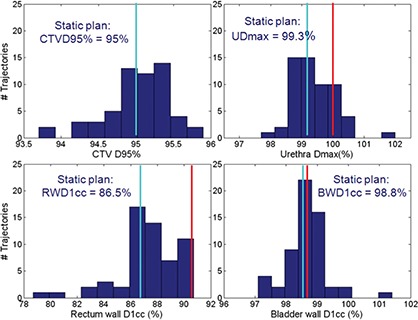
Frequency histograms (57 incidences) of dosimetric endpoints in the presence of motion for a patient. For this example, the prescription dose level is 42.5 Gy. The blue lines indicate the dose end point values of the static plan, while the reds indicate the clinical limits.
Figure 4.
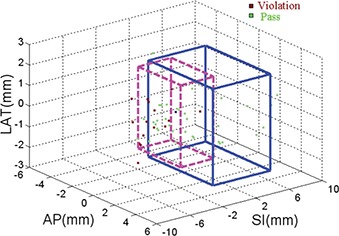
Patient specific action threshold box (in solid line) is set such that no dosimetric limits are violated in the SI, AP, and LAT directions. A generic 2 mm action threshold box (in dash line) is also plotted for comparison
Table II.
Patient specific action thresholds.
| 32.5 Gy | 42.5 Gy | |||||
|---|---|---|---|---|---|---|
| Patient | SI Maximum (mm) | AP Maximum (mm) | LR Maximum (mm) | SI Maximum (mm) | AP Maximum (mm) | LR Maximum (mm) |
| 1 | [−3.5 1.5] | [−1 4] | [−2.5 2] | [−1 3.8] | [−1.1 1.5] | [−2.2 2.5] |
| 2 | [−2.6 3.7] | [−5 5] | [−1.7 2.8] | [−1 3.8] | [−1.1 3.8] | [−2.2 2.5] |
| 3 | [−5 4.8] | [−4.6 5] | [−1.2 2.8] | [−1.9 3.8] | [−1.1 3.8] | [−2.2 2.5] |
| 4 | [−2.5 5] | [−5 5] | [−1.7 2.8] | [−2.6 3.8] | [0 3.8] | [−2.2 2.5] |
| 5 | [−2.4 5] | [−5 5] | [−2.3 2.8] | [−1.5 3.8] | [−0.5 3.8] | [−2.3 2.8] |
When prescription dose is 32.5 Gy, all dose limits violations can be detected by either patient specific or generic action threshold boxes. Sensitivity of both methods was 1.0 for the learning dataset at this dose level. However, in the learning dataset the average specificity of the patient specific boxes is 0.74, much higher than that of a fixed box, which is 0.49. Application of patient specific action thresholds results in elimination of 25% of false positive treatment interruptions. When prescription dose escalates to 42.5 Gy, the sensitivity of the patient specific box remains one for the learning dataset, whereas the average sensitivity of the generic box is only 0.7, although the size of the generic box is smaller. Setting a patient specific action threshold box increases the detection rate of dose limit violation by 30%. Meanwhile, specificity of the patient specific and generic box decreases to 0.41 and 0.49, respectively, due to the difficulty in meeting all dose requirements in the treatment plan. Figure 5 shows the range of the sensitivity and specificity data.
Figure 5.
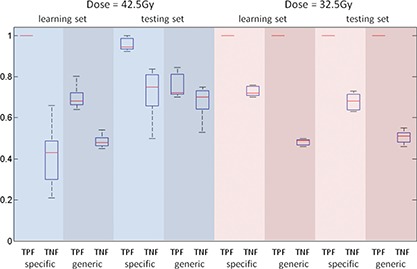
Comparison of sensitivity (true positive fraction of dose limit violations, TPF) and specificity (true negative fraction of treatment interruptions, TNF) for patient specific and generic motion management strategies. The range, standard deviation, and mean are indicated by the bar, the box, and the horizontal line, respectively.
When applying the patient specific action thresholds to the independent testing dataset, the average sensitivity of the method is 0.96 and 1, for the 42.5 and 32.5 Gy dose level, respectively. The standard of a high screening sensitivity is maintained. Meanwhile, the sensitivity of using generic 2 mm action thresholds is 0.76 and 1, for the 42.5 and 32.5 Gy dose level, respectively. Using patient specific action thresholds still maintains its advantage in high sensitivity compared to the generic 2 mm settings at the high dose level. The patient specific and generic approach has comparable specificity at the 42.5 Gy dose level, 0.71 vs 0.67, but the former maintains a 17% (0.69 vs 0.52) advantage at the 32.5 Gy dose level. The results from the testing dataset are consistent to the learning set, which indicates that the learning dataset does have enough data points in the critical region that eventually determines the action thresholds despite the distribution of the motion parameters and the resulted dose histograms are far from a smooth statistical distribution. The patient specific approach is reliable and reproducible within the scope of the prostate database.
Superior specificity of the patient specific approach could translate to a time saving in delivery. In our simulations that estimate the time savings using the test dataset at dose level of 32.5 Gy, the correction strategy is adopted to reposition the couch to the origin whenever the motion exceeds the action thresholds. Patient specific approach in average resulted in 39 total false positive corrections in 13 mispredicted traces with a range of 1–6 per trace, compared to 106 in 21 traces with a range of 1–12 per trace in the scenario of using a generic 2 mm setting. If one correction costs 75 s from inside the room, 6 the average saving spread to the entire 57 traces is 1.5 min. In the best scenario, the time saving could be 7.5 min for the most interrupted trace.
V. DISCUSSION
We propose a motion management strategy that calculates patient‐specific, dosimetric‐driven action thresholds. Naturally asymmetric action thresholds are derived according to the spatial dose distribution patterns of the patient's treatment plan. The action threshold along the posterior direction is particularly small, around 1 mm over the five patient cases for a prescription dose of 42.5 Gy, compared to the other directions. If a 1 mm accuracy requirement is beyond that achievable for the dose delivery and motion monitoring systems, it would argue for designing a treatment plan that is able to accommodate larger motion deviations in the posterior direction. In the scenario where motion sensitivity studies such as the one discussed here are performed during the planning process, the motion analysis could provide valuable feedback to the planning process and would facilitate a redistribution of OAR toxicities to maximize delivery efficiency and effectiveness. Combining the two aspects of planning and delivery as a feedback loop could provide more flexibility in delivering the correct dose to target while sparing the surrounding OARs, rather than addressing the problems separately.
The primary focus of our investigation is the management of intrafraction motion. Systematic patient setup error or drastic surrounding organ deformation (e.g., bladder or rectum filling) can also deteriorate the accuracy of dose delivery. Before the delivery of each fraction, an orthogonal film pair or a volumetric cone‐beam CT can be taken to verify that the patient is correctly setup using the EM tracking signal, and no significant organ deformations are observed. The residual setup error after passing the two checks is small and has little effect on the final action threshold box, given that the residual error is coupled with the motion error in a quadratic rather than an additive manner. If bladder or rectum filling significantly differs from what is observed in the simulation, remedies such as online replanning 24 , 25 should be taken before the treatment can take place.
One potential criticism of the current methodology is that a simple rigid organ motion has been incorporated into dose calculation. For the high dose scenario where dose limits violations are often present, we used D1cc instead of the maximum point dose. Because D1cc is less sensitive to motion than a point dose, our estimate may still be a valid indicator. Nevertheless paradigms that build dose assessment based on deformable registration 26 would be useful and applicable in future investigations. Volumetric arc therapy provides the opportunity to acquire one or multiple cone‐beam CTs during treatment. 27 The 3D volumetric image sets serve as the true record of the delivery and could provide motion information of the OARs during treatment, which are absent from the Calypso system . The countours of the target as well as the OARs such as bladder and rectum can be projected to the record image sets via deformable registration. The dose delivered to the patient can be estimated and used as a more accurate input in the determination of the action thresholds.
Currently, Varian Medical Systems (Palo Alto, CA) and Calypso Medical Technologies (Seattle, WA) are collaborating to provide an option called “gate and shift” for Varian's linacs. Using this methodology, any intrafraction motion that exceeded predefined thresholds would trigger a beam hold off at the linac until the patient could be automatically repositioned according to the EM tracking signal, at which time, delivery would be restored. The patient specific box derived from our method can be easily adopted for the use of this function. Prostate rotation on an average of a few degrees is observed in Li's calypso study. 28 The ExacTrac 6D robotic couch provided by BrainLab (Feldkirchen, Germany) potentially can correct the rotational deviation with the three vendors' co‐operation. By collecting more clinical data and advancing our knowledge in building a prostate rotation model, we will incorporate rotation in our accumulative dose calculation model and improve the current strategy. Furthermore, applying a more intelligent classification method such as using an action threshold polygon or ellipsoid can certainly improve the specificity of the motion management strategy. Adaptive strategies that track the motion signal, calculate any trend in position, predict the near‐term motion trajectory, and make a decision whether to correct the shift, will be more powerful. 29 , 30 , 31 Future investigations are needed to incorporate dosimetric‐driven criteria into the design of advanced management strategies and evaluating its clinical efficacy.
VI. CONCLUSION
This work introduces a method that ensures a VMAT delivery meeting the most clinically important dose end points by using patient specific and dosimetric‐driven action thresholds to hold the beam and reposition the patient when necessary. Such methods can provide improved sensitivity and specificity compared to conventional methods, which assume directionallysymmetric action thresholds.
ACKNOWLEDGMENTS
We would like to thank Michelle Svatos from Varian Medical Systems, Palo Alto, CA for her help and discussion. Part of this paper is presented at the ASTRO 2010 annual meeting. The authors have no conflict of interest.
REFERENCES
- 1. Yeoh E. E., Botten R. J., Butters J., Di Matteo A. C., Holloway R. H., and Fowler J., “Hypofractionated versus conventionally fractionated radiotherapy for prostate carcinoma: Final results of phase III randomized trial,” Int. J. Radiat. Oncol. Biol. Phys. (in press). [DOI] [PubMed] [Google Scholar]
- 2. Balter J. M. et al., “Accuracy of a wireless localization system for radiotherapy,” Int. J. Radiat. Oncol. Biol. Phys. 61, 933–937 (2005). 10.1016/j.ijrobp.2004.11.009 [DOI] [PubMed] [Google Scholar]
- 3. Willoughby T. R. et al., “Target localization and real‐time tracking using the Calypso 4D localization system in patients with localized prostate cancer,” Int. J. Radiat. Oncol. Biol. Phys. 65, 528–534 (2006). 10.1016/j.ijrobp.2006.01.050 [DOI] [PubMed] [Google Scholar]
- 4. Kupelian P. et al., “Multi‐institutional clinical experience with the Calypso System in localization and continuous, real‐time monitoring of the prostate gland during external radiotherapy,” Int. J. Radiat. Oncol. Biol. Phys. 67, 1088–1098 (2007). 10.1016/j.ijrobp.2006.10.026 [DOI] [PubMed] [Google Scholar]
- 5. Santanam L., Malinowski K., Hubenshmidt J., Dimmer S., Mayse M. L., Bradley J., Chaudhari A., Lechleiter K., Goddu S. K., Esthappan J., Mutic S., Low D. A ., and Parikh P., “Fiducial‐based translational localization accuracy of electromagnetic tracking system and on‐board kilovoltage imaging system,” Int. J. Radiat. Oncol. Biol. Phys. 70(3), 892–899 (2008). 10.1016/j.ijrobp.2007.10.005 [DOI] [PubMed] [Google Scholar]
- 6. Malinowski K., Noel C., Roy M., Willoughby T., Djemi T., Jani S., Solberg T., Liu D., Levine L., and Parikh P. J., “Efficient use of continuous, real‐time prostate localization,” Phys. Med. Biol. 53(18), 4959–4970 (2008). 10.1088/0031-9155/53/18/007 [DOI] [PubMed] [Google Scholar]
- 7. Li H. S., Chetty I. J., and Solberg T. D., “Quantifying the interplay effect in prostate IMRT delivery using a convolution‐based method,” Med. Phys. 35(5), 1703–1710 (2008). 10.1118/1.2897972 [DOI] [PMC free article] [PubMed] [Google Scholar]
- 8. Li H. S., Chetty I. J., Enke C. A., Foster R. D., Willoughby T. R., Kupellian P. A., and Solberg T. D., “Dosimetric consequences of intrafraction prostate motion,” Int. J. Radiat. Oncol. Biol. Phys. 71(3), 801–812 (2008). 10.1016/j.ijrobp.2007.09.059 [DOI] [PubMed] [Google Scholar]
- 9. Santanam L., Noel C., Willoughby T. R., Esthappan J., Mutic S., Klein E. E., Low D. A., and Parikh P. J., “Quality assurance for clinical implementation of an electromagnetic tracking system,” Med. Phys. 36(8), 34773486 (2009). 10.1118/1.3158812 [DOI] [PubMed] [Google Scholar]
- 10. Liu W., Wiersma R. D., and Xing L., ” Optimized hybrid megavoltage‐kilovoltage imaging protocol for volumetric prostate arc therapy,” Int. J. Radiat. Oncol. Biol. Phys. 78(2), 595–604 (2010). 10.1016/j.ijrobp.2009.11.056 [DOI] [PMC free article] [PubMed] [Google Scholar]
- 11. Rajendran R. R., Plastaras J. P., Mick R., McMichael Kohler D., Kassaee A., and Vapiwala N., “Daily isocenter correction with electromagnetic‐based localization improves target coverage and rectal sparing during prostate radiotherapy,” Int. J. Radiat. Oncol. Biol. Phys. 76(4), 1092–1099 (2010). 10.1016/j.ijrobp.2009.03.036 [DOI] [PubMed] [Google Scholar]
- 12. Tanyi J. A., He T., Summers P. A., Mburu R. G., Kato C. M., Rhodes S. M., Hung A. Y., and Fuss M., “Assessment of planning target volume margins for intensity‐modulated radiotherapy of the prostate gland: Role of daily inter‐ and intrafraction motion,” Int. J. Radiat. Oncol. Biol. Phys. 78(5), 1579–1585 (2010). [DOI] [PubMed] [Google Scholar]
- 13. Peng C., Ahunbay E., Chen G., Anderson S., Lawton C., and Li X. A., “Characterizing interfraction variations and their dosimetric effects in prostate cancer radiotherapy,” Int. J. Radiat. Oncol. Biol. Phys. 79(3), 909–914 (2011). 10.1016/j.ijrobp.2010.05.008 [DOI] [PubMed] [Google Scholar]
- 14. Su Z., Zhang L., Murphy M., and Williamson J., “Analysis of Prostate Patient Setup and Tracking data: Potential intervention strategies,” Int. J. Radiat. Oncol. Biol. Phys. (in press). [DOI] [PMC free article] [PubMed] [Google Scholar]
- 15. Ghilezan M. J., Jaffray D. A., Siewerdsen J. H., Van Herk M., Shetty A., Sharpe M. B., Zafar Jafri S., Vicini F. A., Matter R. C., Brabbins D. S., and Martinez A. A., “Prostate gland motion assessed with cine‐magnetic resonance imaging (cine‐MRI),” Int. J. Radiat. Oncol. Biol. Phys. 62(2), 406–417 (2005). 10.1016/j.ijrobp.2003.10.017 [DOI] [PubMed] [Google Scholar]
- 16. Palma D., Vollans E., James K., Nakano S., Moiseenko V., Shaffer R., McKenzie M., Morris J., and Otto K., “Volumetric modulated arc therapy for delivery of prostate radiotherapy: Comparison with intensity‐modulated radiotherapy and three‐dimensional conformal radiotherapy,” Int. J. Radiat. Oncol. Biol. Phys. 72, 996–1001 (2008). 10.1016/j.ijrobp.2008.02.047 [DOI] [PubMed] [Google Scholar]
- 17. Zhang P., Happersett L., and Mageras G., “Volumatric modulated arc therapy: implementation and evaluation for prostate cancer cases,” Int. J. Radiat. Oncol. Biol. Phys. 76(5), 1456–1462 (2010). 10.1016/j.ijrobp.2009.03.033 [DOI] [PubMed] [Google Scholar]
- 18. Rao M., Yang W., Chen F., Sheng K., Ye J., V.Mehta, Shepard D., and Cao D., “Comparison of Elekta VMAT with helical tomotherapy and fixed field IMRT: Plan quality, delivery efficiency and accuracy,” Med. Phys. 37(3), 1350–1359 (2010). 10.1118/1.3326965 [DOI] [PubMed] [Google Scholar]
- 19. Wolff D., Stieler F., Welzel G., Lorenz F., Abo Y.‐Madyan, Mai S., Herskind C., Polednik M., Steil V., Wenz F., and Lohr F., “Volumetric modulated arc therapy, (VMAT) vs. serial tomotherapy, step‐and‐shoot IMRT and 3D‐conformal RT for treatment of prostate cancer,” Radiother Oncol. 93(2), 226–233 (2009). 10.1016/j.radonc.2009.08.011 [DOI] [PubMed] [Google Scholar]
- 20. Noel C., Parikh P. J., Roy M., Kupelian P., Mahadevan A. Weinstein G., Enke C., Flores N., Beyer D., and Levine L., “Prediction of intrafraction prostate motion: accuracy of pre‐ and post‐treatment imaging and intermittent imaging,” Int. J. Radiat. Oncol. Biol. Phys. 73(3), 692–698 (2009). 10.1016/j.ijrobp.2008.04.076 [DOI] [PubMed] [Google Scholar]
- 21. van Herk M. et al., “The probability of correct target dosage: Dose‐population histograms for deriving treatment margins in radiotherapy,” Int. J. Radiat. Oncol. Biol. Phys. 47, 1121–1135 (2000). 10.1016/S0360-3016(00)00518-6 [DOI] [PubMed] [Google Scholar]
- 22. Ma Y., Chang D., Keall P., Xie Y., Park J., Suh T., and Xing L., “Inverse planning for 4D modulated arc therapy,” Med. Phys. 37, 5627–5633 (2010). 10.1118/1.3497271 [DOI] [PMC free article] [PubMed] [Google Scholar]
- 23. Zhang P., Happersett L., Yang Y., Yamada J., Mageras G., and Hunt M., “Optimization of collimator trajectory in volumetric modulated arc therapy: development and evaluation for paraspinal SBRT,” Int. J. Radiat. Oncol. Biol. Phys. 77(2), 591–599 (2010). 10.1016/j.ijrobp.2009.08.056 [DOI] [PubMed] [Google Scholar]
- 24. Li T., Thongphiew D., Zhu X., Lee W. R., Vujaskovic Z., Yin F. F., and Wu Q. J., “Adaptive prostate IGRT combining online re‐optimization and re‐positioning: a feasibility study,” Phys. Med. Biol. 56(5), 1243–1258 (2011). 10.1088/0031-9155/56/5/002 [DOI] [PubMed] [Google Scholar]
- 25. Men C., Jia X., and Jiang S. B., “GPU‐based ultra‐fast direct aperture optimization for online adaptive radiation therapy,” Phys. Med. Biol. 55(15), 4309–4319 (2010). 10.1088/0031-9155/55/15/008 [DOI] [PubMed] [Google Scholar]
- 26. Gao S., Zhang L., Wang H., de Crevoisier R., Kuban D. D., Mohan R., and Dong L., “A deformable image registration method to handle distended rectums in prostate cancer radiotherapy,” Med. Phys. 33(9), 3304–3312 (2006). 10.1118/1.2222077 [DOI] [PubMed] [Google Scholar]
- 27. Nakagawa K., Haga A., Shiraishi K., Yamashita H., Igaki H., Terahara A., Ohtomo K., Saegusa S., Shiraki T., Oritate T., and Yoda K., “First clinical cone‐beam CT imaging during volumetric modulated arc therapy,” Radiother. Oncol. 90(3), 422–423 (2009). 10.1016/j.radonc.2008.11.009 [DOI] [PubMed] [Google Scholar]
- 28. Li J. S., Jin L., Pollack A., Horwitz E. M., Buyyounouski M. K., Price R. A., Jr., and Ma C. M., “Gains from real‐time tracking of prostate motion during external beam radiation therapy,” Int. J. Radiat. Oncol. Biol. Phys. 75(5), 1613–1620 (2009). 10.1016/j.ijrobp.2009.05.022 [DOI] [PubMed] [Google Scholar]
- 29. McNamara J., Lovelock D., Yorke E., and Mageras G., “Proof of principle investigation of computer controlled couch adjustments for correcting drift in target position during radiotherapy,” Med. Phys. 37, 3184 (2010). 10.1118/1.3468389 [DOI] [PMC free article] [PubMed] [Google Scholar]
- 30. Lauve A. D., Siebers J. V., Crimaldi A. J., Hagan M. P., and Kealla P. J., “A dynamic compensation strategy to correct patient‐positioning errors in conformal prostate radiotherapy,” Med. Phys. 33, 1879–1887 (2006). 10.1118/1.2198967 [DOI] [PubMed] [Google Scholar]
- 31. Liu W., Qian J., Hancock S. L., Xing L., and Luxton G., “Clinical development of a failure detection‐based online repositioning strategy for prostate IMRT–experiments, simulation, and dosimetry study,” Med. Phys. 37, 528–75297 (2010). [DOI] [PMC free article] [PubMed] [Google Scholar]