

Cyanobacteria, the most ancient and abundant photoautotrophs on Earth, produce the greenhouse gas methane during photosynthesis.
Abstract
Evidence is accumulating to challenge the paradigm that biogenic methanogenesis, considered a strictly anaerobic process, is exclusive to archaea. We demonstrate that cyanobacteria living in marine, freshwater, and terrestrial environments produce methane at substantial rates under light, dark, oxic, and anoxic conditions, linking methane production with light-driven primary productivity in a globally relevant and ancient group of photoautotrophs. Methane production, attributed to cyanobacteria using stable isotope labeling techniques, was enhanced during oxygenic photosynthesis. We suggest that the formation of methane by cyanobacteria contributes to methane accumulation in oxygen-saturated marine and limnic surface waters. In these environments, frequent cyanobacterial blooms are predicted to further increase because of global warming potentially having a direct positive feedback on climate change. We conclude that this newly identified source contributes to the current natural methane budget and most likely has been producing methane since cyanobacteria first evolved on Earth.
INTRODUCTION
Methane (CH4) is the second most important anthropogenic greenhouse gas after CO2 and is estimated to have 28 to 34 times higher warming effect than the latter over a 100-year period (1). The mixing ratio of CH4 in the troposphere has increased from 715 parts per billion volume (ppbv) in the preindustrial era to currently 1865 parts ppbv (February 2019 National Oceanic and Atmospheric Administration). Estimated global CH4 emissions to the atmosphere average at ca. 560 Tg year−1 (1 Tg = 1012 g), exceeding the current estimated sinks by ca. 13 Tg year−1 (2). Thus, to mitigate the constant increase in atmospheric CH4, a comprehensive understanding of global CH4 sources and the environmental parameters that affect them is necessary.
Traditionally, biogenic methanogenesis is the formation of CH4 under strictly anoxic conditions by microbes from the domain archaea (phylogenetically distinct from both eukaryotes and bacteria). However, in the past decade, there has been growing evidence that also eukaryotes, such as algae (3), plants (4), animals (5), fungi (6), and probably humans (7), produce CH4 under oxic conditions, albeit at considerably lower rates. These recent findings suggest that the phenomenon may not be solely limited to methanogenic archaea and could include alternative, yet to be identified metabolic pathways. For example, the conversion of methylated substrates, such as methylphosphonates to CH4 by bacteria, has been extensively addressed in recent years with regard to the “methane paradox” (8, 9). Recently, Zheng et al. (10) have shown CH4 formation by Rhodopseudomonas palustris during N2 fixation. Methane emission was also detected from cryptogamic covers, i.e., phototrophic assemblages on plant, rock, and soil surfaces (11).
Accumulation of CH4 in oxygenated freshwater environments has been repeatedly associated with the presence of cyanobacteria (see also fig. S1). Methane production by cyanobacteria has been attributed to either demethylation of methylphosphonates (12–14) or association of filamentous cyanobacteria with methanogenic archaea, providing the latter with the necessary hydrogen for the CH4 production (15). Cyanobacteria are ubiquitous, found literally in any illuminated environment and, unexpectedly, in some dark subsurface ones (16, 17). Furthermore, this phylum predominated Earth while the environment was still reductive, ca. 1.3 billion years before the great oxygenation event, which occurred 2.4 billion years ago (18). Therefore, we tested whether this phylum contributes to the global CH4 budget independent of naturally occurring, extracellular precursor substances or the presence of methanogenic archaea. If so, their ubiquitous nature, expected future increase in abundance (19, 20), and proximity to the interface with the atmosphere make them potential key players in the global CH4 cycle.
Here, we demonstrate that unicellular and filamentous, freshwater, marine, and terrestrial members of the prominent and ubiquitous phylum Cyanobacteria, a member of the domain bacteria, produce CH4 at substantial rates under light and dark and oxic and anoxic conditions.
RESULTS AND DISCUSSION
To test the hypothesis that cyanobacteria produce CH4 independent of known methylated precursors (e.g., methylphosphonates) in ambient water, 13 different filamentous and unicellular cyanobacterial cultures (for details of chosen cultures, see Table 1) that are known to grow in marine, freshwater, and terrestrial environments were incubated under sterile conditions with 13C-labeled sodium hydrogen carbonate (NaH13CO3) as carbon source. All investigated cyanobacterial cultures showed the CH4 production with increasing stable isotope values (δ13C-CH4 values), indicating that 13C carbon was incorporated into CH4, whereas no 13C enrichment occurred in the control experiments (Fig. 1). These results unambiguously show that cyanobacteria produce CH4 per se and that the process is most likely linked to general cell metabolism. The different enrichment of 13C indicated by δ13C-CH4 values ranging from 1.71 to 1337‰ observed in the different cultures is a result of different production rates and differences in biomass. The involvement of methanogenic archaea in this process can be ruled out. First, five of the cultures were axenic. Second, the oxygen concentrations during the CH4 production were, in most cases, above saturation level (Fig. 2 and fig. S2); while methanogenic archaea were recently reported from oxic environments (21), their activity is attributed to anoxic microniches. Peters and Conrad (22) have additionally shown that while methanogens are abundant in oxic environments, methanogenesis remains inactive. Furthermore, transcriptomic data from two experiments we conducted over the course of 24 hours with nonaxenic cultures of Anabaena sp. PCC 7120 and Microcystis sp. PCC 7806 have revealed no expression of genes known to be related to classical methanogenic activity. Third, sequencing analysis of nonaxenic cultures and quantitative real-time polymerase chain reaction (PCR) of the methyl coenzyme M reductase gene (mcrA) showed that methanogenic archaea are either absent or present in negligible numbers (fig. S3).
Table 1. Cyanobacterial cultures used in this study and their growth conditions.
Cultures marked with an asterisk are fully axenic, while others are monoalgal. IBVF: Culture collection of the Institute for Plant Biochemistry and Photosynthesis, Sevilla Spain; CCALA: Culture collection of autotrophic organisms; HUJI: Laboratory of A. Kaplan, Hebrew University of Jerusalem, Jerusalem Israel; IOW: Laboratory of F. Pollehne, Leibniz Institute for Baltic Sea research, Warnemünde, Germany; MPI-MM: Max Planck Institute for Marine Microbiology, Bremen, Germany; IGB: Leibniz Institute of Freshwater Ecology and Inland Fisheries, Neuglobsow, Germany; University of Freiburg, Laboratory of Claudia Steglich, Freiburg University, Freiburg, Germany; Haifa University, Laboratory of D. Sher. Media source: BG11: (50); f/2: (51); YBCII: (65); AMP1: (52); filtered sea water (FSW)/artificial sea water Pro99: (52).
| Strain name | Source | Morphology | Growth medium |
Incubation temperature (°C) |
| Anabaena sp. PCC 7120* | IBVF | Filamentous | BG11 | 30 |
|
Anabaena cylindrica ATCC29414 |
IBVF | Filamentous | BG11 | 30 |
| Anabaena borealis | CCALA | Filamentous | BG11 | 30 |
| Scytonema hofmanni PCC 7110 | IBVF | Filamentous | BG11 | 30 |
| Leptolyngbya sp. (desert crust) | HUJI | Filamentous | BG11 | 30 |
| Phormidium persicinum | IBVF | Filamentous | f/2 | 26 |
| Trichodesmium erythraeum | MPI-MM | Filamentous | YBCII | 26 |
| Nodularia spumigena | IOW | Filamentous | f/2 [8 PSU (practical salinity unit)] | 20 |
| Chroococcidiopsis sp. PCC 9317 | IBVF | Unicellular | BG11 | 30 |
| Microcystis aeruginosa PCC 7806 | IGB | Unicellular | BG11 | 30 |
| Prochlorococcus sp. MIT9313 | University of Freiburg | Unicellular | AMP1 | 22 |
| Prochlorococcus sp. MIT9312* | Haifa University | Unicellular | ASW-Pro99 | 22 |
| Prochlorococcus sp. MIT0604* | Haifa University | Unicellular | FSW-Pro99 | 22 |
| Prochlorococcus sp. NATL2A* | Haifa University | Unicellular | ASW-Pro99 | 22 |
| Prochlorococcus sp. MED4* | Haifa University | Unicellular | ASW-Pro99 | 22 |
| Synechococcus sp. WH7803* | Haifa University | Unicellular | ASW-Pro99 | 22 |
| Synechococcus sp. WH8102* | Haifa University | Unicellular | ASW-Pro99 | 22 |
Fig. 1. δ13C-CH4 values measured during incubation experiments of 13 different filamentous and unicellular freshwater, soil, and marine cyanobacterial cultures with and without NaH13CO3 supplementation.
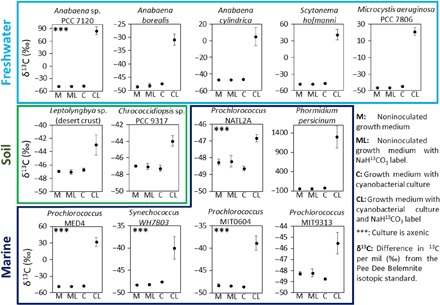
All cyanobacterial cultures produced CH4. Using NaH13CO3 as carbon source (CL) resulted in increasing stable δ13C-CH4 values as compared to the starting condition. This establishes the direct link between carbon fixation and CH4 production. The 13C enrichment is not quantitative and thus not comparable between cultures. Error bars represent SD (n = 4).
Fig. 2. Continuous measurements of CH4 and oxygen under light/dark periods using a MIMS.
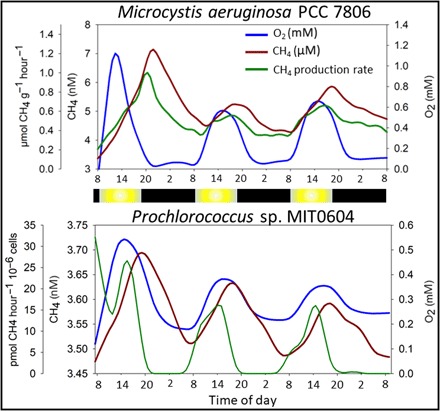
Examples are shown for two cultures. Data for other cultures can be found in fig. S2. A decrease in CH4 concentration is a result of either reduced or no production coupled with degassing from the supersaturated, continuously mixing, semiopen incubation chamber toward equilibrium with atmospheric CH4 (2.5 and 2.1 nM for fresh water and seawater, respectively). Calculated CH4 production rates account for the continuous emission of CH4 from the incubation chamber for as long as the CH4 concentrations are supersaturated. The light regime for the experiments was as follows: Dark (black bars) from 19:30 to 09:00, and then light intensity (yellow bars) was programmed to increase to 60, 120, 180, 400 μmol quanta m−2 s−1 with a hold time of 1.5 hours at each light intensity. After the maximum light period, the light intensity was programmed to decrease in reversed order with the same hold times until complete darkness again at 19:30.
Furthermore, for the following reasons, demethylation of methylphosphonates from the spent growth medium is unlikely to be the mechanism involved in this instance, although some cyanobacteria do have the necessary enzymatic machinery (12, 13). First, thus far, demethylation of methylphosphonates has been shown to occur only under phosphorus starvation, which was highly unlikely in this study since the culture medium contained P (ca. 200 μmol liter−1). Publicly available transcriptomic data for Anabaena sp. PCC 7120 (23, 24) and Trichodesmium erythraeum (25) show that the phosphonate C-P lyase genes are not expressed under standard (P-rich) culture conditions. This was further corroborated by our own transcriptomes of cultures of Anabaena sp. PCC 7120 and Microcystis sp. PCC 7806, where expression of the C-P lyase genes was not detected either in the cyanobacteria or in the accompanying microorganisms. Second, some of the cyanobacteria used in this study (i.e., Microcystis aeruginosa PCC 7806, Synechococcus WH7803 and WH8102, and all sequenced species of Chroococcidiopsis sp., Leptolyngbya sp., Phormidium sp., and Prochlorococcus sp.) do not have the known C-P lyase genes necessary for the conversion of methylphosphonates to CH4. The lack of C-P lyase genes was demonstrated to be a common feature of the genus Prochlorococcus (26). A recent study looking at the processing of methylphosphonates by Prochlorococcus (27) revealed an alternative pathway where methylphosphonates are oxidized to formate. T. erythraeum was shown to internally produce phosphonates as P storage later to be freed by demethylation (28), a process that is likely to release CH4. Nevertheless, the same study shows, although not focusing on cyanobacteria alone, that marine unicellular organisms, such as Synechococcus and Crocosphaera, do not contain any detectable phosphonate storage.
Despite the recent finding of CH4 production during N2 fixation by R. palustris (10), we suggest that N2 fixation is not the source of CH4 production detected in our experiments. First, most cyanobacteria used in this study are unable (i.e., marine Synechococcus, Prochlorococcus, and M. aeruginosa) or unknown (Leptolyngbya sp., P. persicinum) to fix N2. Second, all experiments were conducted in NO3−- or NH4+-rich, fresh media; therefore, N2 fixation in capable cyanobacteria is likely to be inhibited to a certain degree (29). Thus, given the rapid and tight response of the CH4 production with the onset of light, we consider that the mechanism by which cyanobacteria readily convert fixed CO2 to CH4 under light conditions might be closely linked to the photosynthesis process. Inhibitors of photosynthesis, such as atrazine, DBMIB (2,5-dibromo-6-isopropyl-3-methyl-1,4-benzoquinone), and HQNO (2-heptyl-4-quinolinol 1-oxide), inhibit the CH4 production under light conditions (fig. S4) and suggest a connection to the photosynthetic electron transfer chain, although related downstream processes might also be involved in the CH4 formation. However, the exact biochemical pathway(s) involved in light-driven cyanobacteria-derived CH4 formation remains, so far, unknown and thus requires further investigation.
Patterns and rates of the CH4 production were investigated in 17 cultures (the above-mentioned 13 and additional 4) over several days of continuous measurement of CH4 concentration using a membrane inlet mass spectrometry (MIMS) system. Our measurements, lasting 2 to 5 days, showed that the CH4 production occurs both under light and dark conditions (Fig. 2 and fig. S2). This is evident by a positive production rate at almost all times in all experiments. Replicate experiments revealed that, while cyanobacteria repeatedly produced CH4, rates and patterns were not consistent, particularly so for production during the periods of darkness. Often, a period with lower rates of the CH4 production was observed between light and dark phases (Fig. 2 and fig. S2). The latter is evidenced as a decrease in CH4 concentration resulting from degassing of our incubation system. This suggests that different mechanisms may be involved in the CH4 production under light and dark conditions, presumably dependent on freshly generated photosynthetic products during light and on storage compounds during dark periods. Fermentation of storage compounds by cyanobacteria has been previously described and is known to produce, among other compounds, acetate and hydrogen, which are known precursors of acetoclastic CH4 formation (30). Most of the genes required for methanogenesis are present in nonmethanogenic organisms, including cyanobacteria. Nevertheless, in this instance, since the methyl coenzyme reductase (mcr) gene is absent, this would suggest that if cyanobacteria produce CH4 via conventional pathways, then an ortholog of the mcr gene exists, a rather unlikely option considering current knowledge from cyanobacterial genomes.
Methane production rates (Fig. 3) were calculated using the slope of CH4 profiles and were normalized on a cyanobacterial biomass dry weight basis for larger cyanobacteria or cell counts for small-celled marine picophytoplankton. The latter was used to obtain high accuracy for the small cell–sized picophytoplankton, Synechococcus and Prochlorococcus. Hourly CH4 production rates across cultures of larger cyanobacteria were in the range of 0.1 to 3.4 μmol g−1 hour−1 in individual experiments and a mean of 0.51 ± 0.26 μmol g−1 hour−1. Among the marine picophytoplankton, Synechococcus sp. exhibited low rates ranging between 0.01 and 0.6 pmol CH4 per 106 cells hour−1, while Prochlorococcus cultures produced CH4 at rates ranging from 0.8 to 110 pmol CH4 per 106 cells hour−1. When compared to the production rates of typical methanogenic archaea, CH4 production rates of freshwater, soil, and large marine cyanobacteria are three to four orders of magnitude lower than the CH4 production rates noted for typical methanogenic archaea in culture under optimal conditions (oxygen free) but one to three orders of magnitude higher than the rates observed in eukaryotes (fig. S5). In our experiments, Prochlorococcus and Synechococcus cultures produced CH4 only at light intensities above 20 μmol quanta m−2 s−1; therefore, it is likely that only Procholorococcus and Synechococcus communities in the upper water layers contribute to the oceanic CH4 flux to the atmosphere.
Fig. 3. Average CH4 production rates obtained from multiple long-term measurements (2 to 5 days) using a MIMS.
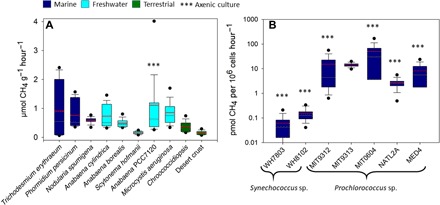
The rates are designated by color according to the environment from which the cyanobacteria were originally isolated. Dark blue, marine environment; light blue, freshwater environment; green, soil environment. Gray and red lines represent median and mean values, respectively. Rates for the larger cyanobacteria in (A) are given in μmol g dry weight−1 hour−1 and rates for the picocyanobacteria (B) are given in pmol per 106 cells per hour−1.
Methane production in oxic soils has been previously discussed and attributed mainly to abiotic factors (31) or methanogenic archaea (32), although the latter was thought unlikely (31, 33). Here, we show that a typical desert crust cyanobacterium (identified in this study as Leptolyngbya sp.), as well as the most common endolithic cyanobacterium Chroococcidiopsis (34), produces CH4 both under light and dark conditions (Fig. 1 and fig. S2), thus inferring a new, but as yet, unknown and unaccounted for source of CH4 from oxic soils.
Cyanobacteria are ubiquitous in nature, and their presence in aquatic systems is expected to increase with eutrophication and rising global temperatures (19). The “methane paradox” describing the production of CH4 in oxic water layers has been known for four decades (35). Although values may vary between water bodies, a recent study suggests that up to 90% of CH4 emitted from freshwater lakes can be produced in the oxic layer (36), with cyanobacteria often being associated with elevated CH4 concentration in oxygen supersaturated freshwater systems (37). In open oceanic environments, distant from any coast, the contribution of lateral transport from anoxic environments is expected to be absent. Nevertheless, on the basis of the emission rates from our laboratory investigations, it is difficult to extrapolate the contribution of cyanobacteria to marine, freshwater, terrestrial, and lastly to the global CH4 budget. First, only one attempt has been performed to estimate the global cyanobacterial biomass (34). That study does not account for the increase in blooms of toxic and nontoxic cyanobacteria in freshwater systems (19, 20, 38–40) nor for less monitored cyanobacterial environments such as those under the ice cover of frozen lakes (41). Recent estimations of Prochlorococcus (42) suggest a global biomass of 3.4 × 1027 cells globally, larger by 33% than estimated in 2003 by Garcia-Pichel et al. (34). Second, while our experiments unambiguously demonstrate the ability of all investigated cyanobacteria to produce CH4, we cannot account for the effect of nutrient concentrations and environmental factors, such as light and temperature, to control emissions in the natural environment. Temperature alone was shown to have a major effect on the Prochlorococcus growth rates (43). Nevertheless, considering the combined day and night average CH4 production rates of high and low light Prochlorococcus species (~9 pmol CH4 per 10−6 cells hour−1), which prevail in the upper 100 m of the oceans, and an average abundance of 108 cells liter−1, the gross daily CH4 production by Prochlorococcus is ~22 nM. This concentration is around one order of magnitude higher than concentrations of CH4 found in seawater that is at atmospheric equilibrium (~2 nM). However, CH4 in the mean mixed layer of the Atlantic Ocean and surface waters of the Mediterranean Sea have been reported to be often supersaturated, reaching maximum CH4 values up to 7 and 25 nM, respectively (44, 45). This simplified calculation demonstrates that Prochlorococcus alone (aside from other marine cyanobacteria) might contribute substantially to the observed oceanic CH4 supersaturation. Moreover, table S1 provides, for estimation purposes, literature-derived estimates of global cyanobacteria biomass divided into several compartments alongside suggested minimum and maximum CH4 production rates derived from the laboratory experiments obtained in our study. These global extrapolations span a wide range depending on the assumptions made, and we would like to note that this simple approach neglects the complexity of aquatic and terrestrial ecosystems; hence, these calculations should only be considered as first rough estimates.
In this study, we show that cyanobacteria can readily convert fixed inorganic carbon into CH4 and emit this potent greenhouse gas under both light and dark conditions. This is in addition to the already established ability of cyanobacteria to produce CH4 by the demethylation of methylphosphonates (12, 13). As a phylum, the Cyanobacteria are the most ubiquitous group of organisms on Earth, thriving in most naturally and artificially illuminated environments almost regardless of temperatures, salinity, and nutrient concentrations. Accordingly, their ability to produce CH4 via different pathways, likely related to their surroundings, makes them important to the present and future global CH4 cycle and budget, even more so as blooms of cyanobacteria are increasing with eutrophication and rising global temperatures (19, 20). A recent study independently predicts that eutrophication resulting in a strong increase in photoautotrophs in the water column (chlorophyll a) will lead to an increase of 30 to 90% in freshwater CH4 emissions (46). According to Fletcher and Schaefer (47), the marked increase in atmospheric CH4 concentrations since 2007 coupled to the decrease in δ13C-CH4 values presumably caused by the increase in 12C-enriched biogenic CH4 sources is difficult to explain with our current understanding of known CH4 sources and sinks of the global CH4 budget. This further highlights the need to fully understand the cyanobacterial contribution to the global CH4 budget and to identify the isotopic signatures of the various CH4 production pathways they might harbor. In addition, as phototrophic prokaryotes such as cyanobacteria have been inhabiting Earth for more than 3.5 billion years (48, 49), they may have had a major contribution to Earth’s CH4 cycle such as during the great oxygenation event or even earlier when the conditions on Earth were more reductive favoring the CH4 production.
Further research will elucidate the biochemical pathways of CH4 formation in cyanobacteria and fully assess the environmental factors affecting it, clarifying its relevance for ecology and the global CH4 budget throughout Earth history, how it might change in the future, and how this CH4 source can be mitigated.
MATERIALS AND METHODS
As part of the routine monitoring at Lake Stechlin, a YSI probe model 6600V2 was deployed to record dissolved oxygen and other physicochemical parameters, which are not displayed here. Concentrations of taxon-specific phytoplankton pigments were measured by a BBE Moldaenke FluoroProbe.
Methane concentrations in Lake Stechlin were determined as follows. Water was transferred from a LIMNOS Water Sampler to 60-ml serum bottles (clear borosilicate glass, ≥88% transmission of photosynthetically active radiation spectrum), flushed three times, and crimp-closed (polytetrafluoroethylene-butyl septa and aluminum caps) without gas bubbles. Dissolved CH4 was extracted using headspace (He) displacement method and measured by a Shimadzu 14A gas chromatography (GC)/flame ionization detector (35°C Permabond free fatty acid phase (FFAP) column on N2, split-less injection, and detection at 140°C). Headspace CH4 was converted to dissolved CH4 concentrations based on Henry’s law and standard conditions.
Cyanobacterial cultures
Seventeen different cyanobacterial cultures were obtained from various sources and grown using the media described in Table 1. All the cultures were used for MIMS measurements, while 13 cultures were used for stable isotope labeling experiments.
Stable isotope labeling experiments
Culturing and treatments
To investigate the production of cyanobacteria-derived CH4, 60-ml vials with 40 ml of liquid and 20 ml of headspace volume (laboratory air) were used and sealed with septa suitable for gas sampling. For the 13C labeling experiments, NaH13CO3 (99% purity; Sigma-Aldrich, Germany) was added, amounting to 10% of the initial dissolved inorganic carbon (DIC) in BG11 (DIC = 0.4 mM, enriched by added NaHCO3; pH 7.0) (50), 4.5% of the DIC in f/2 medium (DIC = 2.01 mM; pH 8.2) (51), and 1% of the DIC in the Pro99-based medium (52) used for axenic Synechococcus and Prochlorococcus cultures. Four different examination groups were used: (i) sterile medium, (ii) sterile medium with NaH13CO3, (iii) sterile medium with culture, and (iv) sterile medium with culture and NaH13CO3; four replicates of each cyanobacterial culture (n = 4).
The cultures were grown under a light-dark cycle of 16 and 8 hours at 22.5°C at a light intensity of ≈30 μmol quanta m−2 s−1 for a total period of 3 days.
Continuous-flow isotope ratio mass spectrometry
Continuous-flow isotope ratio mass spectrometry (CF-IRMS) was used for measurement of the δ13C-CH4 values in the headspace gas above the cultures. Headspace gas from exetainers was transferred to an evacuated sample loop (40 ml), and interfering compounds were then separated by GC, and CH4 was trapped on HayeSep D. The sample was then transferred to the IRMS system (Thermo Finnigan DELTAplus XL, Thermo Finnigan, Bremen, Germany) via an open split. The working reference gas was carbon dioxide of high purity (carbon dioxide 4.5, Messer Griesheim, Frankfurt, Germany) with a known δ13C value of −23.64‰ relative to Vienna Pee Dee belemnite (V-PDB). All δ13C-CH4 values were corrected using three CH4 working standards (Isometric Instruments, Victoria, Canada) calibrated against the International Atomic Energy Agency and the National Institute of Standards and Technology reference substances. The calibrated δ13C-CH4 values of the three working standards were −23.9 ± 0.2‰, −38.3 ± 0.2‰, and −54.5 ± 0.2‰. The average SDs (n = 3) of the CF-IRMS measurements were in the range of 0.1 to 0.3‰. All 13C/12C isotope ratios were expressed in the conventional δ notation in per mil (‰) versus V-PDB using Eq. 1
| (1) |
MIMS experiments
Experiments were conducted using a Bay Instruments (MD, USA) MIMS consisting of a Pfeiffer Vacuum HiCube 80 Eco Turbo pumping station connected to a QMG 220 M1, PrismaPlus, C-SEM, 1 to 100 atomic mass unit, crossbeam ion source mass spectrometer (Pfeiffer Vacuum, Germany). Culture samples were pumped (peristaltic pump, Minipuls 3, Gilson) through a capillary stainless tubing connected to Viton pump tubing, as described by Kana et al. (53). The coiled stainless steel tubing was immersed in a water bath to stabilize the sample temperature. Temperatures were set according to the growth conditions of the different cultures. Inside the vacuum inlet, the sample passed through an 8-mm-long semipermeable microbore silicone membrane (Silastic, DuPont) before exiting the vacuum and returning to the culture chamber, forming a closed system with respect to liquids. This required a 3.5-ml experimental chamber, which consisted of an inner chamber where cultures were placed, and an isolated outer chamber connected to a water bath to maintain the culture at a constant temperature. The experimental chamber was placed on a magnetic stirrer, and the cultures were continuously stirred for the duration of the experiments to prevent the formation of concentration gradients.
Cultures were transferred to a fresh medium before the onset of each experiment after which 3.5 ml of the culture was transferred to the experimental chamber, and an equal volume was used for determination of cell counts or dry weight. The latter was determined by filtering the samples on preweighed combusted GF/F filters (Millipore) and drying at 105°C for 48 hours. In the case of nonhomogeneous cultures, the biomass from the experimental chamber was used at the end of the experiment for determination of dry weight. Marine picophytoplankton cultures were normalized by cell counting using a FACSAria II flow cytometer (BD Biosciences, Heidelberg, Germany) at a flow rate of 23.5 μl min−1 for 2.5 min. Autofluorescence was used to separate cells from salt precipitates in the medium. Cells for counting were collected from the same batch used in the experimental chamber.
The light regime for the experiments was as follows: Dark from 19:30 to 09:00 and then light intensity was programmed to increase to 60, 120, 180, 400 μmol quanta m−2 s−1, with a hold time of 1.5 hours at each intensity. After maximum light, the intensity was programmed to decrease in reverse order with the same hold times until complete darkness again at 19:30. Experiments lasted a minimum of 48 hours with at least one replicate longer than 72 hours. A minimum of three replicate experiments were conducted for each culture. As negative controls, ultrapure water and autoclaved cyanobacterial biomass were measured to test for nonbiogenic CH4 production by the experimental system (fig. S2).
Experiments using photosynthesis inhibitors
Three photosynthesis inhibitors were used to observe their effect on cyanobacterial CH4 production. All three inhibitors were dissolved in water rather than ethanol as the latter results in an ionization pattern that masks that of CH4. Atrazine (catalog number 45330-250MG-R, Sigma-Aldrich) has a solubility of 33 mg liter−1 (153 μM) in water and was used at final concentrations of 5 and 10 μM. DBMIB (catalog number 271993-250MG, Sigma-Aldrich) has a solubility of 132 mg liter−1 (410 μM) and was used at final concentrations of 5, 10, and 40 μM. HQNO (catalog number sc-202654A, Santa Cruz Biotechnology) was described as only very slightly soluble in water without any numerical information. We used culture (0.1 mg ml−1) yet noticed that the powder grains remained nearly intact. Nevertheless, given an observed effect on the culture, we concluded that part of the material dissolved in the culture media. For the experiments, cultures of Anabaena sp. PCC 7120 were concentrated and resuspended in fresh BG11 medium and incubated in a 10-ml analysis chamber connected via circular flow to the MIMS. Inhibitors were introduced via injection of a concentrated solution at 11:00 after 24 hours from the experiment start to allow the culture to acclimate. The light regime used was the same as described above.
Methane calculations
Methane (and oxygen) concentrations were calculated using the ratio relative to the inert gas Ar [mass/charge ratio (m/z), 40]. Methane concentration was deduced from mass 15 (see fig. S7 for the ionization pattern of CH4), which does not overlap with other gases in the sample (54). The CH4, O2, and Ar concentrations in the different media were calculated on the basis of known solubility constants (55) and were calibrated to the measured signals in Milli-Q water and growth media at different temperatures. To further calibrate the CH4(mz15)/Ar ratio, measurements were conducted on air-saturated water at different salinities (fig. S8).
Methane production rates were calculated as the first derivative of the Savizky-Golay (56) smoothed data using the sgolay function in the R package signal (http://r-forge.r-project.org/projects/signal/). To account for the continuous degassing from the CH4 supersaturation experimental chamber, the degassing rate was experimentally determined using rapid heating of air-saturated water from 18° to 30°C, leading to an instant (super)saturation of 127 and 130% for CH4 and Ar, respectively. This procedure was repeated under two mixing conditions: (i) Mixing was applied via magnetic stirring as conducted for most cultures, and (ii) mixing occurred only via the cyclic pumping of sample through the MIMS membrane as applied to Synechococcus and Prochlorococcus cultures. The change in concentration of CH4 was monitored, and a linear (R2 = 0.95) saturation degree–dependent rate was determined. The determined rates given in Eqs. 2 and 3 for type I and type II mixing, respectively, were similar to those determined by comparing the most negative slopes of the culture experiments, when cyanobacterial production rates were expected to be minimal or zero, and the supersaturation state of the culture. Final rates were calculated by adding the absolute values of the local CH4 slope (first derivative) and the local degassing rate (Eqs. 2 and 3)
| (2) |
| (3) |
where Rdegassing is the degassing rate in mol CH4 s−1 and Sat(CH4) is the fraction CH4 saturation state >1 (and <1.3) determined by measured concentration versus calculated solubility.
Transcriptome experiment
Samples for transcriptome analyses were collected in triplicates at five time points during a 24-hour experiment with Anabaena sp. PCC 7120 and M. aeruginosa PCC 7806. For this experiment, a nonaxenic culture of Anabaena sp. PCC 7120 was used. The cultures were divided into 16 60-ml bottles. One of the bottles was connected to the MIMS as described above, while the remaining 15 were incubated under identical light and temperature conditions. The bottles were incubated for 24 to 36 hours of acclimation before T0 was collected on the day of the experiment. T1 was sampled at 09:30, half an hour after the first light was turned on (60 μmol quanta m−2 s−1). T2 was sampled at 12:30, half an hour after the third light was turned on (180 μmol quanta m−2 s−1). T3 was sampled at 20:00, half an hour after all lights were turned off. T4 was collected at 00:00. Collected samples were immediately filtered on polycarbonate filters (pore size, 0.8 μm; Millipore) and frozen at −80°C until further processing.
DNA and RNA extraction and sequencing
To evaluate the presence of methanogenic archaea in nonaxenic cultures, DNA was extracted as described by Nercessian et al. (57). The resulting DNA was sent for Illumina sequencing at MR DNA (Shallowater, TX) on a MiSeq platform (2 × 300 base pairs) using the Arch2A519F (CAGCMGCCGCGGTAA) and Arch1041R (GGCCATGCACCWCCTCTC) primers (58). These primers with a barcode on the forward primer were used in a PCR using the HotStarTaq Plus Master Mix Kit (Qiagen, USA) under the following conditions: 94°C for 3 min, followed by 30 cycles of 94°C for 30 s, 56°C for 40 s, and 72°C for 1 min, after which a final elongation step at 72°C for 5 min was performed. After amplification, PCR products were checked in 2% agarose gel to determine the success of amplification and the relative intensity of bands. The samples were pooled together in equal proportions based on their molecular weight and DNA concentrations. Pooled samples were purified using calibrated AMPure XP beads. Then, the pooled and purified PCR products were used to prepare an Illumina DNA library. Sequencing was performed on a MiSeq following the manufacturer’s guidelines. Archaeal community composition was analyzed using the SILVAngs pipeline (fig. S3) (59). After a standard PCR for the mcrA gene resulted in no visible products from any of the cultures, a quantitative PCR (qPCR) assay was conducted as well.
For RNA extraction, a similar protocol as above was used, followed by DNA removal using the TURBO DNA-free Kit (catalog number AM1907, Thermo Fisher Scientific). Ribosomal RNA was removed from the RNA samples using the RiboMinus Kit (Thermo Fisher Scientific) following the manufacturer’s instructions. The mRNA-enriched samples were sequenced at MR DNA (Shallowater, TX). There, the RNA samples were resuspended in 25 μl of nuclease-free water and further cleaned using the RNeasy PowerClean Pro Cleanup Kit (Qiagen). The concentration of RNA was determined using the Qubit RNA Assay Kit (Life Technologies). Sixty to 500 ng of RNA were used to remove the DNA contamination using Baseline-ZERO DNase (Epicentre) following the manufacturer’s instructions, followed by purification using the RNA Clean & Concentrator columns (Zymo Research). DNA-free RNA samples were used for library preparation using the KAPA mRNA HyperPrep Kits (Roche) following the manufacturer’s instructions. The concentration of double-stranded complementary DNA was evaluated using the Qubit dsDNA HS Assay Kit (Life Technologies). Twenty-five nanograms of DNA was used to prepare the libraries. The protocol starts with enzymatic fragmentation to produce double-stranded DNA (dsDNA) fragments followed by end repair and A-tailing to produce end-repaired, 5′-phosphorylated, 3′-dA–tailed dsDNA fragments. In the adapter ligation step, dsDNA adapters were ligated to 3′-dA–tailed molecules. The final step is library amplification, which uses high fidelity, low-bias PCR to amplify library fragments carrying appropriate adapter sequences on both ends. Following the library preparation, the final concentrations of all the libraries were measured using the Qubit dsDNA HS Assay Kit (Life Technologies), and the average library size was determined using the Agilent 2100 Bioanalyzer (Agilent Technologies). The libraries were then pooled in equimolar ratios of 2 nM, and 8 pmol of the library pool was clustered using the cBot (Illumina) and sequenced paired end for 125 cycles using the HiSeq 2500 system (Illumina).
The resulting raw read data were deposited at the European Nucleotide Archive under project number PRJEB32889.
Transcriptome analysis
The 15 paired-end libraries generated from each experiment were trimmed for quality and sequencing adapters using Trimmomatic v0.39 (60). For purposes of annotation, two strategies were used. For the first approach, all trimmed sequences from a single culture were coassembled using Trinity v2.8.4 (61). The assembled transcripts were then annotated following the Trinotate pipeline (62), replacing BLAST with Diamond v0.9.22 (63). For the second approach, the trimmed reads from each sample were mapped to the genes of either Anabaena sp. PCC 7120 (GCA_000009705.1) or M. aeruginosa PCC 7806 (GCA_002095975.1). The full results of these experiments including differential expression will be eventually published separately.
Quantitative real-time PCR assay
The abundance of methanogens was measured with qPCR specific for the mcrA gene encoding the alpha subunit of methyl coenzyme M reductase, the key enzyme of archaeal methanogenesis. The primer pair mlas-mod forward (GGYGGTGTMGGDTTCACMCARTA)/mcrA- reverse (CGTTCATBGCGTAGTTVGGRTAGT) (64) was used. The assay was performed on a qTOWER 2.2 instrument (Analytik Jena, Germany). Assays were performed in a 15-μl volume containing 7.5 μl of innuMIX qPCR MasterMix SyGreen (Analytik Jena), 0.75 μl of each primer (10 pmol/μl), 5 μl of ddH2O, and 1 μl of template DNA. Assay conditions were 95°C initial denaturation for 5 min, 35 cycles of denaturation (95°C) for 30 s, annealing (60°C) for 45 s, and elongation (72°C) for 45 s, followed by melting curve analysis. Triplicate assays were performed for each sample, with template DNA concentrations of 10 ng/μl. A parallel standard curve of mcrA genes was recorded. The standard curve DNA fragment consisted of the mcrA gene of a Methanomassiliicoccus sp. from cow rumen fluid cloned into the pGEM-T Easy Vector System (Promega, Mannheim, Germany), amplified with vector-specific primers sp6 and T7. The qPCR assay parameters were as follows: slope, 3.55; efficiency, 0.91; R2 > 0.99.
Supplementary Material
Acknowledgments
In situ probe data were obtained from the LakeLab (www.lakelab.de) as part of the routine monitoring of Lake Stechlin run by the Leibniz Institute of Freshwater Ecology and Inland Fisheries. We thank the technical assistants of department III for making these data available. We thank the members of the MIBI group and, particularly, J. Woodhouse for assistance in sampling, analysis, and discussion of the data. We thank D. Münch from the Institute of Microbiology, University of Greifswald for the technical assistance with the qPCR analysis. We thank C. Steglich and W. Hess from the Freiburg University for the Prochlorococcus culture. We thank F. Pollehne from the Institute of Baltic Sea Research for the Nodularia culture. We thank M. Eichner from the Max Planck Institute for Marine Microbiology for the Trichodesmium culture. We thank D. Sher and D. Roth from the Haifa University for the cultures of Synechococcus WH7803 and WH8102 and Prochlorococcus MIT9312, NATL2A, MIT0604, and MED4. We thank K. Makower and J. Woodhouse for assistance with the transcriptomic experiment. Funding: Funding was provided to M.B., D.I., and H.-P.G. via the DFG-Aquameth project (GR1540-21-1), the BMBF-BIBS project (01LC1501G), and the Human Frontiers Science project (HFSP; 2039371). M.B. was additionally funded through the DFG eigene Stelle project (BI 1987/2-1). M.Y.H. was funded through the train-the-trainer exchange program of the German Academic Exchange Service (DAAD). F.K. and T.K. were supported by the German Research Foundation (DFG; KE 884/8-2, KE 884/11-1, and KE 884/16-2). T.U. acknowledges financial support from the ESF and the Ministry of Education, Science and Culture of Mecklenburg-Western Pomerania project WETSCAPES (ESF/14-BM-A55-0032/16). Author contributions: M.B., T.K., D.I., F.K., and H.-P.G. conceived the study and designed the experiments. M.B., D.I., M.Y.H., M.G., A.M.M.-P., and W.E. performed the MIMS experiments and in situ measurements and analyzed the data. T.K. performed the stable isotope measurements and, together with F.K., analyzed the data. M.B. and D.I. performed the transcriptomic experiments and microbial community analysis. A.M.M.-P. analyzed the transcriptomics data. T.U. performed the qPCR analysis. M.B., T.K., D.I., M.Y.H., M.G., A.M.M.-P., W.E., T.U., F.K., and H.-P.G. discussed the results and wrote the paper. Competing interests: The authors declare that they have no competing interests. Data and materials availability: All data needed to evaluate the conclusions in the paper are present in the paper and/or the Supplementary Materials. The sequences were submitted to the European Nucleotide Archive under project numbers PRJEB25851 and PRJEB32889. Additional data related to this paper may be requested from the authors.
SUPPLEMENTARY MATERIALS
Supplementary material for this article is available at http://advances.sciencemag.org/cgi/content/full/6/3/eaax5343/DC1
Fig. S1. Temporal profiles of CH4, O2, and cyanobacterial derived chlorophyll a between July 2014 and 2016.
Fig. S2. Continuous measurements of CH4 and oxygen under light/dark cycles using a MIMS in 17 different cyanobacterial cultures.
Fig. S3. Community composition of the cyanobacterial cultures as obtained when sequenced using archaea-specific primers resulting in 71,981 reads for PCC 7110, 5442 reads for PCC 7806, 14,489 reads for PCC 9317, 91,105 reads for A. borealis, 13,173 reads for ATCC29414, 133,336 reads for Leptolyngbia sp., 172,112 reads for MIT9313, 35,257 for T. erythraeum, and 82,190 reads for P. persicinum of 200,000 commissioned reads.
Fig. S4. Effects of photosynthesis inhibitors on cyanobacterial CH4 production.
Fig. S5. Average CH4 production rates (μmol g dry weight−1 hour−1) obtained from multiple long-term measurements (2 to 5 days) with a MIMS.
Fig. S6. Methane ionization pattern.
Fig. S7. Raw signal obtained from mass 15 (CH4) and mass 40 (Argon) plotted against the calculated solubility at different salinities at 30°C.
Table S1. Estimated global CH4 production rates divided into various cyanobacterial habitats showing the potential contribution of cyanobacteria in global CH4 cycling.
REFERENCES AND NOTES
- 1.Intergovernmental Panel on Climate Change, Ed., Climate Change 2013 - The Physical Science Basis (Cambridge Univ. Press, Cambridge, 2014). [Google Scholar]
- 2.Saunois M., Bousquet P., Poulter B., Peregon A., Ciais P., Canadell J. G., Dlugokencky E. J., Etiope G., Bastviken D., Houweling S., Janssens-Maenhout G., Tubiello F. N., Castaldi S., Jackson R. B., Alexe M., Arora V. K., Beerling D. J., Bergamaschi P., Blake D. R., Brailsford G., Brovkin V., Bruhwiler L., Crevoisier C., Crill P., Covey K., Curry C., Frankenberg C., Gedney N., Höglund-Isaksson L., Ishizawa M., Ito A., Joos F., Kim H.-S., Kleinen T., Krummel P., Lamarque J.-F., Langenfelds R., Locatelli R., Machida T., Maksyutov S., McDonald K. C., Marshall J., Melton J. R., Morino I., Naik V., O’Doherty S., Parmentier F.-J. W., Patra P. K., Peng C., Peng S., Peters G. P., Pison I., Prigent C., Prinn R., Ramonet M., Riley W. J., Saito M., Santini M., Schroeder R., Simpson I. J., Spahni R., Steele P., Takizawa A., Thornton B. F., Tian H., Tohjima Y., Viovy N., Voulgarakis A., van Weele M., van der Werf G. R., Weiss R., Wiedinmyer C., Wilton D. J., Wiltshire A., Worthy D., Wunch D., Xu X., Yoshida Y., Zhang B., Zhang Z., Zhu Q., The global methane budget 2000-2012. Earth Syst. Sci. Data. 8, 697–751 (2016). [Google Scholar]
- 3.Lenhart K., Klintzsch T., Langer G., Nehrke G., Bunge M., Schnell S., Keppler F., Evidence for methane production by the marine algae Emiliania huxleyi. Biogeosciences 13, 3163–3174 (2016). [Google Scholar]
- 4.Keppler F., Hamilton J. T. G., Braß M., Röckmann T., Methane emissions from terrestrial plants under aerobic conditions. Nature 439, 187–191 (2006). [DOI] [PubMed] [Google Scholar]
- 5.Tuboly E., Szabó A., Garab D., Bartha G., Janovszky Á., Ero″s G., Szabó A., Mohácsi Á., Szabó G., Kaszaki J., Ghyczy M., Boros M., Methane biogenesis during sodium azide-induced chemical hypoxia in rats. Am. J. Physiol. Physiol. 304, C207–C214 (2013). [DOI] [PubMed] [Google Scholar]
- 6.Lenhart K., Bunge M., Ratering S., Neu T. R., Schüttmann I., Greule M., Kammann C., Schnell S., Müller C., Zorn H., Keppler F., Evidence for methane production by saprotrophic fungi. Nat. Commun. 3, 1046 (2012). [DOI] [PubMed] [Google Scholar]
- 7.Keppler F., Schiller A., Ehehalt R., Greule M., Hartmann J., Polag D., Stable isotope and high precision concentration measurements confirm that all humans produce and exhale methane. J. Breath Res. 10, 016003 (2016). [DOI] [PubMed] [Google Scholar]
- 8.Repeta D. J., Ferrón S., Sosa O. A., Johnson C. G., Repeta L. D., Acker M., DeLong E. F., Karl D. M., Marine methane paradox explained by bacterial degradation of dissolved organic matter. Nat. Geosci. 9, 884–887 (2016). [Google Scholar]
- 9.Wang Q., Dore J. E., McDermott T. R., Methylphosphonate metabolism by Pseudomonas sp. populations contributes to the methane oversaturation paradox in an oxic freshwater lake. Environ. Microbiol. 19, 2366–2378 (2017). [DOI] [PubMed] [Google Scholar]
- 10.Zheng Y., Harris D. F., Yu Z., Fu Y., Poudel S., Ledbetter R. N., Fixen K. R., Yang Z. Y., Boyd E. S., Lidstrom M. E., Seefeldt L. C., Harwood C. S., A pathway for biological methane production using bacterial iron-only nitrogenase. Nat. Microbiol. 3, 281–286 (2018). [DOI] [PubMed] [Google Scholar]
- 11.Lenhart K., Weber B., Elbert W., Steinkamp J., Clough T., Crutzen P., Pöschl U., Keppler F., Nitrous oxide and methane emissions from cryptogamic covers. Glob. Chang. Biol. 21, 3889–3900 (2015). [DOI] [PubMed] [Google Scholar]
- 12.Beversdorf L. J., White A. E., Björkman K. M., Letelier R. M., Karl D. M., Phosphonate metabolism by Trichodesmium IMS101 and the production of greenhouse gases. Limnol. Oceanogr. 55, 1768–1778 (2010). [Google Scholar]
- 13.Gomez-Garcia M. R., Davison M., Blain-Hartnung M., Grossman A. R., Bhaya D., Alternative pathways for phosphonate metabolism in thermophilic cyanobacteria from microbial mats. ISME J. 5, 141–149 (2011). [DOI] [PMC free article] [PubMed] [Google Scholar]
- 14.Yao M., Henny C., Maresca J. A., Freshwater bacteria release methane as a by-product of phosphorus acquisition. Appl. Environ. Microbiol. 82, 6994–7003 (2016). [DOI] [PMC free article] [PubMed] [Google Scholar]
- 15.Berg A., Lindblad P., Svensson B. H., Cyanobacteria as a source of hydrogen for methane formation. World J. Microbiol. Biotechnol. 30, 539–545 (2014). [DOI] [PubMed] [Google Scholar]
- 16.Puente-Sánchez F., Arce-Rodríguez A., Oggerin M., García-Villadangos M., Moreno-Paz M., Blanco Y., Rodríguez N., Bird L., Lincoln S. A., Tornos F., Prieto-Ballesteros O., Freeman K. H., Pieper D. H., Timmis K. N., Amils R., Parro V., Viable cyanobacteria in the deep continental subsurface. Proc. Natl. Acad. Sci. U.S.A. 115, 10702–10707 (2018). [DOI] [PMC free article] [PubMed] [Google Scholar]
- 17.Hubalek V., Wu X., Eiler A., Buck M., Heim C., Dopson M., Bertilsson S., Ionescu D., Connectivity to the surface determines diversity patterns in subsurface aquifers of the Fennoscandian shield. ISME J. 10, 2447–2458 (2016). [DOI] [PMC free article] [PubMed] [Google Scholar]
- 18.Gumsley A. P., Chamberlain K. R., Bleeker W., Söderlund U., de Kock M. O., Larsson E. R., Bekker A., Timing and tempo of the Great Oxidation Event. Proc. Natl. Acad. Sci. U.S.A. 114, 1811–1816 (2017). [DOI] [PMC free article] [PubMed] [Google Scholar]
- 19.Visser P. M., Verspagen J. M. H., Sandrini G., Stal L. J., Matthijs H. C. P., Davis T. W., Paerl H. W., Huisman J., How rising CO2 and global warming may stimulate harmful cyanobacterial blooms. Harmful Algae 54, 145–159 (2016). [DOI] [PubMed] [Google Scholar]
- 20.Huisman J., Codd G. A., Paerl H. W., Ibelings B. W., Verspagen J. M. H., Visser P. M., Cyanobacterial blooms. Nat. Rev. Microbiol. 16, 471–483 (2018). [DOI] [PubMed] [Google Scholar]
- 21.Angle J. C., Morin T. H., Solden L. M., Narrowe A. B., Smith G. J., Borton M. A., Rey-Sanchez C., Daly R. A., Mirfenderesgi G., Hoyt D. W., Riley W. J., Miller C. S., Bohrer G., Wrighton K. C., Methanogenesis in oxygenated soils is a substantial fraction of wetland methane emissions. Nat. Commun. 8, 1567 (2017). [DOI] [PMC free article] [PubMed] [Google Scholar]
- 22.Peters V., Conrad R., Methanogenic and other strictly anaerobic bacteria in desert soil and other oxic soils. Appl. Environ. Microbiol. 61, 1673–1676 (1995). [DOI] [PMC free article] [PubMed] [Google Scholar]
- 23.Flaherty B. L., Van Nieuwerburgh F., Head S. R., Golden J. W., Directional RNA deep sequencing sheds new light on the transcriptional response of Anabaena sp. strain PCC 7120 to combined-nitrogen deprivation. BMC Genomics 12, 332 (2011). [DOI] [PMC free article] [PubMed] [Google Scholar]
- 24.Mitschke J., Vioque A., Haas F., Hess W. R., Muro-Pastor A. M., Dynamics of transcriptional start site selection during nitrogen stress-induced cell differentiation in Anabaena sp. PCC7120. Proc. Natl. Acad. Sci. U.S.A. 108, 20130–20135 (2011). [DOI] [PMC free article] [PubMed] [Google Scholar]
- 25.Pfreundt U., Kopf M., Belkin N., Berman-Frank I., Hess W. R., The primary transcriptome of the marine diazotroph Trichodesmium erythraeum IMS101. Sci. Rep. 4, 6187 (2014). [DOI] [PMC free article] [PubMed] [Google Scholar]
- 26.Luo C., Konstantinidis K. T., Phosphorus-related gene content is similar in Prochlorococcus populations from the North Pacific and North Atlantic Oceans. Proc. Natl. Acad. Sci. U.S.A. 108, E62–E63 (2011). [DOI] [PMC free article] [PubMed] [Google Scholar]
- 27.Sosa O. A., Casey J. R., Karl D. M., Methylphosphonate oxidation in Prochlorococcus strain MIT9301 supports phosphate acquisition, formate excretion, and carbon assimilation into purines. Appl. Environ. Microbiol. 85, e00289–19 (2019). [DOI] [PMC free article] [PubMed] [Google Scholar]
- 28.Dyhrman S. T., Benitez-Nelson C. R., Orchard E. D., Haley S. T., Pellechia P. J., A microbial source of phosphonates in oligotrophic marine systems. Nat. Geosci. 2, 696–699 (2009). [Google Scholar]
- 29.Knapp A. N., The sensitivity of marine N2 fixation to dissolved inorganic nitrogen. Front. Microbiol. 3, 374 (2012). [DOI] [PMC free article] [PubMed] [Google Scholar]
- 30.Stal L. J., Moezelaar R., Fermentation in cyanobacteria. FEMS Microbiol. Rev. 21, 179–211 (1997). [Google Scholar]
- 31.Jugold A., Althoff F., Hurkuck M., Greule M., Lenhart K., Lelieveld J., Keppler F., Non-microbial methane formation in oxic soils. Biogeosciences 9, 5291–5301 (2012). [Google Scholar]
- 32.Hao W. M., Scharffe D., Crutzen P. J., Sanhueza E., Production of N2O, CH4, and CO2 from soils in the tropical savanna during the dry season. J. Atmos. Chem. 7, 93–105 (1988). [Google Scholar]
- 33.Kammann C., Hepp S., Lenhart K., Müller C., Stimulation of methane consumption by endogenous CH4 production in aerobic grassland soil. Soil Biol. Biochem. 41, 622–629 (2009). [Google Scholar]
- 34.Garcia-Pichel F., Belnap J., Neuer S., Schanz F., Estimates of global cyanobacterial biomass and its distribution. Arch. Hydrobiol. Suppl. Algol. Stud. 109, 213–227 (2003). [Google Scholar]
- 35.Scranton M. I., Farrington J. W., Methane production in the waters off Walvis Bay. J. Geophys. Res. 82, 4947–4953 (1977). [Google Scholar]
- 36.Donis D., Flury S., Stöckli A., Spangenberg J. E., Vachon D., McGinnis D. F., Full-scale evaluation of methane production under oxic conditions in a mesotrophic lake. Nat. Commun. 8, 1661 (2017). [DOI] [PMC free article] [PubMed] [Google Scholar]
- 37.Grossart H.-P., Frindte K., Dziallas C., Eckert W., Tang K. W., Microbial methane production in oxygenated water column of an oligotrophic lake. Proc. Natl. Acad. Sci. U.S.A. 108, 19657–19661 (2011). [DOI] [PMC free article] [PubMed] [Google Scholar]
- 38.Paerl H. W., Huisman J., Climate: Blooms like it hot. Science 320, 57–58 (2008). [DOI] [PubMed] [Google Scholar]
- 39.Glibert P. M., Maranger R., Sobota D. J., Bouwman L., The Haber Bosch–harmful algal bloom (HB–HAB) link. Environ. Res. Lett. 9, 105001 (2014). [Google Scholar]
- 40.Bowling L. C., Blais S., Sinotte M., Heterogeneous spatial and temporal cyanobacterial distributions in Missisquoi Bay, Lake Champlain: An analysis of a 9 year data set. J. Great Lakes Res. 41, 164–179 (2015). [Google Scholar]
- 41.Bižić-Ionescu M., Amann R., Grossart H.-P., Massive regime shifts and high activity of heterotrophic bacteria in an ice-covered lake. PLOS ONE 9, e113611 (2014). [DOI] [PMC free article] [PubMed] [Google Scholar]
- 42.Lange P. K., Brewin R., Dall’Olmo G., Tarran G., Sathyendranath S., Zubkov M., Bouman H., Scratching beneath the surface: A model to predict the vertical distribution of Prochlorococcus using remote sensing. Remote Sens. 10, 847 (2018). [Google Scholar]
- 43.Ribalet F., Swalwell J., Clayton S., Jiménez V., Sudek S., Lin Y., Johnson Z. I., Worden A. Z., Armbrust E. V., Light-driven synchrony of Prochlorococcus growth and mortality in the subtropical Pacific gyre. Proc. Natl. Acad. Sci. U.S.A. 112, 8008–8012 (2015). [DOI] [PMC free article] [PubMed] [Google Scholar]
- 44.Forster G., Upstill-Goddard R. C., Gist N., Robinson C., Uher G., Woodward E. M. S., Nitrous oxide and methane in the Atlantic Ocean between 50°N and 52°S: Latitudinal distribution and sea-to-air flux. Deep Sea Res. Part II Top. Stud. Oceanogr. 56, 964–976 (2009). [Google Scholar]
- 45.Grilli R., Triest J., Chappellaz J., Calzas M., Desbois T., Jansson P., Guillerm C., Ferré B., Lechevallier L., Ledoux V., Romanini D., Sub-ocean: Subsea dissolved methane measurements using an embedded laser spectrometer technology. Environ. Sci. Technol. 52, 10543–10551 (2018). [DOI] [PubMed] [Google Scholar]
- 46.Beaulieu J. J., DelSontro T., Downing J. A., Eutrophication will increase methane emissions from lakes and impoundments during the 21st century. Nat. Commun. 10, 1375 (2019). [DOI] [PMC free article] [PubMed] [Google Scholar]
- 47.Fletcher S. E. M., Schaefer H., Rising methane: A new climate challenge. Science 364, 932–933 (2019). [DOI] [PubMed] [Google Scholar]
- 48.Frei R., Crowe S. A., Bau M., Polat A., Fowle D. A., Døssing L. N., Oxidative elemental cycling under the low O2 Eoarchean atmosphere. Sci. Rep. 6, 21058 (2016). [DOI] [PMC free article] [PubMed] [Google Scholar]
- 49.Falcón L. I., Magallón S., Castillo A., Dating the cyanobacterial ancestor of the chloroplast. ISME J. 4, 777–783 (2010). [DOI] [PubMed] [Google Scholar]
- 50.Rippka R., Deruelles J., Waterbury J. B., Herdman M., Stanier R. Y., Generic assignments, strain histories and properties of pure cultures of cyanobacteria. Microbiology 111, 1–61 (1979). [Google Scholar]
- 51.Guillard R. R. L., Ryhter J. H., Studies of marine planktonic diatoms: I. Cyclotella nana Hustedt, and Detonula confervacea (cleve) Gran. Can. J. Microbiol. 8, 229–239 (1962). [DOI] [PubMed] [Google Scholar]
- 52.Moore L. R., Coe A., Zinser E. R., Saito M. A., Sullivan M. B., Lindell D., Frois-Moniz K., Waterbury J., Chisholm S. W., Culturing the marine cyanobacterium Prochlorococcus. Limnol. Oceanogr. Methods 5, 353–362 (2007). [Google Scholar]
- 53.Kana T. M., Cornwell J. C., Zhong L., Determination of denitrification in the Chesapeake Bay from measurements of N2 accumulation in bottom water. Estuar. Coasts 29, 222–231 (2006). [Google Scholar]
- 54.Schlüter M., Gentz T., Application of membrane inlet mass spectrometry for online and in situ analysis of methane in aquatic environments. J. Am. Soc. Mass Spectrom. 19, 1395–1402 (2008). [DOI] [PubMed] [Google Scholar]
- 55.Powell R. J., Solubility of 16 gases in heptacosafluorotributylamine and carbon disulfide. J. Chem. Eng. Data 17, 302–304 (1972). [Google Scholar]
- 56.Savitzky A., Golay M. J. E., Smoothing and differentiation of data by simplified least squares procedures. Anal. Chem. 36, 1627–1639 (1964). [Google Scholar]
- 57.Nercessian O., Noyes E., Kalyuzhnaya M. G., Lidstrom M. E., Chistoserdova L., Bacterial populations active in metabolism of C1 compounds in the sediment of Lake Washington, a freshwater lake. Appl. Environ. Microbiol. 71, 6885–6899 (2005). [DOI] [PMC free article] [PubMed] [Google Scholar]
- 58.Fischer M. A., Güllert S., Neulinger S. C., Streit W. R., Schmitz R. A., Evaluation of 16S rRNA gene primer pairs for monitoring microbial community structures showed high reproducibility within and low comparability between datasets generated with multiple archaeal and bacterial primer pairs. Front. Microbiol. 7, 1297 (2016). [DOI] [PMC free article] [PubMed] [Google Scholar]
- 59.Ionescu D., Siebert C., Polerecky L., Munwes Y. Y., Lott C., Häusler S., Bižić-Ionescu M., Quast C., Peplies J., Glöckner F. O., Ramette A., Rödiger T., Dittmar T., Oren A., Geyer S., Stärk H. J., Sauter M., Licha T., Laronne J. B., de Beer D., Microbial and chemical characterization of underwater fresh water springs in the Dead Sea. PLOS ONE 7, e38319 (2012). [DOI] [PMC free article] [PubMed] [Google Scholar]
- 60.Bolger A. M., Lohse M., Usadel B., Trimmomatic: A flexible trimmer for Illumina sequence data. Bioinformatics 30, 2114–2120 (2014). [DOI] [PMC free article] [PubMed] [Google Scholar]
- 61.Grabherr M. G., Haas B. J., Yassour M., Levin J. Z., Thompson D. A., Amit I., Adiconis X., Fan L., Raychowdhury R., Zeng Q., Chen Z., Mauceli E., Hacohen N., Gnirke A., Rhind N., di Palma F., Birren B. W., Nusbaum C., Lindblad-Toh K., Friedman N., Regev A., Full-length transcriptome assembly from RNA-Seq data without a reference genome. Nat. Biotechnol. 29, 644–652 (2011). [DOI] [PMC free article] [PubMed] [Google Scholar]
- 62.Bryant D. M., Johnson K., DiTommaso T., Tickle T., Couger M. B., Payzin-Dogru D., Lee T. J., Leigh N. D., Kuo T. H., Davis F. G., Bateman J., Bryant S., Guzikowski A. R., Tsai S. L., Coyne S., Ye W. W., Freeman R. M. Jr., Peshkin L., Tabin C. J., Regev A., Haas B. J., Whited J. L., A tissue-mapped axolotl de novo transcriptome enables identification of limb regeneration factors. Cell Rep. 18, 762–776 (2017). [DOI] [PMC free article] [PubMed] [Google Scholar]
- 63.Buchfink B., Xie C., Huson D. H., Fast and sensitive protein alignment using DIAMOND. Nat. Methods 12, 59–60 (2015). [DOI] [PubMed] [Google Scholar]
- 64.Steinberg L. M., Regan J. M., mcrA-targeted real-time quantitative PCR method to examine methanogen communities. Appl. Environ. Microbiol. 75, 4435–4442 (2009). [DOI] [PMC free article] [PubMed] [Google Scholar]
- 65.Chen Y.-B., Zehr J. P., Mellon M., Growth and nitrogen fixation of the diazotrophic filamentous nonheterocystous cyanobacterium Trichodesmium sp. IMS 101 in defined media: Evidence for a circadian rhythm1. J. Phycol. 32, 916–923 (1996). [Google Scholar]
- 66.Mountfort D. O., Asher R. A., Effect of inorganic sulfide on the growth and metabolism of Methanosarcina barkeri strain DM. Appl. Environ. Microbiol. 37, 670–675 (1979). [DOI] [PMC free article] [PubMed] [Google Scholar]
- 67.Kröninger L., Gottschling J., Deppenmeier U., Growth characteristics of Methanomassiliicoccus luminyensis and expression of methyltransferase encoding genes. Archaea 2017, 2756573 (2017). [DOI] [PMC free article] [PubMed] [Google Scholar]
- 68.Gerhard E., Butsch B. M., Marison I. W., von Stocker U., Improved growth and methane production conditions for Methanobacterium thermoautotrophicum. Appl. Microbiol. Biotechnol. 40, 432–437 (1993). [Google Scholar]
- 69.Brüggemann N., Meier R., Steigner D., Zimmer I., Louis S., Schnitzler J. P., Nonmicrobial aerobic methane emission from poplar shoot cultures under low-light conditions. New Phytol. 182, 912–918 (2009). [DOI] [PubMed] [Google Scholar]
- 70.Wishkerman A., Greiner S., Ghyczy M., Boros M., Rausch T., Lenhart K., Keppler F., Enhanced formation of methane in plant cell cultures by inhibition of cytochrome c oxidase. Plant Cell Environ. 34, 457–464 (2011). [DOI] [PubMed] [Google Scholar]
- 71.Qaderi M. M., Reid D. M., Methane emissions from six crop species exposed to three components of global climate change: Temperature, ultraviolet-B radiation and water stress. Physiol. Plant. 137, 139–147 (2009). [DOI] [PubMed] [Google Scholar]
Associated Data
This section collects any data citations, data availability statements, or supplementary materials included in this article.
Supplementary Materials
Supplementary material for this article is available at http://advances.sciencemag.org/cgi/content/full/6/3/eaax5343/DC1
Fig. S1. Temporal profiles of CH4, O2, and cyanobacterial derived chlorophyll a between July 2014 and 2016.
Fig. S2. Continuous measurements of CH4 and oxygen under light/dark cycles using a MIMS in 17 different cyanobacterial cultures.
Fig. S3. Community composition of the cyanobacterial cultures as obtained when sequenced using archaea-specific primers resulting in 71,981 reads for PCC 7110, 5442 reads for PCC 7806, 14,489 reads for PCC 9317, 91,105 reads for A. borealis, 13,173 reads for ATCC29414, 133,336 reads for Leptolyngbia sp., 172,112 reads for MIT9313, 35,257 for T. erythraeum, and 82,190 reads for P. persicinum of 200,000 commissioned reads.
Fig. S4. Effects of photosynthesis inhibitors on cyanobacterial CH4 production.
Fig. S5. Average CH4 production rates (μmol g dry weight−1 hour−1) obtained from multiple long-term measurements (2 to 5 days) with a MIMS.
Fig. S6. Methane ionization pattern.
Fig. S7. Raw signal obtained from mass 15 (CH4) and mass 40 (Argon) plotted against the calculated solubility at different salinities at 30°C.
Table S1. Estimated global CH4 production rates divided into various cyanobacterial habitats showing the potential contribution of cyanobacteria in global CH4 cycling.